


This study aimed at analyzing the influence of the innovation culture in innovation performance of products and processes in the textile industry of Vale do Itajaí – SC. The study is characterized as causal, survey and quantitative. The sample included 287 respondents. Data were analyzed by structural equation modeling. A positive ratio between culture of innovation and performance in innovation of products and processes was realized. It was found that innovation culture has greater influence on the process than on the product, and that the size of the organization does not influence the performance in product and processes innovation for the sample studied.
The textile sector is traditional in the global industrial segment (IEMI, 2004) and its growth depends on the industry ability to innovate its products using advanced and flexible processes, focusing on the organizational structure and business practices in competitiveness (Euratex, 2004). The sector faced competition from countries like China and Vietnam and with this, textile companies have been forced to make changes in their organizational structure, forms of production and work organization, as well as in the processes of technological innovation (Silva Filho & Queiroz, 2010).
Attempts to innovate in the textile chain are timid and based on purchase of machinery and equipment, which weakens the chosen competitive strategy giving space to imported products (Costa & Rocha, 2009). Innovation is the basis for economic growth and can be a source of sustainable competitive advantage, being fundamental for organizations that want to remain in focus in the market. It is implicit in the literature that one of the factors that can stimulate the propensity to innovate is the organizational culture (Martins & Terblanche, 2003; Tushman & O’Reilly, 1997).
It is noticed a lack of empirical studies on the relation between organizational culture and innovation (Martins & Terblanche, 2003; Obenchain & Johnson, 2004). However, studies such as those of Martins and Terblanche (2003), Jamrog and Overholt (2004), Hartmann (2006), Naranjo-Valencia, Sanz-Valle, and Jimenez (2010) and Büschgens, Bausch, and Balkin (2013) point out that innovation can be stimulated by characteristics of organizational culture, as this can influence employee behavior, leading them to accept or not the organization values as well as sign a commitment to company objectives (Naranjo-Valencia, Jimenez, & Sanz-Valle, 2012).
Textile industries need to constantly innovate, as pressures from other countries, such as Asians, favorable performance in innovation may be a determinant for companies to remain competitive. Considering the aforementioned, the objective of this study is to analyze the influence of the innovation culture in innovation performance of products and processes in the textile industry of Vale do Itajaí – SC.
Therefore, it was used as a basis studies by Martins and Terblanche (2003) from the perspective of the innovation culture determinants – strategy, structure, support mechanisms, behaviors that foster innovation, and communication. For Performance in Innovation, Alegre, Lapiedra, and Chiva works (2006) were used; and the recommendations of the Organization for Economic Cooperation and Development – OCDE (2005) were used for Product and Process dimensions. The model adapted from Alegre et al. (2006) has already been tested and validated by Gomes (2013) in Brazil.
The theoretical justification lies in the possibility to understand the culture influence on performance in innovation. Despite the increase in publications, there are few works that refer to research on industrial organizations, so this study is to contribute to fill this gap. The practice reason stems from the importance of studying in Santa Catarina textile industry, because the industry has sought to innovate to remain in the market ahead to foreign competitors. The proposed analysis can be useful as a strategic tool for companies to become aware of the practices that impact the performance of innovations accomplished by them.
Model used to describe the innovation cultureMartins and Terblanche (2003) and Martins, Martins, and Terblanche (2004) model provides an initial vision to improve understanding of the variables that influence the dimensions of innovation culture. The proposed model is divided into five determinants: strategy, structure, support mechanisms, behaviors that encourage innovation and communication. Based on these factors, 15 variables to be measured were developed. Following, five determinants of organizational culture are presented.
Strategy: Ahmed (1998) suggests that mission and vision, when well defined, influence the creation of a strong culture, guiding the behaviors and actions of organizational actors. Clear principles facilitate the understanding of those involved in the organization, making them walk in the same direction (Ouchi, 1983). Organizational objectives and goals express the organization values and may encourage or hinder innovation (Arad, Hanson, & Schneider, 1997). Innovation occurs in organizations with mission and vision focused on the client, management processes, leadership and support mechanisms (Martins & Terblanche, 2003).
Structure: Although the structure of an organization is defined as the sum of different parts of a business (Mintzberg, 1978), few organizations recognize that different groups act in different ways, hindering the development of innovation (Trot, 2012). The size of an organization is one of the factors that influence in its structure and in its innovation process. Large organizations have some advantages, such as greater availability of resources. However, they may be more bureaucratized and less flexible, being more resistant to changes (Damanpour, 1996). Saraiva, Pimenta, and Correa (2005) state that the textile industry flexibility can be seen in the labor force, which is multitasked. This flexibility can also be seen in production (Piccinini, Oliveira, & Fontoura, 2006).
Support mechanisms: Support mechanisms should compose the culture of an organization to create an environment with conditions for stimulating creativity and innovation (Martins & Terblanche, 2003). Rewards and recognition, as well as information and creativity are mechanisms that perform this function (Arad et al., 1997). The organizational culture that promotes creativity and innovation should allow time flexibility so that employees can be inspired and creativity can come to light (Shattow, 1996). Information technology is a feature used for innovation favorable performance (Martins & Terblanche, 2003).
Behaviors that stimulate innovation: The fault tolerance is essential in the development of an organizational culture that aims to promote creativity and innovation. Rewarding success and recognizing and celebrating the failures causes the facts to be remembered, and people may learn from mistakes (Tushman & O’Reilly, 1997).
When employees are encouraged to generate new ideas without being harmed, there is an incentive for creativity and innovation (Filipczak, 1997). Thus, they feel surrounded by an atmosphere of responsibility by the favorable performance of the organization development, grounded by multidisciplinary teams that provide a feeling of support to members (Dougherty, 2004).
Communication: Organizational culture that presents clear communication, based on trust, has a positive influence on the creativity and innovation development (Barret, 1997). Feeling confident and emotionally safe in the organization, the employee is able to diverge at some points, allowing that new possibilities are conceived in a creative and innovative way. This occurs when the stakeholders are confident, enabling open communication (Martins & Terblanche, 2003).
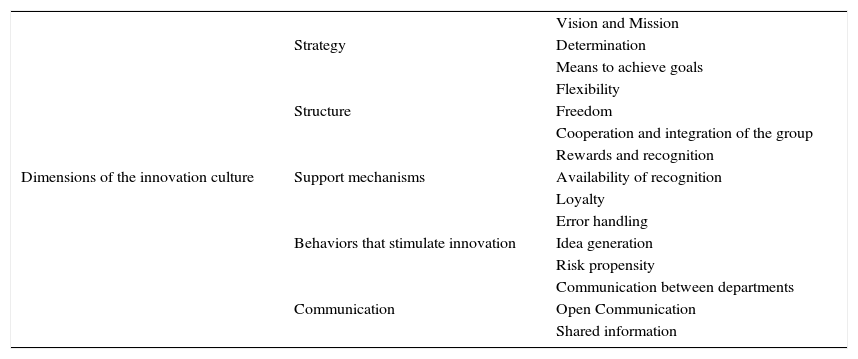
As Schein (1993), the creation of communication routines between different groups or hierarchical levels suppresses bureaucratic procedures, since individuals make up a common thought process, and start to get used to the difficulties and goals of the company as a whole. Employees act creatively and innovatively when they feel emotionally safe. Thus, they should be able to trust each other, which, in turn, it is offered by open communication (Filipczak, 1997; Frohman & Pascarella, 1990). Table 1 shows the variables of the innovation culture.
Variables of the innovation culture analyzed in the study.
| Dimensions of the innovation culture | Strategy | Vision and Mission |
| Determination | ||
| Means to achieve goals | ||
| Structure | Flexibility | |
| Freedom | ||
| Cooperation and integration of the group | ||
| Support mechanisms | Rewards and recognition | |
| Availability of recognition | ||
| Loyalty | ||
| Behaviors that stimulate innovation | Error handling | |
| Idea generation | ||
| Risk propensity | ||
| Communication | Communication between departments | |
| Open Communication | ||
| Shared information |
The model used in this study, in order to measure the performance in product and process innovation, was divided into two dimensions. For the “Product” dimension, studies by Alegre et al. (2006) were used as a basis, which feature a performance measure scale in product innovation – where psychometric properties were studied and validated in the context of biotechnology organizations. As for the Process dimension, concepts suggested by OCDE (2005) were used.
Product and process innovations require different skills for implementation: product innovation requires appreciation of customer needs, design and production, while innovation process is linked to the application of technology to improve efficiency in the development and commercialization of the product. Product innovation tends to adapt to the process innovation, being the first more easily observed and advantageous (Damanpour & Gopalakrishnan, 2001).
OECD has a measuring scale for evaluation of innovation economic goals (OECD-Eurostat, 1997), which has the purpose to give coherent controllers for studies on innovation, providing greater consistency and comparability between studies (Alegre et al., 2006). The economic results of product innovation were collected from OECD-Eurostat (1997), which is the object of study for research on innovation (Alegre, Chiva, & Lapiedra, 2009; Bakar & Ahmad, 2010).
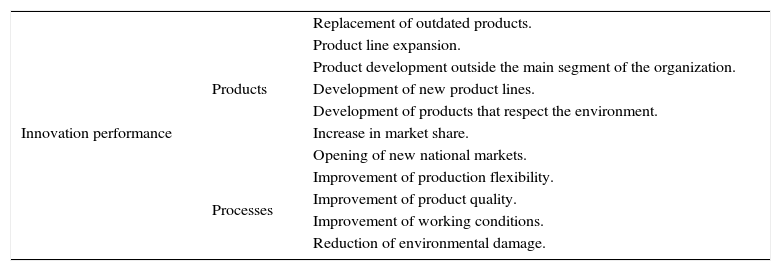
As to the Process dimension, the organization carries out improvements in the production process to achieve economic objectives in terms of products and markets. Among other objectives the following stand out: reduction of environmental damage; improvement in product quality; improvement in working conditions; and improvement of production flexibility (OCDE, 2005).
Contemplating the Process dimension, research undertaken should enable the measurement of costs and benefits of innovative activities, as well as understanding the factors that determine innovation. Innovation costs include labor cost and other current costs (OCDE, 2005). Table 2 shows the variables analyzed for performance in innovation.
Variables of performance in product and process innovation.
| Innovation performance | Products | Replacement of outdated products. |
| Product line expansion. | ||
| Product development outside the main segment of the organization. | ||
| Development of new product lines. | ||
| Development of products that respect the environment. | ||
| Increase in market share. | ||
| Opening of new national markets. | ||
| Processes | Improvement of production flexibility. | |
| Improvement of product quality. | ||
| Improvement of working conditions. | ||
| Reduction of environmental damage. |
The objectives of the organization transmit its values and can encourage or hinder innovation (Arad et al., 1997). The use of information technology is a resource for the favorable performance of innovation because it promotes the onset of creativity and innovation (Martins & Terblanche, 2003). Tolerance to error gives security to employees, and the habit of rewarding success and recognizing and celebrating the failures recalls the events, promoting discussion and learning (Tushman & O’Reilly, 1997). In this sense it was developed the first hypothesis of the study.Hypothesis 1 The innovation culture has a positive influence on performance in product and process innovation.
The innovation process refers to the modification of a routine such as changes in the operations and material exchange (Knight, 1967), and it is linked to the technology application in order to improve development efficiency (Damanpour & Gopalakrishnan, 2001), on product quality and on production flexibility (OCDE, 2005). Thus, it was developed the second hypothesis of this research.Hypothesis 2 The innovation culture has a positive influence on performance in innovation of processes.
The organization size is a factor that can interfere in the company structure and in the innovation process, in which large organizations can take advantage in the use of technologies, but can lose in bureaucracy (Damanpour, 1996). The larger the company, the greater it will also be the hierarchy and expertise (Donaldson, 1999). Smaller organizations may have better innovation performance, especially when the technological development requires flexibility in the activities and speed in decision-making (Freeman & Soete, 1997). Thus, the third hypothesis was developed.Hypothesis 3 Large organizations suffer greater innovation culture influence on performance in product and process innovation. Fig. 1 presents an overview of the hypotheses of this study.

Hypothesis H1 is designed to verify the relations of the innovation culture in product innovation performance; Hypothesis H2 refers to the investigation of the relation between the innovation culture in innovation process performance. Hypothesis H3 refers to the verification of innovation culture influence on process innovation performance when moderated by the company size.
Research methods and techniquesAs to the approach, this research is quantitative, as the objectives, descriptive and causal research was used. In addition to presenting the facts, this study aimed at understanding the relation between them, i.e., the causal relation between the innovation culture and products and processes innovation performance. As for the procedures, the research is characterized as a survey.
Profile of surveyed organizations, population and sampleThe textile and clothing sector in Brazil is recognized on the world stage for its professionalism, creativity and technology, and the size of its industrial park. It is also the second largest denim producer (raw material for manufacturing jeans) and third in knitwear production (ABIT, 2014). Vale do Itajai, in 2010, had a population of 807,961 inhabitants, divided into 39 municipalities. The most populous city was Blumenau, main city of Vale do Itajaí, with 309.011 inhabitants. In 2009, the economic activity of Vale do Itajaí, according to the composition of GDP (Gross Domestic Product), was approximately R$ 16.9 billion (sixteen billion, nine hundred million of reais), equivalent to 13% of the state GDP (IBGE, 2014). According to Costa and Rocha (2009), Vale do Itajaí is one of the leading textile centers in Latin America and the Brazilian center with greater insertion in the international market, the main exporter of knitwear and home line.
Respondents of small, medium and large companies participated in the study, making a total of eight organizations and 287 respondents. Respondent number of small and medium-sized companies was lower than that of large ones. Thus, the companies were divided into two groups: one composed by small and medium-sized companies and other formed by large ones. This division was done in order to check whether the innovation culture influence on product and process innovation performance differs in different sizes of companies.
In this study, it was adopted the classification of companies as the size according to the number of employees, according to SEBRAE criteria (2014). This study had small, medium and large businesses as participants. For the classification of companies, it is considered the branch “industry”, since this type of company is the study object of this work. The distribution of the sample is given by 123 respondents from small and medium-sized businesses and by 164 respondents from large companies.
Collection instrument and data analysis procedureThe data collection instrument consisted of two blocks, comprising a total of 37 questions. The first contains questions relating to the determinants of innovation culture and was divided into five groups: strategy, structure, support mechanisms, behaviors that encourage innovation and communication. For innovation culture, questions adapted from the theoretical model of Martins and Terblanche (2003) and questions based on studies of Nkosi and Roodt (2004) and Zdunczyk and Blenkinsopp (2007) were used. Subsequently, Gomes (2013) used the model of the aforementioned authors, applying it in the textile industry of Santa Catarina. It was used Likert scale of 7 points, ranging from 1 (“completely disagree”) to 7 (“completely agree”).
The second block includes assertions about of the process and products innovation performance, consisting of questions adapted from OECD-Eurostat (1997) and Alegre et al. (2006) studies. Likert-type scale was used, with scores ranging from 1 to 7, where 1 represented (“much worse than the competitors”), and 7 (“Much better than the competitors”). Following, the data collection process carried out in this study is described.
For data analysis it was used Structural Equation Modeling (SEM) in order to determine the causality between the constructs. The adjustment of quality indicators are used to evaluate the results from three perspectives: global adjustment, adjustment compared to a basic model and model parsimony (Hair, Babin, Money, & Samouel, 2005). For data treatment, SPSS® (Statistical Package for the Social Sciences) version 22 and AMOS® version 20 programs were used.
Multi-group analysis was used to check the influence of the innovation culture in product and process innovation performance when moderated by size. Initially the multi-group analysis is performed by comparing the model adjustment with the different groups. If all parameters are free, the analysis of the groups may be performed individually (Maroco, 2010). In the next chapter the presentation and analysis of the study results will be held.
ResultsIn this topic the research results will be presented and discussed.
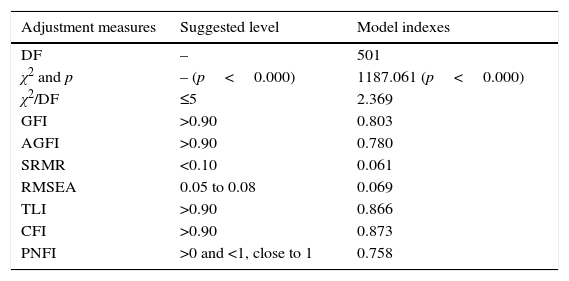
Innovation culture influence on performance in product and process innovationIn order to test hypotheses H1: “The innovation culture has a positive influence on performance in product innovation” and H2: “The innovation culture has a positive influence on performance in process innovation”; adjustment indexes of Performance models in Product Innovation and Performance in Process Innovation were analyzed. The indexes for the Innovation Culture and Performance in Product Innovation Model can be verified in Table 3.
Final model adjustment indexes Innovation Culture and Product Innovation.
| Adjustment measures | Suggested level | Model indexes |
|---|---|---|
| DF | – | 501 |
| χ2 and p | – (p<0.000) | 1187.061 (p<0.000) |
| χ2/DF | ≤5 | 2.369 |
| GFI | >0.90 | 0.803 |
| AGFI | >0.90 | 0.780 |
| SRMR | <0.10 | 0.061 |
| RMSEA | 0.05 to 0.08 | 0.069 |
| TLI | >0.90 | 0.866 |
| CFI | >0.90 | 0.873 |
| PNFI | >0 and <1, close to 1 | 0.758 |
It is noted from Table 3 that for the model Product Innovation Performance, the indexes GFI, AGFI, TLI and CFI showed different values from those recommended by the literature, being that Hair et al. (2005) suggest values higher than 0.9, and those found were 0.803, 0.780, 0.866 and 0.873, respectively. The other indexes showed significant values. In these conditions, the general model was considered acceptable. After checking the model adjustment, it was analyzed the standard factor loadings and their t-values in order to test the hypotheses, as shown in Table 4.
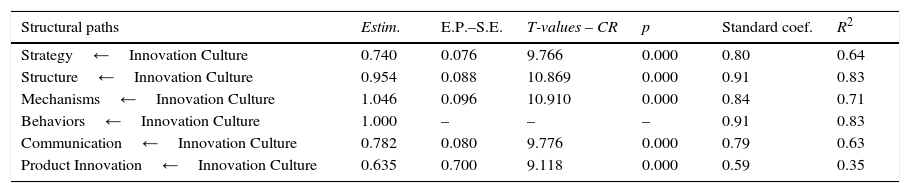
Standardized coefficients and significances of the proposed model relations.
| Structural paths | Estim. | E.P.–S.E. | T-values – CR | p | Standard coef. | R2 |
|---|---|---|---|---|---|---|
| Strategy←Innovation Culture | 0.740 | 0.076 | 9.766 | 0.000 | 0.80 | 0.64 |
| Structure←Innovation Culture | 0.954 | 0.088 | 10.869 | 0.000 | 0.91 | 0.83 |
| Mechanisms←Innovation Culture | 1.046 | 0.096 | 10.910 | 0.000 | 0.84 | 0.71 |
| Behaviors←Innovation Culture | 1.000 | – | – | – | 0.91 | 0.83 |
| Communication←Innovation Culture | 0.782 | 0.080 | 9.776 | 0.000 | 0.79 | 0.63 |
| Product Innovation←Innovation Culture | 0.635 | 0.700 | 9.118 | 0.000 | 0.59 | 0.35 |
The relation of the Innovation Culture construct with Product dimension obtained standardized coefficient of 0.59 with an R2 of 0.35 or 35%, which gives low variance explanation by the independent variables. According to Hair et al. (2005), R2 coefficient can vary from 0 to 1, and the higher is the coefficient, the higher will be the explanatory power of the regression equation. The Innovation culture can influence the performance in product innovation, because it involves creativity, work teams, open communication, trust and respect to employees, as well as speed in decision-making (Dobni, 2008).
To product dimension, the variable that suffered the greatest influence of Innovation Culture was Product 6 (“Increase in market share”) with λ=0.83, followed by Product 4 (“Development of new product lines”) with a value of 0.81, Product 2 (“Product line expansion”) with λ=0.78, and Product 1 (“replacement of outdated products”) with a value of 0.75 giving power of reasonable explanation.
Therefore, it is noted that the innovation culture in the textile sector has mainly influenced actions linked to attend and meet the changing habits and needs of consumers. The production flexibility has been a key element for competitiveness, since the sector operates with product diversity and short life cycles because of fashion trends (Rech, 2006).
The dimensions of Innovation Culture that had a greater impact on Performance in Innovation of textile Products were Structure and Behaviors which foster innovation. Thus, it is noticed a strong influence of the decision-making process formalization, flexibility of working structure, work in teams, appreciation of ideas and update knowledge on performance in product innovation.
The dimensions Structure and Behaviors that stimulate Innovation presented a standardized beta coefficient of λ=0.91. Organic structures enable more easily innovative activities than mechanistic structures (Ahmed, 1998), which can be seen with the increase in market share and the opening of new domestic markets. In addition, time flexibility, so that employees can be inspired and use of information technology are requirements for successful innovation (Shattow, 1996), and are perceived in the textile industry (Costa & Rocha, 2009).
In the sector, the use of overtime, bank hours, outsourcing and temporary work contracts are forms of flexible working (Piccinini et al., 2006). The recommendations for a flexible textile industry occur due to competitiveness, as it allows immediate response to the constant changes in the market preferences (Rech, 2006).
Regarding the behaviors that encouraged innovation, Filipczak (1997) states that the proper communication includes open dialog among all employees of the organization, for the harmony of the working group can assist in the performance of work to be done (Keller, 1986). With confidence in his/her superiors, the employee is allowed to act in a creative and innovative way, without fear of punishment (Martins & Terblanche, 2003), may submit new proposals to develop new product lines, products that respect the environment, developing secondary products (OCDE, 2005).
It is observed that the textile industry has sought to develop different strategies, using innovation to remain competitive and inserted in the world market (Costa & Rocha, 2009). Vision and mission of an innovative organization are oriented to the client and the market (Martins & Terblanche, 2003; Martins et al., 2004). It is noticed that clients have been partners of organizations, pointing their needs and wants to be supplied, as regards the product (Desouza et al., 2008). The indexes for the Innovation Culture and Process Innovation Performance Model can be verified in Table 5.
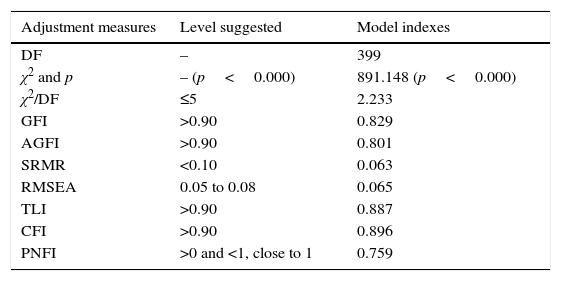
Model adjustment indexes Innovation Culture and Innovation Processes.
| Adjustment measures | Level suggested | Model indexes |
|---|---|---|
| DF | – | 399 |
| χ2 and p | – (p<0.000) | 891.148 (p<0.000) |
| χ2/DF | ≤5 | 2.233 |
| GFI | >0.90 | 0.829 |
| AGFI | >0.90 | 0.801 |
| SRMR | <0.10 | 0.063 |
| RMSEA | 0.05 to 0.08 | 0.065 |
| TLI | >0.90 | 0.887 |
| CFI | >0.90 | 0.896 |
| PNFI | >0 and <1, close to 1 | 0.759 |
It is verified through Table 5, the indexes GFI, AGFI, TLI and CFI have not reached the values recommended in the literature, but remained close to them, as follows: 0.829, 0.801, 0.887 and 0.896, respectively. The values recommended by Hair et al. (2005) are above 0.9 for these indexes. The other indicators showed significant values as indicated in the literature. Through Paths diagram, carried out with AMOS® version 20 statistical program, one can observe the influence of the innovation culture on process innovation performance. Within these conditions, the overall model was considered acceptable. After checking the model adjustment, the standardized factor loadings and their t-values in order to test the hypotheses were analyzed, as shown in Table 6.
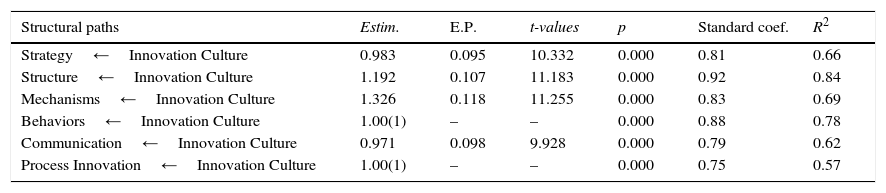
Standardized coefficients and significances of the proposed model relations.
| Structural paths | Estim. | E.P. | t-values | p | Standard coef. | R2 |
|---|---|---|---|---|---|---|
| Strategy←Innovation Culture | 0.983 | 0.095 | 10.332 | 0.000 | 0.81 | 0.66 |
| Structure←Innovation Culture | 1.192 | 0.107 | 11.183 | 0.000 | 0.92 | 0.84 |
| Mechanisms←Innovation Culture | 1.326 | 0.118 | 11.255 | 0.000 | 0.83 | 0.69 |
| Behaviors←Innovation Culture | 1.00(1) | – | – | 0.000 | 0.88 | 0.78 |
| Communication←Innovation Culture | 0.971 | 0.098 | 9.928 | 0.000 | 0.79 | 0.62 |
| Process Innovation←Innovation Culture | 1.00(1) | – | – | 0.000 | 0.75 | 0.57 |
Source: Data from the survey. (1) Initial values set out in 1.00.
The relation of the Innovation Culture construct with the Process dimension obtained standardized coefficient of 0.75, with an R2 of 0.57 or 57%, which gives reasonable explanation of variance by the independent variables, according to the literature. The culture of innovation can influence performance in process innovation since it transmits behaviors and actions that occur within the organization. Thus, it disseminates the intention of being innovative, developing structure and environment to support innovation (Dobni, 2008).
For the Process dimension, the variables that had a greater influence of the innovation culture were Process 1 (“Improvement of production flexibility”) and Process 2 (“Improvement of product quality”), both with index of 0.83, achieving power of reasonable explanation, followed by Process 3 variable (“Improvement of working conditions”) with a value of 0.80, also with reasonable explanatory power of the variance by the independent variables (Hair et al., 2005).
The Structure dimension was also that the most influenced on performance in process innovation, with a standardized coefficient of λ=0.92. Thus, it is clear that the production flexibility (Naranjo-Valencia et al., 2012), as well as freedom and teamwork are essential for innovation to be developed in the organization (Arad et al., 1997; Martins & Terblanche, 2003).
This position is also evidenced in the textile sector, as employees are qualified to develop multi tasks, making the flexible labor (Saraiva et al., 2005). Organizations that demonstrate continuous learning are prone to innovation. It also occurs with companies whose decisions are made in a participatory way, and are market oriented (Dobni, 2008). In the textile sector learning is given by the qualification and specialization of labor (Costa & Rocha, 2009).
Communication was the dimension that less influenced performance in process innovation. Although Schein (1993) states that communication routines between groups allow a high stage of creativity and Barret (1997) states that organizations with transparent communication have positive influence on the development of innovation, for the surveyed textile companies, the quality of communication between departments, workgroups and employees does not significantly influence the performance in process innovation.
Next, the analysis regarding the hypothesis H3 will be held.
Innovation culture influence on innovation performance and size of organizationsIn order to analyze hypothesis H3: Large organizations suffer greater influence of the innovation culture on performance in product and process innovation, “multi-groups analysis was performed on SEM, which evaluates a variable in at least two groups (Maroco, 2010). This analysis was used to assess the difference in results when moderated by the size of the studied organizations, or if there are changes in the regression coefficients concerning to the ratio between Product Innovation Culture→and Process Innovation→Culture, when moderated by the Size variable. For the analysis, the model with free and totally restricted parameters was estimated. The results obtained by analysis are shown in Table 7.
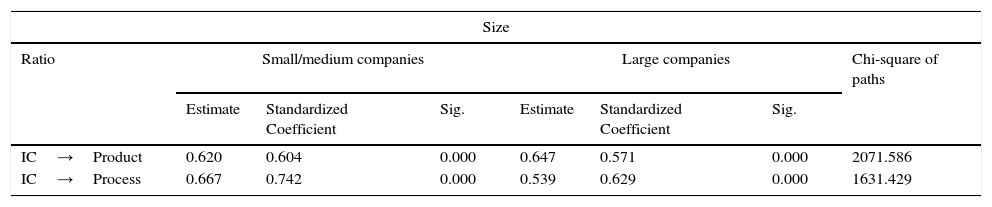
Influence moderated by the size.
| Size | |||||||
|---|---|---|---|---|---|---|---|
| Ratio | Small/medium companies | Large companies | Chi-square of paths | ||||
| Estimate | Standardized Coefficient | Sig. | Estimate | Standardized Coefficient | Sig. | ||
| IC→Product | 0.620 | 0.604 | 0.000 | 0.647 | 0.571 | 0.000 | 2071.586 |
| IC→Process | 0.667 | 0.742 | 0.000 | 0.539 | 0.629 | 0.000 | 1631.429 |
Model Product: Qui-unrestricted square df=2071.549; df=1001; Qui-restricted square=2093.614; df=1027; Δ Chi-square=22.065; Δdf=26; p-value=0.000. Chi – Path square 2074.25 to level 0.1; 2075.39 to level 0.05; 2078.18 to level 0.001.
Process Model: Unrestricted chi-square=1630.498; df=796; Restricted Chi-square=1654.074; df=825; Δ Chi-square=23.576; Δdf=29; p-value=0.000. Path Chi-square=1633.20 to level 0.1; 1634.34 to level 0.05; 1637.13 to level 0.001.
IC=Innovation Culture; DF=degrees of freedom.
The invariance of the measurement model and the structural model of the innovation culture influence on performance in product and process innovation, when moderated by Size variable, was analyzed through AMOS® program version 20. Initially, the model was adjusted individually to each group by eliminating items that did not contribute to the quality of the model adjustment.
Then, the invariance of the measurement model was evaluated in both groups compared to non-constrained model (with factor weights and variances/covariances of free factors), with a constrained model in which the factor weights and variances of the two groups were fixed. Finally, the invariance of the structural model was evaluated by comparison with model-free structural coefficients and the model with fixed structural coefficients and equal in both groups. The statistical significance of the two models difference was made with the chi-square test, as suggested by Maroco (2010).
According to Table 7, it was found that the innovation culture influence on performance in product and process innovation is not modified when moderated by the size of the studied organizations, i.e. the differences between groups were not statistically significant, which leads to infer that small and medium-sized companies can compete with large companies because they are less bureaucratic, more flexible and faster in decision making.
The results differ from what is presented by Petigrew (1979) and Damanpour (1996) as the authors comment that the size of the organization can influence its innovation process. Damanpour (1991) reported in his studies that there is a positive association between organizational size and performance in innovation, different from what was found in this study.
However, when this work is compared with Gomes (2013) studies it is noticed equal results concerning the influence of the organization size, namely, Gomes’ (2013) results were confirmed, and it was found that for the textile industry, the innovation culture influence on performance in product and process innovation do not suffer any significant variations according to the organization size. In Table 8 can be seen the results of the hypotheses built for this study.
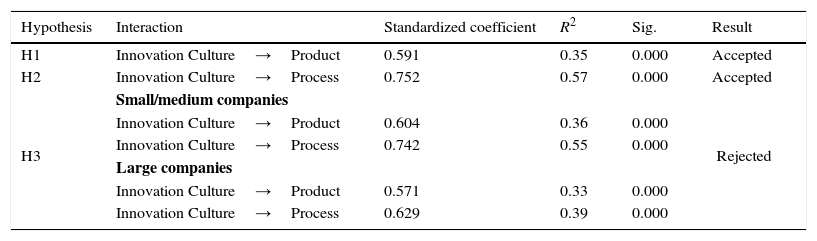
Hypotheses test.
| Hypothesis | Interaction | Standardized coefficient | R2 | Sig. | Result |
|---|---|---|---|---|---|
| H1 | Innovation Culture→Product | 0.591 | 0.35 | 0.000 | Accepted |
| H2 | Innovation Culture→Process | 0.752 | 0.57 | 0.000 | Accepted |
| H3 | Small/medium companies | Rejected | |||
| Innovation Culture→Product | 0.604 | 0.36 | 0.000 | ||
| Innovation Culture→Process | 0.742 | 0.55 | 0.000 | ||
| Large companies | |||||
| Innovation Culture→Product | 0.571 | 0.33 | 0.000 | ||
| Innovation Culture→Process | 0.629 | 0.39 | 0.000 |
In Table 8 are shown the hypotheses tests of this study with the way of interaction, the estimated standardized coefficients, the degree of explanation, the level of significance, and the result of each question. For organizations of the surveyed textile industry, it was observed that Innovation Culture influences both the performance in product innovation as processes, being higher on Process Innovation Performance. This result may be due to the search for competitiveness ahead of competition, and increased internal efficiency of the organization.
The flexibility in the activities in the textile industries, open communication, behaviors that influence innovation and creativity and professional skills lead the organization to shorten the production process and the cost of the product, influencing from the production process to the final product (Rech, 2006).
The results found in this research have converging and diverging points from those presented in the literature. The study differs from Gomes’ (2013) results as the perception of employees regarding the determinants of Innovation Culture as the most noticed element in this research was Behaviors that Encouraged Innovation, and in Gomes’ studies (2013) it was Structure.
However, as the Innovation Culture influence on Performance in Product and Process Innovation the study converges with Alegre et al. (2006), Dobni (2008) and Gomes (2013) works, in which the process innovation performance suffered higher influence. Regarding the influence of the organization size in innovation results, these are different from Damanpour's (1991) and are similar to Gomes's (2013) ones.
As found, innovation in Vale do Itajaí textile sector is internally, considering encouragement employee participation in both routine work as the generation of new ideas, as well as updating their knowledge. It also notes that, in the textile sector, the Innovation Culture has more influence on the Process dimension, i.e., actions relating to production flexibility, product quality, working conditions and reduction of environmental damage.
In face of the above, it was found that the model is suitable for this type of study. The method and the procedures adopted are consistent and can support the hypothesis testing. However, it is not intended through this study to generalize the results.
Final considerationsThis article aimed at analyzing the influence of the innovation culture on performance in product and process innovation in the textile industry of Vale do Itajaí – SC. For that, first, it was found the presence of innovation culture determinants in the studied organizations, and then the innovation culture influence on performance in product and process innovation.
It was found that there is the presence of innovation culture determinants in the studied companies, and Behaviors that Encourage Innovation with greater insight. Thus, it was noted that the surveyed textile organizations have flexible and open culture, and that encourages creativity and innovation in the workplace. Structure dimension was the second most perceived, being possible to conclude that flexible working arrangements, commitment, teamwork and multi-functional groups are practices in the textile sector. Support mechanisms have also been noticed by employees, given that rewards, recognition and access to information are actions taken by the sector.
It was found that there is an innovation culture influence on performance in product innovation. This influence can occur due to creativity, work teams, open communication, respect for employees, as well as rapid decision-making, which are characteristics of both the culture of innovation as in the textile sector. Indicators of the Product dimension that suffered most influence of innovation culture has been the increase in market share and the development of new product lines, which leads to conclude that the sector has sought to innovate and meet the needs of the increasingly eager for news market.
It was found that there is an innovation culture influence on performance in process innovation, being higher than the innovation culture influence on performance in product innovation. This influence may be due to the transmission of behaviors and actions that occur within the organization, which disseminates the intention of being innovative, developing structure and environment to support innovation. The indicators of Process dimension which were heavily affected by innovation culture were improvement of production flexibility and improvement of product quality, stating that the production flexibility and the search for quality are essential for innovation should be developed within the organization. The indicators that have less influence were improvement of working conditions and reducing the harm to the environment, which leads to the conclusion that the characteristics of innovation culture as flexibility, vision and mission statement, training and communication among others, are not reflected significantly on these indicators.
It was found that the organization size does not influence the results of innovation for the studied sample. According Pettigrew (1979) and Damanpour (1991, 1996), the organization size can bring advantages or disadvantages regarding innovation, but this was not confirmed in this study. It can be deduced that small and medium-sized companies can compete with large companies because they are less bureaucratic, more flexible and faster in decision making.
Through the reported results, the objective is to contribute to the academic field, so they have more studies on the subject and so one can make comparisons between types of companies. The research may also be useful to professionals in the administration and in the textile sector, so that they can relate the results of this study with their organization, and for audit purposes, in order to evaluate the company.
Though it has scientific and methodological rigor, the study has limitations. The first limitation is due to the fact that the studied population has been selected by accessibility and convenience. The surveyed companies are not of the same branch, but all belong to the textile chain. The number of organizations and the subjects chosen by managers to respond to the survey can be limiting factors, since they may not be the most suitable to represent the companies.
As suggestions for further work, it is proposed replication in another type of industry or region of Brazil, in order to be able to make comparisons between them, as well as conducting a qualitative study on the subject, to be developed with managers of organizations. It is also recommended the study of the impact of organizational culture on creativity.
Conflicts of interestThe authors declare no conflicts of interest.
Peer Review under the responsibility of Departamento de Administração, Faculdade de Economia, Administração e Contabilidade da Universidade de São Paulo – FEA/USP.