


The purpose of this paper is to explore the differences between what the theory shows about the importance of the environment in the innovation and what can be found in its results of empirical research. The environment, although very important, is treated as a whole, not allowing the possible environmental configurations, which have different characteristics, to be identified. The general approach to the environment on innovation, particularly in the selection of innovation indicators, causes a gap between theory and practice. Through research reports and secondary data and bibliometric analysis it is observed that the selection of innovation indicators is not aligned to the environmental context, which may cause deviations in measurement. The literature review on innovation and environment and an analysis of empirical approach studies, especially secondary and bibliometric data were explored in this study. By examining the differences between theory and practice of research, it is concluded that there are no studies relating the selection of innovation indicators for the environment and that the generic approach results have no reliability. As a contribution, it is presented a model that allows one to analyze the environment in choosing the most appropriate indicators to measure innovation in order to reduce the identified differences.
The purpose of this paper is to present the differences between what the theory shows about the importance of the environment in the innovation and what is found in results of empirical research. The difference between theory and practice seems to fall on the incomplete treatment of the environment, which is treated as a whole, and not as a set of interacting variables. The conformation of the environmental variables, with specific features, provides different environments with their own configurations. From evidences found in the literature, it appears that this is not considered in the study of the relationship between environment and innovation, particularly in the selection of innovation indicators. This distance causes a gap between theory and practice of research, because there is no interconnection between these two poles.
Thus, it is proposed to study the environmental configuration as a way to relate the environment and its characteristics to innovation and its indicators. Several studies emphasize the need to adapt the innovation process to the environment. However, the analysis of empirical approach studies, mainly secondary and bibliometrics data, shows that environmental characteristics discussed in this article as environmental context are disregarded, especially in dealing with indicators to measure innovation.
Little is known about how to promote innovation and what variables should be explored to stimulate it (Machado, 2007). The interaction of innovation with the environmental context needs to be known. Although the environmental influence on innovation is widely quoted, it is considered superficially because its main variables – economic, educational, political, socio-cultural, technological and legal (Moysés, Kestelman, Beecker, & Torres, 2010; Myburgh, 2004; Organisation for Economic Co-operation and Development [OECD], 2005; Sawyerr, 1993; Zhang, Majid, & Foo, 2011) – do not have their specificities considered in the context of analysis, despite evidence of the impact on the results of innovation. In the literature on innovation, several environmental nuances, such as complexity, uncertainty, instability and volatility (Tidd, 2001; Zhang et al., 2011) are highlighted as important for establishing organizational strategy, but the practice of research does not show that.
The environment, treated by their specificities, may characterize a particular organizational context and indicates which variables behave better in the measurement of innovation. The proposal of interaction between environment and innovation through the study of environmental settings is presented as a possible solution to reduce the gap between theory and practice research.
In several studies it was observed that the interaction between environmental context and innovation is little explored due to lack of knowledge of the environmental variables, especially regarding to the use of innovation indicators in particular environmental context. Based on this finding and considering the possible environmental settings, it is proposed a model that allows one to analyze the measurement of innovation considering the environment format and the appropriate indicators to it.
Environment and innovationThere is strong evidence of the positive relationship between environment and innovation (Tsuja & Marinõ, 2013). The literature abounds in pointing out situations that show this association, but characterizing, measuring and explaining the interrelationship of those factors is an arduous task (Tidd, 2001). Many organizations have failed in their business by the difficulty in responding quickly and appropriately to environmental changes (Zhang et al., 2011), it is observed that there is a strong relationship between its variables and the organizational innovation (Damanpour, 1996) and the dimensions of the environment, its complexity and uncertainties affects forcefully the magnitude and nature of innovation (Tidd, 2001).
Environmental contextWith the systems theory (Bertalanffy, 1968) the environment started to have greater relevance for organizations, because the concept of open system involves intense exchange of energy between the environment and the organization in order to fight entropy. However, it was with the contingency theory (Burns & Stalker, 1961; Chandler, 1962; Emery & Trist, 1965; Lawrence & Lorsch, 1967) that the environment started to play a critical role in the organizations’ surviving strategy. The Organizational actions started depending on how the environment presented itself in order to be planned and fulfilled.
Objectively, environment is everything outside of a system, referring to the various social and physical factors that impact the organizational decision-making and that are outside of the organization's boundaries (McGee & Sawyerr, 2003). It is emphasized that in the relationship between the organization and its environment, the environmental uncertainty is elementary, which has been broadly studied in the various theories about organizations (Buchko, 1994).
The environment can also be defined as a set of external factors, characterized by its uncertainty and complexity, which can change and cause reflections in the organization (Tsuja & Marinõ, 2013). Another environmental property is the dynamics, represented by the speed and frequency of changes of the environmental variables in a certain period of time (Duncan, 1972; Robbins & Coulter, 2005). Thus, uncertainty, complexity and dynamics are shown as the main features of the organizational environment.
There is no doubt that the environment affects dynamic and strategy of organizations (Damanpour, 1996; Tidd, 2001), and understanding the external environment is a fundamental condition for the organizational survival (Moysés et al., 2010). In order to understand the interrelation between organization and environment, the principles of entropy and dynamic homeostasis must be retaken. Entropy, which is understood as the importation of energy to fight the trend of de-structuring the system, leads the organization to seek in the environment, the basic resources needed for it to operate (survive), providing their product to the environment as a result. This exchange of energy provides the balance needed to preserve the organization, which is the dynamic homeostasis. Thus, as supplies are limited and the environment is uncertain, complex and dynamic, organizational strategies must be carefully planned and performed in accordance with the environmental characteristics in order to achieve homeostasis, ensuring negative entropy as a consequence.
With the goal to better understand the environment, some authors (Daft & Weick, 1984; Hambrick, 1982; Zhang et al., 2011) present as a solution the environment scanning, which can provide the necessary information to their actions. In this sense, the environment may be considered under two specific dimensions that impact at the uncertainty. One of them refers to the amount of factors contained in the environment, which can be simple or complex. The other, refers to the degree of volatility of the changing factors that can characterize the environment as static or dynamic (Duncan, 1972).
Besides the dimensions of quantity of environmental factors and degree of volatility of environmental factors, should also be assessed the proximity of the relationship between the organization and the environmental variables. Some authors (Zhang et al., 2011) classify the environment in two categories: (a) microenvironment: environment of tasks or domain; and (b) the macro environment: remote environment. The first type of environment is meaningful, has short and medium term, it has a direct impact on the tasks and results of the organization and also includes consumers, suppliers, competitors and other stakeholders. The other category, not less important, has an indirect and long-term impact and includes political, economic, social, cultural, technological and legal variables (Moysés et al., 2010; Myburgh, 2004; OECD, 2005; Sawyerr, 1993; Zhang et al., 2011). These segmentations are also called general external environment and sectorial external environment, respectively (Moysés et al., 2010). These environments are characterized in Fig. 1.

To Tsuja and Marinõ (2013), the environment is an inducer of innovation, for being a constant changing process, it induces the organization to constantly adapt, presenting itself as the main element in the innovation process. Some authors have developed the approach of the configurations to deepen the knowledge on the influence of the environment over the organizations (Mintzberg, Ahlstrand, & Lampel, 1998). These authors said that organizations are not effective by the presence of a factor or specific attribute, but, instead, by the interaction of several factors that complement each other.
This approach considers that some attributes can self-align and interact, complementing each other in order to provide the organization a determined structure (so called configuration) that allows it to face moments of instability and transformation (Miller, 1987; Miller & Friesen, 1984). Thus, according to the conditions found, the organization is able to shape and structure itself to adapt to environmental conformation.
Thus, the component parts of a system, called subsystems, can be elevated to a category of own systems to meet a particular need. Accordingly, the various subsystems of the organization may be treated as a peculiar system for a specific analysis. Furthermore, innovation, addressed distinctly, can evolve from an organization subsystem to its own system, which is called innovation system or innovative system. The systemic approach to innovation enables to emphasize the interaction of the parts that make up the innovation process (OECD, 2005). However, for an understanding of the innovation system, its component parts should be characterized and the environment that surrounds it must be analyzed, described and known.
Innovation characterizationInnovation is a phenomenon as old as humanity itself. There is a tendency in human beings to think on something new and seek the ways to meet their goals (Fagerberg, 2004). Thus, innovation can be defined as achieving success when exploring new ideas (Adams, Bessant, & Phelps, 2006), but this activity appears to be complicated and diffuse (Anthony, Johnson, Sinfield, & Altman, 2008), particularly in the organizational environment, where the term has received different names, which raises some misconceptions.
For Schumpeter (1939) innovation is a function based on creative thinking and action, where products and consumer habits are replaced by new ones; it is everything that differentiates and creates value in a business. In the Frascati Manual (OECD, 2002) innovation is treated as the marketing of successful form of products, services, processes, methods and systems that did not exist previously or that has received any new and specific function different from what prevailed until then. The new was emphasized and the improvements were not considered. It was adopted the linear view of innovation, dedicated exclusively to research and development (R&D).
With the Oslo Manual (OECD, 2005) the concept of innovation has been expanded, being treated as the implementation of a new or significantly improved product (good or service), a process, a new marketing method, or the implementation of a new organizational method either in business practices, in the organization of the workplace or even in the external relations. It migrated from the linear view of innovation to the systemic view.
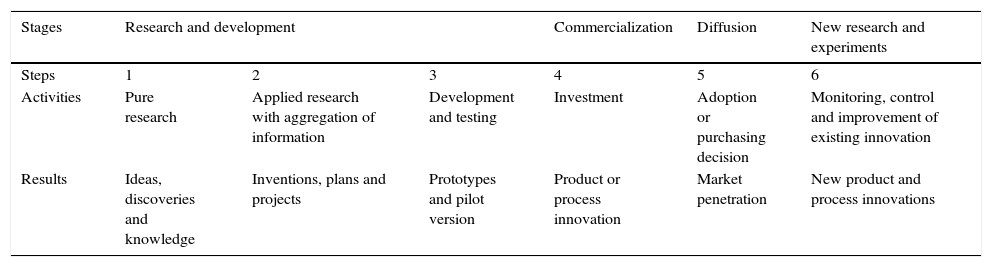
In relation to the context, innovation has different characteristics on an enterprise level, region or nation, being influenced by contextual factors directly related, such as: (a) human resources (Cassiolato & Lastres, 2000), (b) markets (Barney, 1991; Porter, 2008), (c) institutional conditions (Porter, 1998; Schumpeter, 1939) and (d) political and economic aspects (Silva, Silva, & Motta, 2012). These factors are included in the environmental variables and influence the activities and results of the various phases and stages of the innovation process. These are summarized in Table 1.
Stages, phases, activities and results of the innovation process.
| Stages | Research and development | Commercialization | Diffusion | New research and experiments | ||
|---|---|---|---|---|---|---|
| Steps | 1 | 2 | 3 | 4 | 5 | 6 |
| Activities | Pure research | Applied research with aggregation of information | Development and testing | Investment | Adoption or purchasing decision | Monitoring, control and improvement of existing innovation |
| Results | Ideas, discoveries and knowledge | Inventions, plans and projects | Prototypes and pilot version | Product or process innovation | Market penetration | New product and process innovations |
Greenhalgh and Rogers (2010) presented five steps of the innovation process that are inserted in three stages. However, it is emphasized that this process is dynamic and the improvement of a new product or process is a basic need for the company to keep ahead of the competitors, because innovation does not arrive at the industry in its perfect form (Tigre, 2006).
As for the dimension of innovation, its analyzed is based on the level of innovation that will be inserted in the market. To every radical innovation, understood as the creation of a product or procedure totally new, without any characteristic related to the previous one (Gallouj & Weinstein, 1997), there are cycles of subsequent improvements (Schumpeter, 1939). Thus, in the model proposed by Greenhalgh and Rogers (2010) it was included the stage “new research and experiments” and the step “six” which has the monitoring activity, control and improvement of the existing innovation. As a result, it has subsequent innovations of product and process, distinguished as incremental innovations, which are known as innovations risen from improvements made over an existing innovation by changing, replacing or adding of parts or other features (Gallouj & Weinstein, 1997).
Also with respect to the dimension, several innovative typologies are observed (Chandy & Prabhu, 2011), being classical and consolidated, the radical and incremental classification proposed by Schumpeter (1939). It is noteworthy that the classification of innovation is basically linked to product innovation, because there is great difficulty in analyzing innovation related to providing services. This is mainly due to two factors: (a) the theory of innovation has been developed based on technological innovation of the manufacturing process; and (b) it is difficult to measure the specificities of service innovation with traditional methods (Gallouj & Weinstein, 1997).
Regarding to the provision of services, Gallouj and Weinstein (1997) list six types of innovation: (a) radical innovation; (b) incremental innovation – already defined; (c) improvement of innovation – which is the result of improvement of an existing product or procedure, but without changing its structure; without replacing or adding features; (d) ad hoc innovation – from the interactive construction (social) of a solution to a specific problem posed by a particular customer – important way of innovation on advisory services; (e) recombinative innovation – which comes from the combination of several existing expertise, derived from a stock of thought confined to a technological base; and (f) formalization innovation – where neither quantitative or qualitative aspects of a product or procedure are changed, but the visibility or degree of standardization of its various features – highlights the correspondence between the technical and service characteristics of a product or procedure.
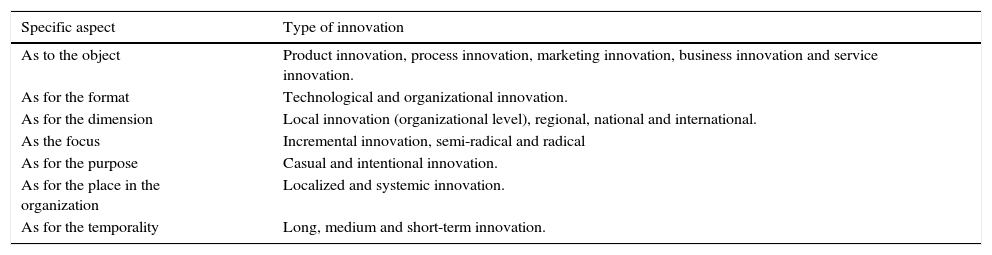
Despite the overuse of the names in different classifications, generally, the innovation types can be grouped considering some specific aspects such as the types in Table 2.
Innovation typology.
| Specific aspect | Type of innovation |
|---|---|
| As to the object | Product innovation, process innovation, marketing innovation, business innovation and service innovation. |
| As for the format | Technological and organizational innovation. |
| As for the dimension | Local innovation (organizational level), regional, national and international. |
| As the focus | Incremental innovation, semi-radical and radical |
| As for the purpose | Casual and intentional innovation. |
| As for the place in the organization | Localized and systemic innovation. |
| As for the temporality | Long, medium and short-term innovation. |
To compare two dimensions, these need to be represented in common base, that is, they need to be characterized in measurable and comparable indicators; in other words, that they might be measured by the same rule.
Indicator is a statistic data, statistically validated, used to measure something intangible (Ashton & Klavans, 1997), allowing to measure comparable results. The problem lies on the definition, classification and measurement indicators (Freeman & Soete, 2007). In order to measure innovation, factors and indicators that are validated to ensure reliability to measurement should be identified.
However, measuring phenomena has been a major challenge for researchers, because the indicators to be used are not always known, likewise if the reliability of the information obtained is reliable, especially those that are not in the public domain. Companies can hide or manipulate information, whether for fear of a secret report to competitors, or not to reveal any heterodox practice regarding to the legality (Nelson, Earle, Howard-Grenville, Haack, & Young, 2014).
In literature review, Edison, Ali, and Torkar (2013) identified 232 metrics to measure innovation. It was only found statistical validity in 85 of them and only twelve has been mentioned in the literature as commonly used in the market. These are linked to: expenditure on R&D; sales income; number of patents; personal allocated in R&D; scientific publications; number of innovation projects; innovation capacity; market share; management skills; purchase of machinery and equipment; information management; and the number of new customers. These authors also highlighted that organizations do not measure or wrongly measure innovation due to the absence of metrics and appropriate indicators. Moreover, they even claim that the diversity of innovation definitions provides little consensus on how innovation should be measured.
For Adams et al. (2006), the difficulty on measuring innovation is linked to the common errors related to the construction of measuring instruments, such as the measurement gap, which is divided into: (a) validity gap where there is no proof that the metric used really measures what you want to measure; and (b) omission gap where verified aspects related to innovation are observed, but there are no metrics to measure them. To Anthony et al. (2008), the most common errors are: using a small set of metrics, focusing on the measurement of low-risk activities and focusing more on the input factors than on the output ones and process activities.
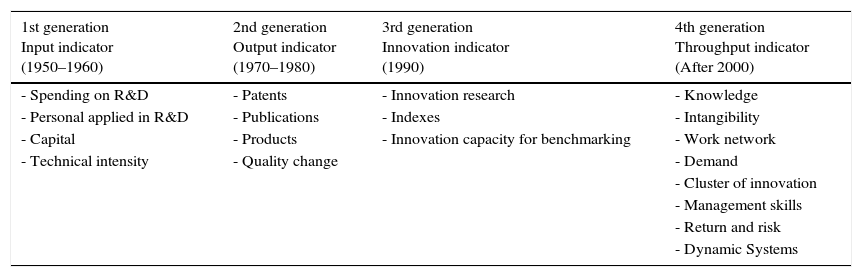
Reviewing the literature, Milberg and Vonorta (2005) identified several indicators of innovation and synthesized them into four groups of generations of indicators (Table 3).
Generations of innovation indicators.
| 1st generation Input indicator (1950–1960) | 2nd generation Output indicator (1970–1980) | 3rd generation Innovation indicator (1990) | 4th generation Throughput indicator (After 2000) |
|---|---|---|---|
| - Spending on R&D | - Patents | - Innovation research | - Knowledge |
| - Personal applied in R&D | - Publications | - Indexes | - Intangibility |
| - Capital | - Products | - Innovation capacity for benchmarking | - Work network |
| - Technical intensity | - Quality change | - Demand | |
| - Cluster of innovation | |||
| - Management skills | |||
| - Return and risk | |||
| - Dynamic Systems |
The fourth generation of indicators tends to use the process indicators, mainly featuring the knowledge, management skills and the capacity for analysis and management, but these are still at an embryonic stage, requiring further study (Milberg & Vonorta, 2005).
Overall, indicators that measure innovation are grouped into two groups: (1) the basic indicators – characterized as a direct measurement factor; and (2) Advanced indicators – which use combined factors to represent a dimension (OECD, 2005), characterized by compound index model. These are the most common to deal with complex variables.
Borocki, Orcik, and Cvijic (2013) indicate the need to observe which factors of innovation is wanted to measure to identify the ideal measurement system, because there is no standardized measure to meet all needs. According to these authors, the measuring system should be developed in alignment to the business strategy. As the strategy is directly linked to environmental characteristics, in order to measure the innovation, the indicators should be aligned to the environmental conformation.
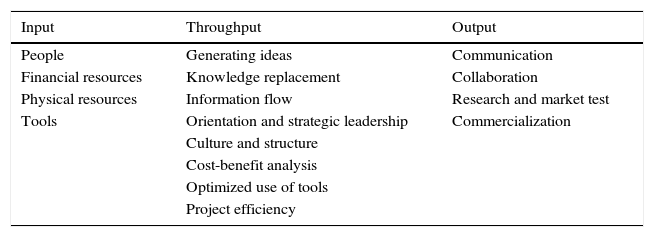
Searching the metrics of innovation, Matesco (1994) identified some indicators grouped into three basic types of measurement: (a) inputs; (b) throughput (process); and (c) output. It is observed that many of the proposals to measure innovation in organizations focuses on output measures, although there are some studies addressing input measures (Adams et al., 2006). However, very few metrics are used for process measures.
The factors used as indicators to build metrics are basically the input and output indicators; the throughput measures that are important to measure innovation (Brito, Brito, & Morganti, 2009), listed in Table 4, are relegated to the background.
Factors for construction of indicators.
| Input | Throughput | Output |
|---|---|---|
| People | Generating ideas | Communication |
| Financial resources | Knowledge replacement | Collaboration |
| Physical resources | Information flow | Research and market test |
| Tools | Orientation and strategic leadership | Commercialization |
| Culture and structure | ||
| Cost-benefit analysis | ||
| Optimized use of tools | ||
| Project efficiency |
Despite the expansion of the innovation scope, covering other factors beyond R&D, which led to the original version of the Oslo Manual (OECD, 2005), it is observed that the indicators used were still focused primarily on the ones idealized for R&D, so that the European Community (EU) have emphasized, since 1995, the need to develop a new generation of indicators to measure innovation performance, as well as its costs and benefits (OECD, 1995).
It is evident such intent has not been reached up until now. The manual of indicators and metrics innovation (Gault, 2013), bringing together nineteen recent articles on innovation indicators, does not mention new generation indicators nor addresses the importance of the environment to the innovation process. It is noteworthy that in the transition from the linear model to the various systemic models of innovation, the environment is always highlighted as a factor of fundamental importance for the innovation process. However, this concern is manifested only in the theoretical field.
The environment and the interrelationship with innovationA universal metric or a simple measure might be enough to measure some factors, but once innovation encompasses many factors related to business, markets, opportunities, working methods and ways of working (Edison et al., 2013), it makes the process of innovation measurement much more complex and difficult.
Innovation is elementary to boost productivity and competitiveness (Gunday, Ulusoy, Kilic, & Alpkan, 2011; Porter, 1990; Santos, Vasconcelos, & De Luca, 2013) and the intrinsic relationship between these complex events took various organisms (Jaramillo, Lugones, & Salazar, 2001; OECD, 2002, 2005; PINTEC, 2016) to try to standardize definitions, terms, activities and indicators in order to better understand this imbricated process, but in every attempt, the environmental context was treated theoretical and superficially, without characterization of its influence on the use of the indicators.
The best theoretical realization of the need to consider the environment in order to address the innovation system materializes in the elaboration the Bogotá Manual (Jaramillo et al., 2001). The Latin American community noted the need to adopt a set of regional indicators to best capture the specificities that characterize the technological environment of the businesses in Latin America.
The Oslo Manual (OECD, 2005), an international benchmark, addresses innovation through the subject's perspective, that is, from the perspective of the organization. However, the manual itself draws attention to the fact that not every change made to products/processes that the companies see as new or improved, are innovations. So, if the company's perspective about on innovation was wrong, the innovation measurement process can be biased, with consistent deviations.
Several studies indicate that the organizational, managerial and environmental factors are considered as elements that affect or stimulate innovation (DeTiene & Koberg, 2002), that is, which are directly related to innovation. In the perspective of the organization, organizational and managerial factors can be treated objectively, but this is not clear in the literature that addresses the practical research results. It is not noted a concern on how to insert the environmental factor in this analysis, particularly the macro-environmental factors, wherein the organization has no interference over (Moysés et al., 2010; Zhang et al., 2011).
Fagerberg (2004) states that while research on innovation is growing, there are few who care about the variables of context and contingencies that affect innovation, especially the technical and administrative research. Thus, the micro environmental variables and especially the macro environmental variables are presented and discussed in several studies (Moysés et al., 2010; Myburgh, 2004; OECD, 2005; Sawyerr, 1993), but it is not observed an effective practical interrelationship between these variables and the innovation and its indicators.
MethodologyIn the preparation of this article, literature searches were conducted for theoretical review on the environment, innovation and innovation indicators. It was developed a bibliometric analysis to identify and characterize the innovation indicators and secondary data analysis, characterized as analysis of data, which were previously collected and tabulated by other sources (Bhattacherjee, 2012), with the goal to characterize the gap between innovation and the environmental context.
The research sources used were the EBSCO database host and the periodicals portal of Higher Education Personnel Improvement Coordination (Coordenação de Aperfeiçoamento de Pessoal de Nível Superior [CAPES]). In the EBSCO platform it was used the Boolean operator to link the searching terms: “innovation AND measure*”. The asterisk added to the end of word “measure” aimed to cover all the terms with that radical, for example, measurement. 135 articles were found. To debug the information drawn from this database and to select the relevant items for the study some filters were introduced. Initially, the “AB Summary” was chosen to only show available the summaries of articles addressing indicators that focus on innovation and innovation metrics. Considering the amount of publications it was considered the period between 2000 and 2015 as relevant to analysis, especially considering the fact that research on innovation in Brazil effectively started in 2000 (PINTEC, 2002).
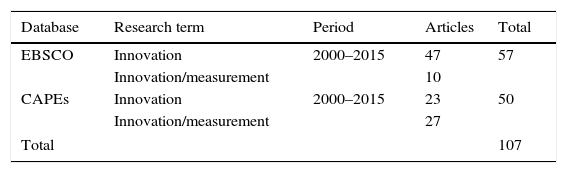
After applying filters to the selection of items of interest, the sample added up to 57 articles. The same procedure was performed in CAPES platform, after removing the items already listed in EBSCO. 176 articles were found; 50 remaining after filtering; the results are shown in Table 5.
Total articles by database and by research term.
| Database | Research term | Period | Articles | Total |
|---|---|---|---|---|
| EBSCO | Innovation | 2000–2015 | 47 | 57 |
| Innovation/measurement | 10 | |||
| CAPEs | Innovation | 2000–2015 | 23 | 50 |
| Innovation/measurement | 27 | |||
| Total | 107 | |||
The secondary data analyzed in this article was collected in the research reports on innovation called PINTEC (2016), published by the Brazilian Institute of Geography and Statistics – IBGE. It was sought to identify the innovation indicators used in empirical research, with special attention to the PINTEC research, as well as if there is any relationship between these indicators and the results of theoretical research, which show the importance of the environment. It also sought to verify whether the environment was a criterion to select the factors used to identify the environmental variables used to measure innovation.
ResultsIn the literature it was not found innovation specific models to companies or environments, but generic models, covering different situations. Several studies point to the importance of the environment in creating and fostering innovation. However, this studies address the environment in shape macro, showing features as instability, dynamism, complexity, volatility and uncertainty, but not relating them to the specific variables that make up the environment, such as economic, educational, political, socio-cultural, technological and legal ones.
Presentation and discussion of resultsObjectively, the environmental characteristics of each variable can make with each one of them to assume extremely different dimensions. The assumption of a volatile economic environment is diametrically opposed to a stable environment. The same applies to other environmental variables. If the environment is the result of interacting and interdependent variables, the form that these variables assumes have direct impact on build of environment and on behavior of a given indicator. Depending on the environment some indicators may show a better performance than others.
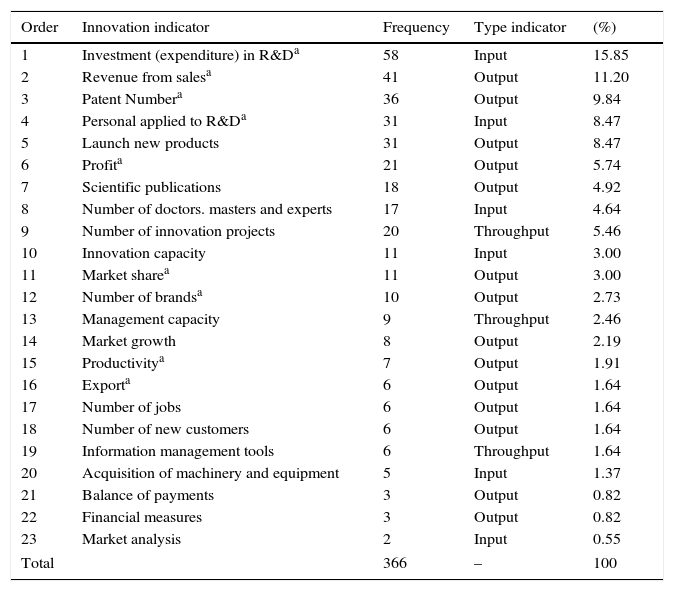
The bibliometric analysis identified the main innovation indicators used in research. Because the list is long, the indicators used by more than one author were selected. It was verified 23 innovation indicators, which received a total of 366 citations. Of these, nine are used indistinctly to measure both innovation and competitiveness, showing the interrelationship between these phenomena. The indicators are shown in Table 6.
Frequency of innovation indicators.
| Order | Innovation indicator | Frequency | Type indicator | (%) |
|---|---|---|---|---|
| 1 | Investment (expenditure) in R&Da | 58 | Input | 15.85 |
| 2 | Revenue from salesa | 41 | Output | 11.20 |
| 3 | Patent Numbera | 36 | Output | 9.84 |
| 4 | Personal applied to R&Da | 31 | Input | 8.47 |
| 5 | Launch new products | 31 | Output | 8.47 |
| 6 | Profita | 21 | Output | 5.74 |
| 7 | Scientific publications | 18 | Output | 4.92 |
| 8 | Number of doctors. masters and experts | 17 | Input | 4.64 |
| 9 | Number of innovation projects | 20 | Throughput | 5.46 |
| 10 | Innovation capacity | 11 | Input | 3.00 |
| 11 | Market sharea | 11 | Output | 3.00 |
| 12 | Number of brandsa | 10 | Output | 2.73 |
| 13 | Management capacity | 9 | Throughput | 2.46 |
| 14 | Market growth | 8 | Output | 2.19 |
| 15 | Productivitya | 7 | Output | 1.91 |
| 16 | Exporta | 6 | Output | 1.64 |
| 17 | Number of jobs | 6 | Output | 1.64 |
| 18 | Number of new customers | 6 | Output | 1.64 |
| 19 | Information management tools | 6 | Throughput | 1.64 |
| 20 | Acquisition of machinery and equipment | 5 | Input | 1.37 |
| 21 | Balance of payments | 3 | Output | 0.82 |
| 22 | Financial measures | 3 | Output | 0.82 |
| 23 | Market analysis | 2 | Input | 0.55 |
| Total | 366 | – | 100 | |
The selection of indicators did not take into account the environment, but it was used the indicators commonly available used to treat innovation. After listing the indicators, they were classified in order to characterize in the recent literature which types of indicators are associated to the input, process and output of the innovation system. For this, it was used the cataloging described in Table 4. The classification of indicators related to input, throughput and output and its percentage, respectively, are in the column “type of indicator” and percentage (%) Table 6.
The result shows that the innovation indicators most commonly used in research are not related to the input metrics (33.88%), contrary to what he said Anthony et al. (2008), but with the output metrics (56.56%), according to Adams et al. (2006). It is noteworthy that the process indicators are relegated to the background, they are pointed in only 9.56% of survey findings, confirming what they said Brito et al. (2009). This is because the process indicators are more complex and requires a model for composite index that is combining a set of indicators to represent a dimension (Milberg & Vonorta, 2005).
Output indicators are more linked to the environmental factors, but studies relating them are not observed. There are several ways of environmental variables to conform, providing environment of different configurations that are reflected directly on the innovation approach. The macro-environmental variables show up more uncertain and complex because they are farther away of organization and because do not receive any intervention of it. Because of this, the macro-environment variables have greater power of impact (Zhang et al., 2011). They stand out as predominant in the macro-environment the economic, educational, social and political variables (OECD, 2005; Moysés et al., 2010; Zhang et al., 2011). The technological and legal variables are inserted in the educational and politics variables respectively.
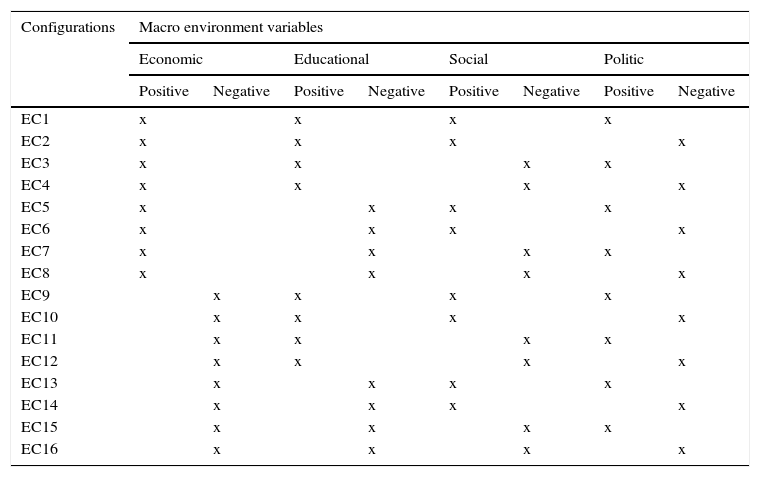
Thus, in the environmental configuration, assuming two extreme possibilities for each macro environmental variable, one positive and one negative (e.g. economic variable: developed or stagnant; educational variable: advanced or exceeded), it has 16 environmental configurations (EC≥24=16; four variables with two possibilities each), ranging from an extremely positive setting (++++) to the other extremely negative (----). If there are different configurations, and each of them causes different impacts in the innovation, each configuration requires more appropriate indicators to their context to measure innovation, once there is no standardized measure (Borocki et al., 2013). The possible configurations are shown in Table 7.
Environmental configuration possibilities.
| Configurations | Macro environment variables | |||||||
|---|---|---|---|---|---|---|---|---|
| Economic | Educational | Social | Politic | |||||
| Positive | Negative | Positive | Negative | Positive | Negative | Positive | Negative | |
| EC1 | x | x | x | x | ||||
| EC2 | x | x | x | x | ||||
| EC3 | x | x | x | x | ||||
| EC4 | x | x | x | x | ||||
| EC5 | x | x | x | x | ||||
| EC6 | x | x | x | x | ||||
| EC7 | x | x | x | x | ||||
| EC8 | x | x | x | x | ||||
| EC9 | x | x | x | x | ||||
| EC10 | x | x | x | x | ||||
| EC11 | x | x | x | x | ||||
| EC12 | x | x | x | x | ||||
| EC13 | x | x | x | x | ||||
| EC14 | x | x | x | x | ||||
| EC15 | x | x | x | x | ||||
| EC16 | x | x | x | x | ||||
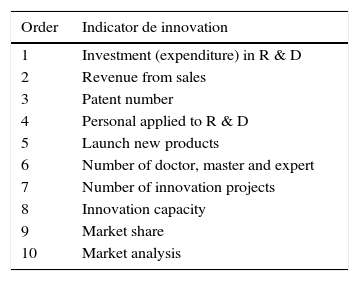
However, such care is not observed in practice. In several surveys of PINTEC innovation (2016), for example, 10 out of 23 indicators listed (Table 6), were used to compose the metric for innovation measurement in Brazil and in the Federative Units, despite considerable variability in the economic, educational, social and political context of Brazilian states. The indicators are used in Table 8.
Innovation indicators used by PINTEC.
| Order | Indicator de innovation |
|---|---|
| 1 | Investment (expenditure) in R & D |
| 2 | Revenue from sales |
| 3 | Patent number |
| 4 | Personal applied to R & D |
| 5 | Launch new products |
| 6 | Number of doctor, master and expert |
| 7 | Number of innovation projects |
| 8 | Innovation capacity |
| 9 | Market share |
| 10 | Market analysis |
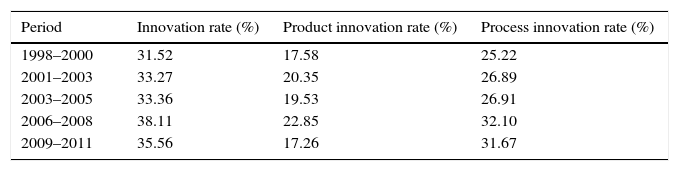
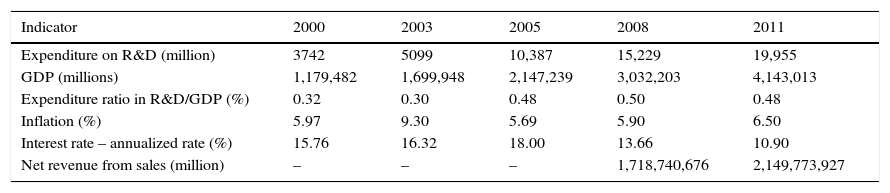
Another important factor is related to the use of the same indicators for research in different times and in different geographical regions. Indicators used as “innovation rate” and “expenditure on R&D,” for example, may suffer consequences from the economic moment experienced by the company during the research. Paradoxes can be evidenced by analyzing the data already published by PINTEC, which address the indicators “innovation rate” and “expenditure on R&D,” and several other indicators, as shown in Tables 9 and 10, respectively.
Innovation rate in the industry.
| Period | Innovation rate (%) | Product innovation rate (%) | Process innovation rate (%) |
|---|---|---|---|
| 1998–2000 | 31.52 | 17.58 | 25.22 |
| 2001–2003 | 33.27 | 20.35 | 26.89 |
| 2003–2005 | 33.36 | 19.53 | 26.91 |
| 2006–2008 | 38.11 | 22.85 | 32.10 |
| 2009–2011 | 35.56 | 17.26 | 31.67 |
Economic Indicators and Innovation in Brazil.
| Indicator | 2000 | 2003 | 2005 | 2008 | 2011 |
|---|---|---|---|---|---|
| Expenditure on R&D (million) | 3742 | 5099 | 10,387 | 15,229 | 19,955 |
| GDP (millions) | 1,179,482 | 1,699,948 | 2,147,239 | 3,032,203 | 4,143,013 |
| Expenditure ratio in R&D/GDP (%) | 0.32 | 0.30 | 0.48 | 0.50 | 0.48 |
| Inflation (%) | 5.97 | 9.30 | 5.69 | 5.90 | 6.50 |
| Interest rate – annualized rate (%) | 15.76 | 16.32 | 18.00 | 13.66 | 10.90 |
| Net revenue from sales (million) | – | – | – | 1,718,740,676 | 2,149,773,927 |
It is observed that despite the turbulent economic conditions in the periods considered, with high and low interest rates and inflation (economic variables), which impacts the availability of cash and credit for organizations, expenditure on R&D has been increasing (Table 10), which can be a paradox. One possible explanation could be linked to the fact that an increase in the rate of innovation leads to greater competitiveness, reflecting better results and allowing increased expenditure on R&D. However, this is not maintained, because in the period 2009–2011 (Table 9) the innovation rate was reduced and the expenditure on R&D continued its upward trend.
Despite of the fact that during the period from 2003 to 2011 Brazil has presented ups and downs at its economy, the indicators used by PINTEC were practically the same. It is observed only a change in the 12th indicator in the 2006–2008 reports and the inclusion of use of biotechnology and nanotechnology in the report 2009–2011).
It is noteworthy that in the selection of innovation indicators of PINTEC research (2016) it was not observed any study correlated to the environment, although in theory it is repeated the characterization of the importance of the environmental context in the study of innovation, particularly in the approach of indicators. All the indicators used by PINTEC were extracted from the Oslo Manual (OECD, 2005), prepared based on another reality.
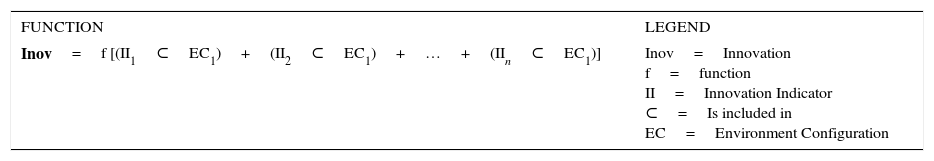
It is evident that innovation is shown as the sum of several interactions between innovation indicators and a specific configuration of specific environment of an organization. If every possible configuration requires more appropriate indicators to measure innovation, it must be known the potential environmental configuration and these indicators and thus measure more effectively, validity and reliability of the innovation phenomenon. It is presented in Table 11, a conceptual model to treat the relationship of innovation indicators and the environmental context, aiming to explore the interaction of environmental settings and innovation indicators.
Based on the literature, it can be said that the interaction of the indicators (II1, II2 … IIn) contained in a particular Environmental Configuration (EC1) will provide greater efficiency in the measurement of innovation. Thus, the proposed model can guide further research to deepen the study of the influence of environmental variables in the identification of indicators appropriate to each configuration and provide safe way to measure innovation.
Final considerationsAlthough there are models that characterize the environment as a factor of influence for innovation, there are not studies linking innovation and its indicators to the environment, particularly with environmental configuration. Regardless of the status assigned to innovation, it is emphasized the needs for studies that identify how the environmental configuration impacts the innovation indicators, in order to better understand and measure them. It should be noted that different environmental factors enable the identification of various environment configurations, which can require an appropriate measurement indicator.
In the various innovation models several indicators are presented for measurement. However, the environmental context is not considered in the choice of appropriate indicators in relation to the validity and reliability. Analyzing the indicators commonly used to measure innovation, it is observed that some, such as sales revenue, profit, management capacity and productivity, are sensitive to the environmental context, but no study explores this correlation. This reveals that the claims of the theory are different from the research practice. It follows from that finding the need for new studies considering the environment or environmental configuration in the selection of appropriate indicators to measure innovation.
Understanding the influence of the environment or environmental setting in innovation can facilitate the use of contemporary indicators (4th generation), providing more effective results with the treatment of complex variables.
Although innovation is presented as intangible variable and difficult to measure, a contextualized approach from the environmental setting, as the suggested model (Table 11) is presented as a possible solution to overcome this challenge. Thus, difficulties and uncertainties of working with indicators can be reduced ensuring greater validity and reliability in the measurement of innovation. That said, the study of innovation indicators, through environmental configuration, will find most suitable indicators to leverage the reliability of results. Identifying the possible environment configurations and relate them to the most appropriate indicators to measure innovation in each setting are suggestions for future research.
Conflicts of interestThe authors declare no conflicts of interest.
Peer Review under the responsibility of Departamento de Administração, Faculdade de Economia, Administração e Contabilidade da Universidade de São Paulo – FEA/USP.