


The objective of this article is to explore a potential diagnostic model, called “Disrupt-O-Meter”, about the Christensen's disruptive innovation theory. The diagnostic model was analyzed under multi-criteria decision aid (MCDA) methods. This diagnosis presents a typical data structure of multi-criteria ordinal problems. Different alternatives were evaluated under a set of criteria, using a scale of ordinal preferences. The steps of a MCDA problem were followed. The chosen methods were the Borda, the Condorcet and the Probabilistic Composition of Preferences (CPP). This article used a database from other research, about 3D printing technology startups. The results showed the best discrimination power by the CPP method, revealing the business category with the most disruptive potential, among other alternatives.
Business growth is an imperative of the market, prompting executives to invest in innovation projects. However, the risks of failure of new products or services represent a counterweight to the growth strategies and configure an innovation dilemma, as described by Christensen (1997). Research on the theme in different markets led that author to assert that only one out of ten companies are able to maintain sustained growth. Therefore, understanding the circumstances surrounding an innovation process can contribute to the growth strategy with new products and services which will lead companies to include it in their statistics of success.
The decision to choose an investment or prioritize a project portfolio is recurrent in the routine of managers seeking growth. Such proceedings are under pressure from different stakeholders, as well as constraints of time and resources, among other aspects that can jeopardize the rationality in search of the best choices. In this context, the option for new investments may be aided by decision support systems, in order to reduce the subjectivity of the decision-making processes, as described by Pomerol and Barba-Romero (2012).
This article explores a diagnosis of the disruptive potential of new products or services, from the point of view of the multi-criteria decision aid (MCDA) methods. Based on the disruptive innovation theory of Christensen (1997), Christensen and Raynor (2013) and Anthony, Johnson, Sinfield, and Altman (2008) developed the Disrupt-O-Meter. This diagnosis was recently applied by Hahn, Jensen, and Tanev (2014) to assess the potential of startups in the three-dimensional (3D) printing market. Their results were reassessed in this article under the MCDA theory, by the application of three ordinal methods: Borda, Condorcet and the Probabilistic Composition of Preference (CPP). The application of these ranking methods allowed a better discrimination power to identify the businesses categories with greater potential for disruptive innovation.
This article presents in Section 2 a review of the literature about the disruptive innovation theory and the three MCDA methods. Section 3 shows the methodological steps of the article. Section 4 analyses the method results applied to the startup database. Finally, Section 5 presents the final research considerations.
Literature reviewThe literature review initially addresses the main concepts involving the theory of disruptive innovation, as described in the model of Christensen and Raynor (2013). This model was transformed into criteria by Anthony et al. (2008), for assessing the disruptive innovation potential of new products and services. For practical application, the model was adapted to a diagnosis tool, called “Disrupt-O-Meter”. The evaluations of different products or services by the “Disrupt-O-Meter” criteria compose a decision matrix. Finally, the basic concepts and computation procedures of three different ordinal MCDA methods are presented in this review.
The disruptive innovation theoryThe theory of disruptive innovation describes how relatively simple, convenient and low-cost innovations can be useful to the growth of companies, even with the presence of strong competitors in the industry. According to Christensen and Raynor (2013), markets exert significant pressure on executives, in order to maintain the growth of their businesses in an increasingly rapid pace. However, the authors warn that no more than 10% of the companies are able to maintain sustained growth. The theory of disruptive innovation offers a new perspective to managers from both traditional and emerging companies to preserve the vitality of their business.
The theory was first proposed by Christensen (1997) and subsequently enlarged by Christensen and Raynor (2013). Fig. 1 describes the first model, based on two axes (i.e. time and performance). A dotted line, which increases slightly up over time, depicts a rate of improvement that customers can utilize or absorb. For instance, new cars are released with engines that are more powerful than older models; however, several factors such as traffic jams, speed limits and safety concerns limit the use of all the available performance.

The normal distribution at the end of the dotted line simplifies the chart, avoiding a figure with many parallel lines, indicating a range of performance that customers can utilize. Indeed, Christensen and Raynor (2013) state that the dotted line represents the technology that is “good enough” to serve customer's needs. The region above the line shows the distribution band of high-demanding, sophisticated customers with product performance, while the region below the line shows the band of less-demanding customers, satisfied with a basic product performance.
Two solid lines in Fig. 1 represent new and improved products. These lines indicate the pace of technological progress. The solid lines are steeper than the dotted line, showing that the technological progress usually outstrips the ability of customers to use all new product features, in any given tier of the market.
These two solid lines also distinguish sustaining from disruptive innovation. A sustaining innovation targets high-demanding customers with better performance than the previous one. Incremental improvements, breakthrough technologies, leapfrog-beyond-the-competition products are some examples highlighted by Christensen and Raynor (2013). They also agree that established competitors usually engage in sustaining innovations, because this strategy involves developing better products and higher profit margins to their best customers. A disruptive innovation introduces products or services that are not as good as currently available ones. A disruptive innovation is generally simpler, more convenient and less expensive, appealing to new or less-demanding customers. This innovation redefines a new trajectory of a second solid line.
Current leaders of the industry usually focus on sustaining innovations, while entrant companies succeed in disruptive innovations. Christensen and Raynor (2013) state that the resource allocation processes are designed to support sustaining innovations. The incumbents are motivated to develop products and services up-market, leaving new or low-end markets open to new-growth businesses. Disruptive innovation may oblige the leading competitors to diversify their production lines with cheaper products or simple enough which do not justify the investment. Thus, the incoming new market does not attract the interest of these leaders to a business niche for less demanding customers who had been not met yet. For this reason, disruptive innovation is usually focused on the “low market” region.
In fact, there are two different types of disruptions, which can best be visualized by the inclusion of a third dimension to Fig. 1. The original model of disruptive innovation kept the horizontal and vertical axis, referring to performance over time. These two axes define a particular market application. Christensen and Raynor (2013) defined the first model as a value network, where customers are restricted to a plane of competition and consumption, in which firms respond profitably to the common needs of a class of customers.
The new value network in Fig. 2 includes the new axis, representing new customers and new contexts for consumption, defining a new value network. This new axis includes new customers, who lacked the money to buy or skills to use the product, or new convenient contexts in which a simpler, more portable or cheaper product can be used. Products and services belonging to the third-axis context are then called new-market disruptions. Goods focused on the least profitable and most overserved customers at the low end of the original value network are called low-end disruptions by Christensen and Raynor (2013).

Tridimensional disruptive innovation model.
The new market disruptions compete with the “nonconsumption” because the new products are offered in a more convenient context. According to Christensen and Raynor (2013), several examples are framed in this context, attracting new customers who did not use previous generations of the same products; the transistorized portable radio to an audience that does not “consumed” the specific products in home radios; personal computers in a bulky mainframe market. The Canon desktop copier also appeared as a new market innovation, making the service to non-customers more convenient, even with slower impressions and lower quality than larger machines that operated in copier centers at that time.
As these authors indicate, disruptive innovation consists of a theory, which develops into a cyclical pattern of observation, categorization, prediction and confirmation. According to Christensen, Anthony, and Roth (2013), a good theory has two components: “a robust categorization scheme based on circumstances, to act as a guide to the situations encountered by the manager” and “a causal statement […] which can be described as the result of actions which will vary from one case to another. Thus, the development of disruptive innovation theory is based on the analysis of the circumstances in which cause and effect are observed and should therefore be analyzed individually by each company. The challenge then becomes to anticipate the projects with the greatest disruptive potential to the market.
Diagnosis “ex-ante” of disruptive innovationThe discussion about the disruptive innovation model as a “post-facto” diagnosis has been addressed in the literature in different ways. For Cohan (2000), Danneels (2004) and Tellis (2006), the theory explored samples from cases which were already consolidated as market innovations, without presenting predictive features. Therefore, the model was not able to anticipate or diagnose the potential of new products and services.
Other authors have developed guides and diagnostic models with the “ex-ante” perspective as described by Anthony et al. (2008), Doering and Parayre (2000), Govindarajan and Kopalle (2006), Kaltenecker, Huesig, Hess, and Dowling (2013), Keller and Hüsig (2009), Klenner, Hüsig, and Dowling (2013), Paap and Katz (2004) and Stoiciu, Szabo, Totev, Wittmann, and Hampl (2014). The counter-arguments about the “ex-ante” ability of the disruptive innovation theory were presented in Christensen (2006).
A systematic review of the literature reveals the shortage of “ex-ante” models for the assessment of disruptive innovation potential. The natural protection to market information prevents access to evidence on different projects that lost preference for products and services effectively launched. For example, the innovative experience of Sony in the 1980s, described by Christensen and Raynor (2013), allows inferring that a high amount of ideas and prototypes should rest in the Sony archives and manager's memories. In this context, the recent application of an “ex-ante” model by Hahn et al. (2014), to evaluate the potential of new products and services within the 3D printing market, is a rarity in the literature.
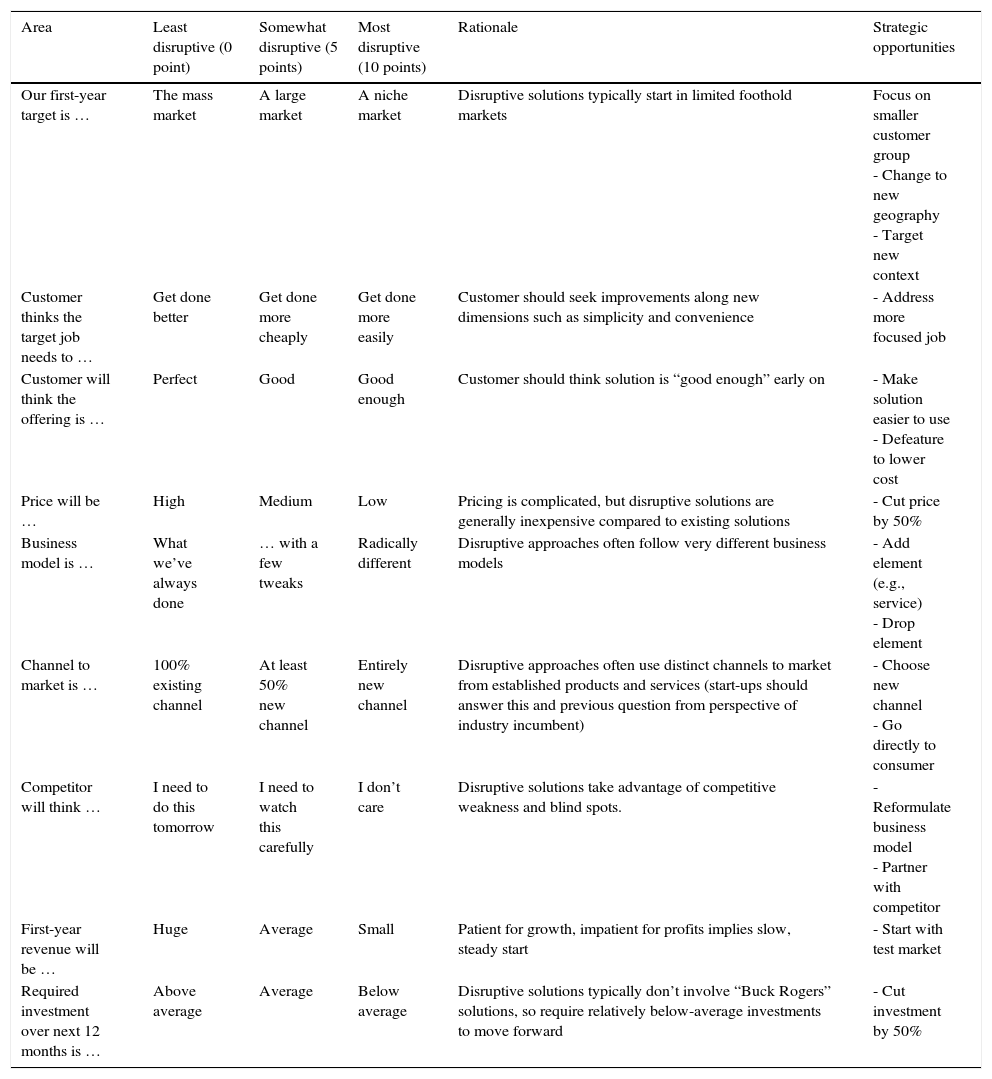
The “ex-ante” model of Anthony et al. (2008) was called Disrupt-O-Meter. This model reflects the disruptive innovation theory, in order to analyze the product or service by business areas, as described in the first column of Table 1, and three qualitative evaluation criteria based on the perception of the evaluator (i.e. least disruptive, somewhat disruptive and most disruptive). The columns “Rationale” and “Strategic Opportunities” link the areas with the constructs of Christensen and Raynor (2013).
Disrupt-O-Meter.
| Area | Least disruptive (0 point) | Somewhat disruptive (5 points) | Most disruptive (10 points) | Rationale | Strategic opportunities |
|---|---|---|---|---|---|
| Our first-year target is … | The mass market | A large market | A niche market | Disruptive solutions typically start in limited foothold markets | Focus on smaller customer group - Change to new geography - Target new context |
| Customer thinks the target job needs to … | Get done better | Get done more cheaply | Get done more easily | Customer should seek improvements along new dimensions such as simplicity and convenience | - Address more focused job |
| Customer will think the offering is … | Perfect | Good | Good enough | Customer should think solution is “good enough” early on | - Make solution easier to use - Defeature to lower cost |
| Price will be … | High | Medium | Low | Pricing is complicated, but disruptive solutions are generally inexpensive compared to existing solutions | - Cut price by 50% |
| Business model is … | What we’ve always done | … with a few tweaks | Radically different | Disruptive approaches often follow very different business models | - Add element (e.g., service) - Drop element |
| Channel to market is … | 100% existing channel | At least 50% new channel | Entirely new channel | Disruptive approaches often use distinct channels to market from established products and services (start-ups should answer this and previous question from perspective of industry incumbent) | - Choose new channel - Go directly to consumer |
| Competitor will think … | I need to do this tomorrow | I need to watch this carefully | I don’t care | Disruptive solutions take advantage of competitive weakness and blind spots. | - Reformulate business model - Partner with competitor |
| First-year revenue will be … | Huge | Average | Small | Patient for growth, impatient for profits implies slow, steady start | - Start with test market |
| Required investment over next 12 months is … | Above average | Average | Below average | Disruptive solutions typically don’t involve “Buck Rogers” solutions, so require relatively below-average investments to move forward | - Cut investment by 50% |
In general, the main aspects of the disruptive innovation theory are considered in the Disrupt-O-Meter. However, the model can be supplemented with issues raised in Teece (1993) and Dyer, Gregersen, and Christensen (2008), adding important new criteria to evaluate new products or services. These inclusions would meet the axiom of completeness, in order to integrate as many concepts in the family criteria, as described by Roy and Bouyssou (1993).
In this sense, the Disrupt-O-Meter could include additional questions, discussed by Dyer et al. (2008). These authors argue that new products or services with the disruptive potential result of creative processes of managers who challenge the status quo of the market. ‘Disruptive’ managers carry out a long time observation to create and evaluate new projects, by performing the testing of prototypes and developing broad ideas for the nascent projects. Therefore, creative thinking should have a vote in the diagnosis.
The Disrupt-O-Meter could also include other criteria described by Teece (1993). This author addressed three aspects directly related to disruptive innovations. First, the system of property rights of the new product or service. The protection of property rights against similar products or “pirates” affects new products or services. Second, if the new product or service has technological attributes that follow the dominant market standards, it is difficult to be copied by competitors. Finally, the company has complementary assets, such as competitive production, distribution, support, complementary technologies, internally or through outsourcing, necessary for success in the market. A detailed description of these possible criteria is beyond the scope of this article, but highlights that the diagnosis is open to new approaches.
Several criteria discussed by Christensen and Raynor (2013) are dichotomous questions (i.e. “yes” or “no”). The three-point scale used by Hahn et al. (2014), despite the greater discriminatory power than dichotomous scales, could also undergo improvement. Qualitative scales of five or seven points offer a better perspective assessment, expanding the range of options to expert preferences. In addition, Hahn et al. (2014) presented a database that is probably the response of a single evaluator or a consensus among evaluators. In that case, counting on the evaluations of several decision makers can provide greater variance to the data and, consequently, provide a higher quality to the probabilistic approach Hair, Black, Babin, Anderson, and Tatham (2006).
This article explores a case with startups. According to the Brazilian Service of Assistance to Micro and Small Enterprises (SEBRAE, 2016), a startup is a group of people looking for a repeatable and scalable business model, working in conditions of extreme uncertainty. The term “repeatable” means the ability to deliver the same product, in potentially unlimited scale, without a large number of customizations or adaptations for each client. The “scalable” term means the growth in revenue, but with the ability to control and reduce costs, so that the margin keeps rising up. According to Grando (2012), a startup is an innovative enterprise with the potential to grow and gain scale, a business venture for testing new ideas. In the author's words, “an entrepreneur who opens a small business presupposes innovation.”
Contributions of the MCDA approachThe growth in new markets with disruptive innovation is full of uncertainties. The anticipation of how consumers will react to new products or services is not an exact science. According to Giglierano, Vitale, and McClatchy (2011), a detailed screening of the market to detect the circumstances and the customers’ needs is not enough. For some reason, the potential customer still has the final decision to buy the new product or service. For Anthony et al. (2008), market uncertainties induce innovative exploratory approaches, in order to confirm the best strategy to launch the new product for different types of customers and through various forms of supply. In this context, intuition and market experience of senior managers become relevant in choosing the best investment projects, according to Christensen and Raynor (2013).
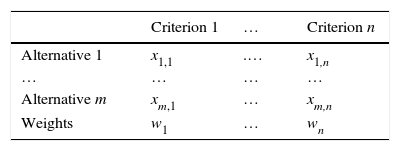
Decision making in this uncertain environment usually involves multiple criteria. The inaccurate data, as well as the different preferences of multiple managers make the choosing process more complex when it comes to the best investment projects. For Pomerol and Barba-Romero (2012), the multi-criteria analysis favors the choice of satisfactory solutions that result from a compromise between different alternatives and their performances for each evaluation criterion. This approach differs from optimization methods that exploit the concept of a “best” decision, because an alternative varies its performance across all criteria, which favors the MCDA approach. The computation steps for an MCDA problem usually start with a decision matrix, as shown in Table 2.
Decision matrix.
| Criterion 1 | … | Criterion n | |
|---|---|---|---|
| Alternative 1 | x1,1 | .… | x1,n |
| … | … | … | … |
| Alternative m | xm,1 | … | xm,n |
| Weights | w1 | … | wn |
The decision matrix of Picture 2 is generic, consisting of alternatives, criteria, evaluations of each alternative under each criterion and weights, which depend on the MCDA method. The selection of the appropriate method is usually related to the purpose of the decision maker: selection, ranking, which can also be used to selection problems, classification, and outranking (Pomerol & Barba-Romero, 2012).
Ordinal MCDA methods are solely based on the ranking of the alternatives under each criterion. They differ from cardinal utility methods because it is not necessary to evaluate the performance differences between the alternatives, but an order of preferences. Ordinal methods are more robust than cardinal ones, because cardinal utilities are very fragile due to unnoticed changes in cardinal utility by the decision maker, which may cause bias in the process, as stressed by Pomerol and Barba-Romero (2012). The classical methods of Borda and Condorcet were applied to the problem of Hahn et al. (2014), and their results were also compared with the probabilistic approach of the CPP method.
The Borda's methodThe French scientist Jean-Charles de Borda developed one of the oldest MCDA methods, dating from the late eighteenth century. The logic of this ordinal method is to add the rankings obtained by a given alternative in relation to each criterion, sum the points for all criteria and rank as first the alternative, that has the fewest points. Several sports competitions (like motor racing) apply a version of this method, when the first place receives a number of points, the second place fewer points, and so on, as highlighted by Gomes Junior and Soares de Mello (2007).
The calculation procedure is straightforward. Initially the m alternatives are ordered for each criterion. Then, the alternatives are assigned integers k, called Borda coefficients (i.e. k1>k2>k3⋯km≥0), for an alternative i in each criterion j. The evaluations aij are described as a preference chain in Eq. (1), where ≻ denotes strict preference and ≈ indifference.

The function rk, associates the Borda coefficient k1 to ai1, k2 to ai2, and so on, as long as there are only strict preferences. Eventually there may be ties (indifferences) among the rankings. In this case, Kendall (1970) suggests a procedure to discriminate the order, by using the arithmetic mean of Borda's coefficients that each tied alternative would have obtained if it had not been in a tie. In Eq. (1), the tied alternatives a3j and a4j would receive rk (a3j)=rk (a4j)=(k3+k4)/2. For instance, considering four alternatives with preferences a1j≻a2j≈a3j≻a4j, and Borda's coefficients 8>5>3>1, the ranks would be rk(a1j)=8, rk(a2j)=rk(a3j)=5+32=4 and rk(a4j)=1 (Pomerol & Barba-Romero, 2012).
Despite its simplicity, the method has some limitations. Initially, the results are very sensitive to the choice of Borda's coefficients; consecutive integer values can lead to different results than coefficients with asymmetrical ranges. This problem arises in sports competitions, whenever new regulations change the scoring systems, assigning different points to each event or even to specific events, such as doubling points in final racings or matches. This can distort the results and may jeopardize the process with dishonest manipulation (Pomerol & Barba-Romero, 2012).
Another limitation refers to disobedience to one of the axioms of Arrow (1951). This author has developed a set of five axioms to evaluate MCDA methods: universality, unanimity, completeness, transitivity and independence of irrelevant alternatives. The Borda's method does not follow the last axiom, since the elimination of any alternative with lower preference will change the coefficients of all the others and eventually results in a different ranking. For more details, Pomerol and Barba-Romero (2012) should be addressed in this issue.
The Condorcet methodThe Marquis Caritat de Condorcet is contemporary to Borda. Condorcet is the precursor of the current French School of multiple criteria. The method is based on parity relations between the alternatives. According to Oliveira et al. (2015), the Condorcet method has the advantage to avoid distortions, in that the relative position of two alternatives is independent of any other. In sports, volleyball and tennis matches are ruled by the Condorcet principles, assuming the players as alternatives and the game sets as criteria. The winner is the player who performs better in the majority of sets, no matter the difference of scores in each set, and this reflects the logic of the method.
The parity analysis, however, may compromise the transitivity axiom of Arrow (1951), which is called the “Condorcet's paradox”. In this situation, three alternatives “A”, “B” and “C” can outrank each other in a closed circuit, such as A≻B, B≻C and C≻A. In the “Condorcet's paradox”, it is not possible to order the alternatives. The graph of Fig. 3 illustrates the relationships between dominant and dominated alternatives in the “Condorcet's paradox”.

The Condorcet method is non-compensatory, because there can be no compensation for what would be lost on one criterion, as described by Bouyssou (1986). On the other hand, the Borda method is compensatory, because it aggregates scores from different criteria, and higher coefficients on one criterion may offset low performances in others. According to Pomerol and Barba-Romero (2012), the Condorcet method yields a relation satisfying the axiom of independence of irrelevant alternatives, but which is not necessarily transitive, as shown in the Condorcet's paradox.
The probabilistic composition of preferences (CPP)The CPP method is based on a probabilistic approach to ordinal MCDA problems, as proposed by Sant’Anna (2002) and later expanded in Sant’Anna (2015). The method is especially useful for the treatment of inaccurate data, assuming the uncertainty and other subjective aspects that are inevitably present in preference evaluations, which are interpreted as random variables. The method has been applied to management sciences in general, including the ranking of products, services, countries, companies, risks, documents, and others.
The CPP is based on the key idea that the measurement of attributes is seen not as a measure of definite preference, but as the location parameter of a probability distribution. Then, the observed value of the decision matrix is no longer an accurate measure, but one of an interval of possible satisfaction evaluations that may occur if the alternative is evaluated in successive assessments of the preference based on that criterion. According to Sant’Anna (2015), this approach reflects the implicit subjectivity in any selection process, as it occurs in the evaluation of startups by Hahn et al. (2014).
This procedure is called “randomization” and corresponds to the first stage of the CPP. Among the most commonly used distributions of probabilities, the normal and triangular distributions have excelled in modeling multi-criteria problems (Sant’Anna, Meza, & Ribeiro, 2014), with some applications with uniform distribution (Sant’Anna & Conde, 2011), Pareto (Sant’Anna & Soares de Mello, 2012) and, more recently, with Beta distributions (Sant’Anna, Martins, Lima, & Fonseca, 2015).
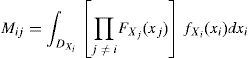
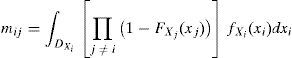
The second stage of CPP corresponds to the computation of two indices: the probability of the alternative presenting a value higher than the value of any other, for each criterion (Mij) and a value lower than the value of any other, for each criterion (mij). According to Garcia and Sant’Anna (2015), the following equations allow the computation of Mij and mij, where FXj, FXi and DXi are, respectively, the cumulative distribution function, the density function and the support of the random variable Xj, which evaluates, under the same criteria, the other alternatives except that object of the calculation.
The composition of the probabilities Mij and mij, sets the final stage of the CPP method. The alternatives can be ordered according to Mij and mij, depending on the point of view taken by the decision maker. Four types of composition are derived from the position of the decision maker on two questions: the first about a progressive-conservative view and the second about an optimism-pessimism view (Sant’Anna, 2015).
The progressive point of view reflects the idea of “biggest gain,” in which the focus of decision-making is on maximizing the probabilities of preference according to the criteria analyzed, in order to differentiate the alternatives near the frontier of best performance. The conservative point of view reflects the idea of “avoiding losses” in which the decision maker aims not to minimize such preference, differentiating the alternatives near the frontier of worst performance. In the pessimistic view, the decision maker considers the probability of maximizing (or not minimize) the probability preferences in all criteria, using the logical operator “AND” in the composition of the joint probabilities of the criteria. In the optimistic point of view, the decision maker considers satisfactory results in at least one criterion, uses the logical operator “OR” in the composition of the joint probabilities (Sant’Anna, 2015).
Summarizing the points of view, these four kinds of composition can be combined without the use of weights. The Progressive-Pessimistic (PP) point of view computes the probability of each alternative being the best according to all the criteria. The Progressive-Optimistic (PO) computes the probability of each alternative being the best according to at least one of the criteria. The Conservative-Pessimistic (CP) computes the probability of each alternative not being the worst by all the criteria. Finally, the Conservative-Optimistic (CO) computes the probability of each alternative not being the worst by at least one of the criteria. The PP point of view was considered the appropriate composition to the case study of this article (Sant’Anna, 2015).
MethodologyThe Disrupt-O-Meter was explored within the framework of an MCDA problem. Thus, it was deemed coherent to address the problem by the adaptation of a methodological procedure proposed by Pomerol and Barba-Romero (2012). The following steps comprise the method here applied, as shown in Fig. 4.

The first step refers to the analysis of the problem, in order to identify the objective that motivates the decision support. This first discussion is useful in assessing the feasibility of the options of MCDA methods that are coherent with the problem. At the end of this step, the stakeholders are supposed to be in agreement on the problem formulation, whether they want a complete ranking of alternatives, a classification, a selection, among others. In this article, the ranking of the startups solves the decision problem.
The second step refers to establishing the context of the problem. Different circumstances may indicate different solutions to address the problem. In the case of choosing new projects, analysts should consider the economic scenario, the external and internal environment, consider different stakeholders’ point of view, among other variables that best represent the context in which the company is embedded, as suggested by Christensen and Raynor (2013).
The third step involves the selection of alternatives, which in this case, correspond to the business categories identified by Hahn et al. (2014). The criteria are extracted from the Disrupt-O-Meter of Anthony et al. (2008). According to Pomerol and Barba-Romero (2012), the criteria consist of attributes of the alternatives which are regarded as priorities by the decision maker to evaluate the alternatives.
The fourth step is to get the preference evaluations from analysts, experts, managers, executives, among others, which are able to appraise each alternative under each criterion. In a context of uncertainty about the business environment that precedes the launch of a new product or service, it is reasonable to use qualitative scales that express opinions, experiences and intuitions in better condition than quantitative assessments (Moshkovich & Mechitov, 2013).
The fifth step is building the decision matrix, using the framework of Table 2, which consolidates the initial steps. In fact, the first five steps were a mere collection and reorganization of data suggested in the decision matrix of Hahn et al. (2014). The last two steps are the contribution to that original research, from a multicriteria point of view. The sixth step is the application of the MCDA methods. Three ordinal methods, the Borda, Condorcet and CPP, were applied and the results analyzed.
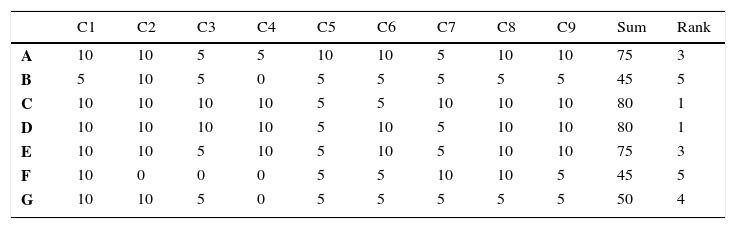
ApplicationThe research of Hahn et al. (2014) was focused on the most promising sectors of startups of 3D printing market, including companies with experience up to three years, using the framework of the disruptive innovation theory. The authors explored a population of 79 emerging companies from the database “AngelList startup platform” (https://angel.co/3d-printing). The database was limited to 2013.
The original research classified the startups in seven categories, from “A” to “G” according to the nature of the products and services, depicted in Table 3. The category “A” brings together startups that do not have printers and specialized access to an online network for 3D printing. In this sense, “B” differs from “A” as companies have printers to do the job. The category “C” specializes in product design tools and software modeling. The category “D” offers products for modeling such as scanners and special cameras. The category “E” provides 3D printers for sale. The category “F” provides online printing focusing on toys and figures. Finally, the category “G” is specialized in supporting other business, the so-called business-to-business market.
Decision matrix.
| C1 | C2 | C3 | C4 | C5 | C6 | C7 | C8 | C9 | Sum | Rank | |
|---|---|---|---|---|---|---|---|---|---|---|---|
| A | 10 | 10 | 5 | 5 | 10 | 10 | 5 | 10 | 10 | 75 | 3 |
| B | 5 | 10 | 5 | 0 | 5 | 5 | 5 | 5 | 5 | 45 | 5 |
| C | 10 | 10 | 10 | 10 | 5 | 5 | 10 | 10 | 10 | 80 | 1 |
| D | 10 | 10 | 10 | 10 | 5 | 10 | 5 | 10 | 10 | 80 | 1 |
| E | 10 | 10 | 5 | 10 | 5 | 10 | 5 | 10 | 10 | 75 | 3 |
| F | 10 | 0 | 0 | 0 | 5 | 5 | 10 | 10 | 5 | 45 | 5 |
| G | 10 | 10 | 5 | 0 | 5 | 5 | 5 | 5 | 5 | 50 | 4 |
The seven categories of startups were evaluated based on the Disrupt-O-Meter, under nine criteria. Criteria “C1” to “C9” correspond to the “Area” column of the Disrupt-O-Meter described in Table 1. The three-point scale (i.e. 0, 5 and 10 points) of the Disrupt-O-Meter was also applied to the evaluations. The points were aggregated by simple addition by Hahn et al. (2014), as depicted in column “Sum”. The final ranking is described in the column “Rank”. The results indicated classes “C” and “D” as those with the greatest disruptive potential.
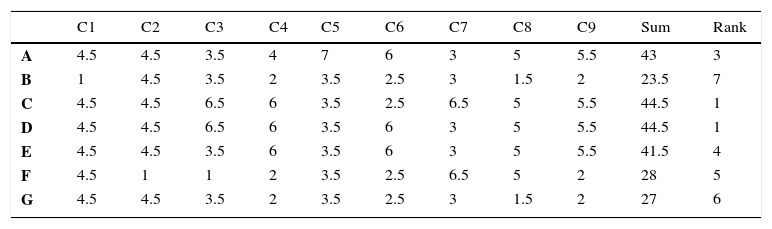
Results of the Borda's methodTable 4 shows the results of the Borda method. Canonical coefficients (i.e. integers from 1 to 7) were used based on the assumption that the alternative with the highest evaluation receives seven points and the lowest one point. These coefficients correspond to integer numbers equivalent to seven alternatives. The alternative “A” received the highest evaluation in the criterion “C5”, then the Borda coefficient of “A” is “7”.
The Borda's method.
| C1 | C2 | C3 | C4 | C5 | C6 | C7 | C8 | C9 | Sum | Rank | |
|---|---|---|---|---|---|---|---|---|---|---|---|
| A | 4.5 | 4.5 | 3.5 | 4 | 7 | 6 | 3 | 5 | 5.5 | 43 | 3 |
| B | 1 | 4.5 | 3.5 | 2 | 3.5 | 2.5 | 3 | 1.5 | 2 | 23.5 | 7 |
| C | 4.5 | 4.5 | 6.5 | 6 | 3.5 | 2.5 | 6.5 | 5 | 5.5 | 44.5 | 1 |
| D | 4.5 | 4.5 | 6.5 | 6 | 3.5 | 6 | 3 | 5 | 5.5 | 44.5 | 1 |
| E | 4.5 | 4.5 | 3.5 | 6 | 3.5 | 6 | 3 | 5 | 5.5 | 41.5 | 4 |
| F | 4.5 | 1 | 1 | 2 | 3.5 | 2.5 | 6.5 | 5 | 2 | 28 | 5 |
| G | 4.5 | 4.5 | 3.5 | 2 | 3.5 | 2.5 | 3 | 1.5 | 2 | 27 | 6 |
The ties receive weighted coefficients, as suggested by Kendall (1970). The tie coefficient is equal to the arithmetic average of the coefficients of the occupied positions, simulating different alternatives. For example, in Table 3, the alternatives “C” and “D” are tied in “C3” criterion. If they ranked differently, they would occupy the 7th and the 6th positions, which would correspond to coefficients “7” and “6”. Therefore, the new coefficient of these tied alternatives is the average “6.5” for both.
The final scores are obtained with the sum of Borda's coefficients, indicating the alternatives “C” and “D” with scores “44.5” and the highest disruptive potential among the seven categories.
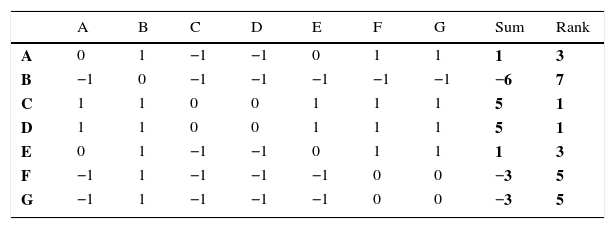
Results of the Condorcet's methodIn the Condorcet method, each pair of alternatives is analyzed separately to verify the preference relation between them. In Table 3, for instance, the binary relation between the alternatives “A” and “B” reveals that “A” has a strict preference on the criteria “C1”, “C4”, “C5”, “C6”, “C8” and “C9” and has an indifferent status on the criteria “C2”, “C3” and “C7”. Thus, the alternative “A” “beats” “B” for six criteria to zero. It is relevant to emphasize that the score differences between “A” and “B” in each criterion do not matter, like in a volleyball or tennis match.
Table 5 shows the results of the Condorcet method. The relations of preference and indifference reflect the results in the last column “Rank”: C≈D≻A≈E≻F≈G≻B. The three indifference relations are evidences of a low discriminatory power of the Condorcet method when applied to Table 3 data.
A straightforward way to compute the results of the Condorcet method is to use a matrix of binary relations, as depicted in Table 5. The main diagonal receives values “0”, due to the impossibility of an alternative being compared to itself. The binary relations “1” and “−1” refer to the preferences between the alternatives, read from the line to the column: “1” for a strict preference for the “line” over the “column” alternative and “−1” for the opposite relation. For instance, the binary relations between “D” and “E” in Table 3 indicate the preference for alternative “D”, so the cell indexed in Table 5 by the line “D” and the column “E” receives the value “1”. The sum of the lines indicates the balances of each alternative, which are ranked from the highest to the lowest balance in the last column.
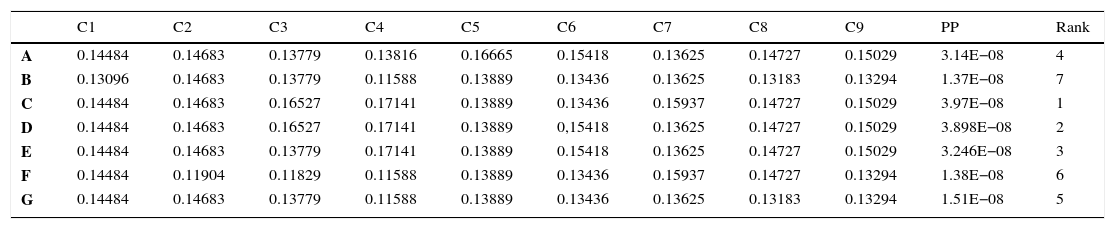
Results of the CPP methodFinally, Table 6 shows the results of the CPP method. The matrix values correspond to the joint probability Mij, calculated from Eq. (2). For example, for the criterion “C1”, category “A” has 14.48% chance of being the best preference of evaluators in relation to other categories. The column “PP” shows the results of the chosen point of view to the problem, which computes the product of all Mij for each category. The major product in column “PP” corresponds to the rank preferences in the last column. Therefore, “C” received the higher preferences. The CPP method also revealed a satisfactory discrimination between all categories, which is a special feature of the probabilistic approach.
The CPP method.
| C1 | C2 | C3 | C4 | C5 | C6 | C7 | C8 | C9 | PP | Rank | |
|---|---|---|---|---|---|---|---|---|---|---|---|
| A | 0.14484 | 0.14683 | 0.13779 | 0.13816 | 0.16665 | 0.15418 | 0.13625 | 0.14727 | 0.15029 | 3.14E−08 | 4 |
| B | 0.13096 | 0.14683 | 0.13779 | 0.11588 | 0.13889 | 0.13436 | 0.13625 | 0.13183 | 0.13294 | 1.37E−08 | 7 |
| C | 0.14484 | 0.14683 | 0.16527 | 0.17141 | 0.13889 | 0.13436 | 0.15937 | 0.14727 | 0.15029 | 3.97E−08 | 1 |
| D | 0.14484 | 0.14683 | 0.16527 | 0.17141 | 0.13889 | 0,15418 | 0.13625 | 0.14727 | 0.15029 | 3.898E−08 | 2 |
| E | 0.14484 | 0.14683 | 0.13779 | 0.17141 | 0.13889 | 0.15418 | 0.13625 | 0.14727 | 0.15029 | 3.246E−08 | 3 |
| F | 0.14484 | 0.11904 | 0.11829 | 0.11588 | 0.13889 | 0.13436 | 0.15937 | 0.14727 | 0.13294 | 1.38E−08 | 6 |
| G | 0.14484 | 0.14683 | 0.13779 | 0.11588 | 0.13889 | 0.13436 | 0.13625 | 0.13183 | 0.13294 | 1.51E−08 | 5 |
The CPP method had the highest discriminatory power of the alternatives, confirming alternative “C” as the most preferred. Given the nature of the problem and the database of the decision matrix presented by Hahn et al. (2014), it is clear that the “PP” point of view is more adherent to the context. The procedure of “randomization” used triangular distributions, considering the category preference as the mode value and normalized scores between “0” and “1”. The calculations for the PP point of view were modeled in the software “R” (R Core Team, 2016).
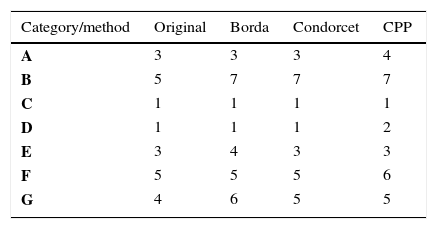
Comparison of resultsThe ordinal-scale database drove the use of ordinal MCDA methods in this article. The simple sum of scores of a three-point scale, the mathematical procedure originally used by Hahn et al. (2014), revealed tied results. The use of the CPP allowed better results, indicating the “C” category as the most disruptive potential in the 3D printing market.
The greatest potential presented by specialized startups in product design tools and 3D modeling software is shown in Table 7. For Hahn et al. (2014), the “C” category supports a complementary market since it allows customers unfamiliar with computerized aid design programs (i.e. CAD). The simplicity and convenience of features offered by the startups attract new customers and contribute to the disruptive potential of emerging companies with these business models.
At the other extreme of the ranking, the business models of “B”, “F” and “G” categories operate in the regions of sustaining innovations, in which the ability of stronger companies in the sector is present in their segments. For new entrants, to compete in these categories does not constitute an interesting strategy in the light of the theory proposed by Christensen and Raynor (2013). Large companies in this market tend to remain in their niche market, pooling their resources to eliminate, acquire or reduce threats from potential competitors. Considering the maturity cycle of fewer than three years of business experience, it is reasonable to assume that the startups will face severe difficulties in a segment of sustaining innovations and should emphasize their efforts in the realm of disruptive innovations. In the context studied, the business models of “C” category showed a better potential of success.
ConclusionThis paper aims to contribute with an MCDA methodology to the analysis of disruptive innovations in emerging companies. The diagnostic model explored, the Disrupt-O-Meter, was introduced by Anthony et al. (2008), which explored the theory of Christensen and Raynor (2013). The Disrupt-O-Meter produces a decision matrix, wherein the alternatives may be new products or services, characterized as disruptive innovations.
The original database used by Hahn et al. (2014) should be explored by other MCDA methods, in order to improve the discrimination of the results. Thus, this article presented three different ordinal methods that could improve decision support based on the Disrupt-O-Meter. The Borda's, Condorcet's and CPP methods were presented, with their theories and application to the case studied.
The results confirmed the potential of the category “C”, both in the original research as in the three ordinal methods. Although it is not a formal principle to be followed, the fact that it appears unanimously as the most preferred in the different methods enshrines this category as the one with the highest potential. This finding is relevant because the investment can focus on one business model, which implies the concentrating of resources and management attention.
Future studies can be implemented with a view to improving the criteria of the diagnostic model, such as the addition of theoretical aspects related to Teece (1993) and Dyer et al. (2008), adding relevant contributions to the model. Thus, other concepts consolidated in the market and academy can complement the “ex-ante” diagnosis of projects or services with disruptive innovation potential.
Conflicts of interestThe authors declare no conflicts of interest.
Peer Review under the responsibility of Departamento de Administração, Faculdade de Economia, Administração e Contabilidade da Universidade de São Paulo – FEA/USP.