


This study aims to evaluate the utility of shear wave elastography (SWE) in identifying synovitis in patients with a history of arthritis within the diagnosis of a defined rheumatological disease.
Materials and methodsWe performed B-mode and SWE (ultrasound) on 58 participants divided into two groups: group 1 included 29 patients with confirmed active wrist and/or hand synovitis; group 2 included 29 healthy volunteers without suspicion of synovitis. In a subset of patients (n=8), joint counts and disease evaluations were performed during the elastography to study the correlation between clinical and radiological findings.
ResultsThe mean maximum kPa value and the average joint kPa value were significantly different between cases and controls: maximum kPa value for cases was 38.14±35.08kPa, while for controls it was 4.72±5.93kPa; average joint value for cases was 29.77±26.07kPa, while for controls it was 4.17±5.22. The most frequent location for joint effusion in both, cases and controls, was the dorsal radiocarpal joint: 41.4% of controls had a mean kPa value of 7.66±5.39kPa, while 58.6% of cases had a mean kPa value of 40.61±40.76kPa (p-value 0.004). kPa values correlated with disease activity measurements in the 8 patients clinically evaluated at the moment of the SWE.
ConclusionsSWE is a promising technique that may have a role in the diagnosis and assessment of synovial inflammatory activity in arthritis.
El presente estudio pretende evaluar la utilidad de la elastosonografía por ondas de corte transversales (SWE) para la identificación de la sinovitis en pacientes con un historial de artritis dentro de un diagnóstico de una enfermedad reumatológica definida.
Materiales y métodosSe ha llevado a cabo una ecografía en modo-B y con SWE a 58 participantes divididos en dos grupos: el grupo 1 incluyó a 29 pacientes con sinovitis activa de la muñeca o la mano y el grupo 2 incluyó a 29 voluntarios con un buen estado de salud y sin sospecha de sinovitis. A un subconjunto de pacientes (n=8) se les practicó un recuento articular y unas revisiones clínicas durante la elastografía para analizar la correlación entre los hallazgos clínicos y radiológicos.
ResultadosSe han detectado diferencias significativas de la media del valor máximo de kPa y del valor medio de kPa de la articulación entre el grupo de casos y el grupo de control. El valor máximo de kPa en el grupo de casos fue de 38.14±35.08 mientras que el grupo control fue de 4.72±5.93kPa. El valor medio de kPa de la articulación en el grupo de casos fue de 29.77±26.07 kPa mientras que en el grupo control fue de 4.17±5.22. La localización más frecuente del derrame articular en ambos grupos (casos y controles) fue en la articulación radiocarpiana dorsal: 41,4% del grupo control tenían un valor medio de kPa de 7.66±5.39 mientras que el 58,6% de los casos fue de 40,61±40,76 kPa (valor p de 0,004). Los valores de kPa se correlacionaron con las mediciones en los 8 pacientes evaluados clínicamente con la SWE.
ConclusionesLa SWE es una técnica con potencial que puede ser utilizada para el diagnóstico y la evaluación de la actividad sinovial inflamatoria en pacientes con artritis.
Ultrasound (US) is an imaging technique widely used to detect signs of inflammation in patients with musculoskeletal diseases.1 Currently, the most used diagnostic imaging methods to diagnose synovitis are ultrasound (US) with the use of Power Doppler,1–12 and Magnetic Resonance Imaging (MRI), which is emerging as a potentially useful diagnostic tool in inflammatory pathologies of the musculoskeletal system.13
In 2017, the OMERACT US (Outcome Measures in Rheumatoid Arthritis Clinical Trials Ultrasound) Work Group published a combined scoring system for rheumatoid arthritis (RA), using both grey-scale (GS) and power Doppler (PD) ultrasound.14 In 2021, the European League Against Rheumatism (EULAR) presented recommendations for reporting ultrasound studies in musculoskeletal disease, which included the use of elastosonography for the first time.15
In 2017, Taljanovic et al. published a study16 that detailed the physical bases of elastography and its different types, defining its advantages and disadvantages. Quantitative measurements of tissue elasticity allow for valuable assessment of intrinsic tissue properties, which may be useful in diagnosing early disease when no abnormality can be depicted on conventional US.
In 2020, Snoj et al. published a new article17 on this technique, in which they stated that elastography is considered the most significant advance in US technology since the implementation of Doppler imaging. However, there are few articles in the reviewed literature that evaluate the importance of shear wave elastosonography (SWE) in the study of synovitis, both at the time of diagnosis and in its follow-up.18,19
The objective of this study is threefold. First, we aim to describe differences in SWE synovial stiffness values between cases and controls. Second, we analyze the performance of the technique through a series of receiver operating characteristic curves. Finally, we determine the possible pKa cut-off values to discriminate between both groups according to our results.
Materials and methodsPatient cohortBetween April 2020 and February 2021, we conducted a cross sectional study that included a group of patients with clinical suspicion of active wrist and/or hand synovitis, according to the evaluation of an expert rheumatologist (cases, n=29), and a control group of volunteers without clinical suspicion of synovitis or any personal or family history of inflammatory joint diseases (controls, n=29). All subjects underwent a complete rheumatological examination.
All patients referred to the arthritis clinic were consecutively included, as long as they accepted and signed the informed consent. Patients with non-inflammatory arthropathies, tumors, or previous hand surgery were excluded from the study.
SWE was performed on patients routinely seen in the rheumatology inpatient clinic, who had a history of arthritis within the diagnosis of a defined rheumatological disease, diagnosed according to clinical criteria established for each disease, and were suspected to have active arthritis at the time of the rheumatological evaluation, assessed by joint count and scales, such as the disease activity score-28-erythrocyte sedimentation rate (DAS28-ESR) or the systemic lupus erythematosus disease activity index (SLEDAI). Ultrasound was requested in all patients by the rheumatologist after their clinical evaluation.
In a subset of patients (n=8), joint counts and the rest of the disease evaluation were performed simultaneously with elastosonography by a blinded evaluator to study the correlation between clinical and radiological findings. In the rest of the patients, physical examinations had been performed on previous days, and the clinical situation could have changed. In this subgroup, a rheumatologist performed the physical examination and a radiologist performed the SWE, both of whom were blinded in reference to the subject’s information and allocation into one of the study groups.
The selection of this subgroup of patients (n=8) was random after establishing a certain time frame during which all patients scheduled for ultrasound within that period were examined in vivo. The healthy controls were also clinically evaluated by a rheumatologist, with no evidence of inflammatory findings found in the evaluation. All participants gave their informed consent in accordance with the declaration of Helsinki.
Imaging analysisImaging analysis was conducted using a General Electric (GE) Healthcare's LOGIQ E9 system (Wauwatosa, WI) with a high-frequency linear probe (4−15Hz) by a radiologist with a proven track record in musculoskeletal ultrasound imaging and SWE (more than 2000 baseline US examinations and more than 300 stiffness measurements of superficial soft parts). Preliminary B-mode examination was performed at T0 with axial and longitudinal scans according to EULAR guidelines14 to evaluate the presence of significant synovitis and quantify it.
The following joints were scanned on the dorsal side: radiocarpal, ulnocarpal, inter-carpal, 2nd–5th metacarpophalangeal (MCP), and 2nd–5th proximal interphalangeal (PIP) joints (22 joints per person). Elastosonography examination was obtained using the SWE module and performed with the same US device (GE Healthcare’s LOGIQ E9 system, Wauwatosa, WI) by the same operator.
We assessed the stiffness of synovitis in the areas considered as synovitis in the B mode assessment following the EULAR OMERACT guidelines using the same grading system. Grade 1: Synovial hypertrophy (SH) with or without effusion up to the level of the horizontal line connecting bone surfaces; moderate=Grade 2: SH with or without effusion extending beyond the joint line but with an upper surface convex or hypertrophy extending beyond the joint line but with an upper surface flat; severe=Grade 3: SH with or without effusion extending beyond the joint line but with an upper surface flat or convex.
When an image of an area evaluated in B mode as synovitis was obtained, an oval region of interest (RoI) with a surface of 25mm2 and 4−12mm in depth was selected. R1.0.6 elastosonographic software was used. In the control group, when an image of an area of joint synovial effusion in B mode was identified, an oval region of interest (RoI) with a surface of 25mm2 and 4−12mm in the central portion of joint synovial effusion was selected.
The elastograms were only considered representative and valid if they fulfilled the following quality criteria as previously described in the literature and in liver disease studies1: more than two-thirds of the elastosonographic map had to be homogeneously colored or have a gradual color transition2; artifacts (spots, pixelation, and lack of a signal) had to occupy less than one-third of the elastosonographic map; and3 no sharp transition from soft (blue) to hard (red) elastosonographic areas was permitted.
As synovial fluid can vary in terms of extension and stiffness, multiple measurements were taken along its surface to detect any intrasynovial differences. For each synovitis, three samples were collected from different regions of the examined synovial fluid, and the average “absolute” stiffness value was calculated using the Young’s modulus of elasticity (kPa) that was automatically processed by the ultrasound software.
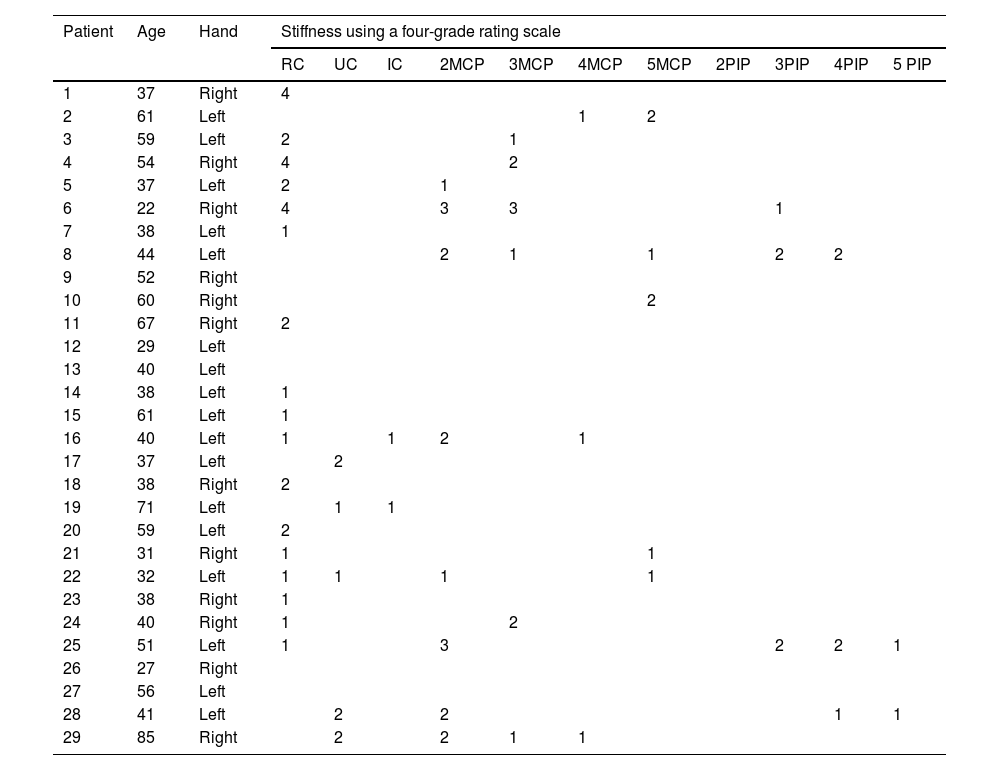
The elastosonographic analysis was performed on each patient, and the radiologist classified each synovitis using a four-grade rating scale based on the stiffness of the synovial fluid measured by SWE. The four grades were as follows: grade 1 (0−30kPa), grade 2 (30−60kPa), grade 3 (60−90kPa), and grade 4 (90−120kPa) (please refer to Table 1).
Anatomical localization and stiffness (using a four-grade rating scale depending on the synovial fluid stiffness measured by SWE) of joint fluid detected by shear wave elastosonography in the patient group suspected of active synovitis.
| Patient | Age | Hand | Stiffness using a four-grade rating scale | ||||||||||
|---|---|---|---|---|---|---|---|---|---|---|---|---|---|
| RC | UC | IC | 2MCP | 3MCP | 4MCP | 5MCP | 2PIP | 3PIP | 4PIP | 5 PIP | |||
| 1 | 37 | Right | 4 | ||||||||||
| 2 | 61 | Left | 1 | 2 | |||||||||
| 3 | 59 | Left | 2 | 1 | |||||||||
| 4 | 54 | Right | 4 | 2 | |||||||||
| 5 | 37 | Left | 2 | 1 | |||||||||
| 6 | 22 | Right | 4 | 3 | 3 | 1 | |||||||
| 7 | 38 | Left | 1 | ||||||||||
| 8 | 44 | Left | 2 | 1 | 1 | 2 | 2 | ||||||
| 9 | 52 | Right | |||||||||||
| 10 | 60 | Right | 2 | ||||||||||
| 11 | 67 | Right | 2 | ||||||||||
| 12 | 29 | Left | |||||||||||
| 13 | 40 | Left | |||||||||||
| 14 | 38 | Left | 1 | ||||||||||
| 15 | 61 | Left | 1 | ||||||||||
| 16 | 40 | Left | 1 | 1 | 2 | 1 | |||||||
| 17 | 37 | Left | 2 | ||||||||||
| 18 | 38 | Right | 2 | ||||||||||
| 19 | 71 | Left | 1 | 1 | |||||||||
| 20 | 59 | Left | 2 | ||||||||||
| 21 | 31 | Right | 1 | 1 | |||||||||
| 22 | 32 | Left | 1 | 1 | 1 | 1 | |||||||
| 23 | 38 | Right | 1 | ||||||||||
| 24 | 40 | Right | 1 | 2 | |||||||||
| 25 | 51 | Left | 1 | 3 | 2 | 2 | 1 | ||||||
| 26 | 27 | Right | |||||||||||
| 27 | 56 | Left | |||||||||||
| 28 | 41 | Left | 2 | 2 | 1 | 1 | |||||||
| 29 | 85 | Right | 2 | 2 | 1 | 1 | |||||||
RC (dorsal radiocarpal joint); UC (dorsal ulnocarpal joint); IC (dorsal intercarpal joint); MCP (dorsal metacarpophalangeal joint); PIP (dorsal proximal interphalangeal joint).
Quantitative variables were described using mean and standard deviation, while qualitative variables were described using frequencies. A bivariate analysis was performed after checking for normality of continuous variables using the Shapiro–Wilk test. As our variables fulfilled the normality assumption, we performed a two-tailed independent samples Student’s t-test to compare quantitative variables between groups. Pearson’s correlation coefficient was used to correlate kPa values with disease activity markers. A p-value<0.05 was considered statistically significant. Receiver Operating Characteristic (ROC) curves were used to analyze the performance of the technique. We performed all statistical analyses using IBM® SPSS 25.0.
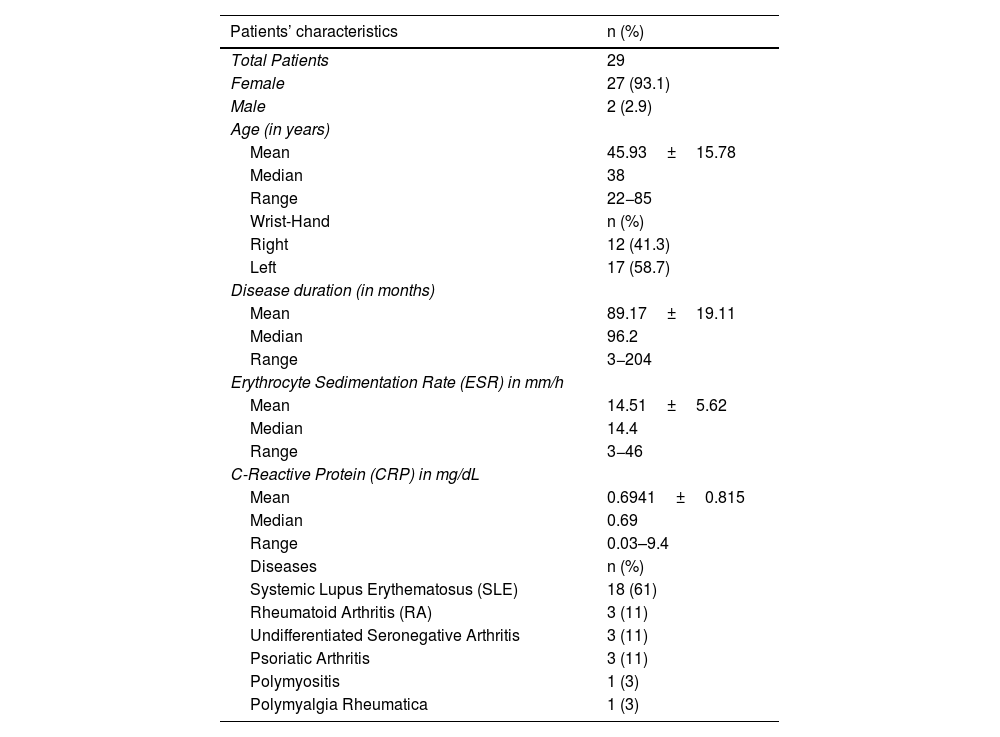
ResultsWe evaluated 29 cases and controls. The mean age of cases was 45.93±15.78 years, while the mean age of controls was 41.93±17.67 years. Of the cases, 93.1% were female, while 82.7% of controls were female. We found no differences in these baseline characteristics between cases and controls.
Among the cases, the baseline inflammatory disease was 61% systemic lupus erythematosus (SLE), 11% rheumatoid arthritis (RA), 11% undifferentiated seronegative arthritis, 11% psoriatic arthritis, 3% polymyositis, and 3% polymyalgia rheumatica. All patients were diagnosed according to the appropriate set of classificatory criteria for their baseline disease. Table 2 shows the characteristics of the patients and the healthy control group.
Characteristics of patients and of the control group.
| Patients’ characteristics | n (%) |
|---|---|
| Total Patients | 29 |
| Female | 27 (93.1) |
| Male | 2 (2.9) |
| Age (in years) | |
| Mean | 45.93±15.78 |
| Median | 38 |
| Range | 22−85 |
| Wrist-Hand | n (%) |
| Right | 12 (41.3) |
| Left | 17 (58.7) |
| Disease duration (in months) | |
| Mean | 89.17±19.11 |
| Median | 96.2 |
| Range | 3−204 |
| Erythrocyte Sedimentation Rate (ESR) in mm/h | |
| Mean | 14.51±5.62 |
| Median | 14.4 |
| Range | 3−46 |
| C-Reactive Protein (CRP) in mg/dL | |
| Mean | 0.6941±0.815 |
| Median | 0.69 |
| Range | 0.03–9.4 |
| Diseases | n (%) |
| Systemic Lupus Erythematosus (SLE) | 18 (61) |
| Rheumatoid Arthritis (RA) | 3 (11) |
| Undifferentiated Seronegative Arthritis | 3 (11) |
| Psoriatic Arthritis | 3 (11) |
| Polymyositis | 1 (3) |
| Polymyalgia Rheumatica | 1 (3) |
| Control group characteristics | n (%) |
|---|---|
| Total Patients | 29 |
| Female | 25 (86.2) |
| Male | 4 (13.7) |
| Age (in years) | |
| Mean | 41.93±17.67 |
| Median | 41 |
| Range | 21−71 |
| Wrist-Hand | n (%) |
| Right | 14 (48.2) |
| Left | 15 (51.8) |
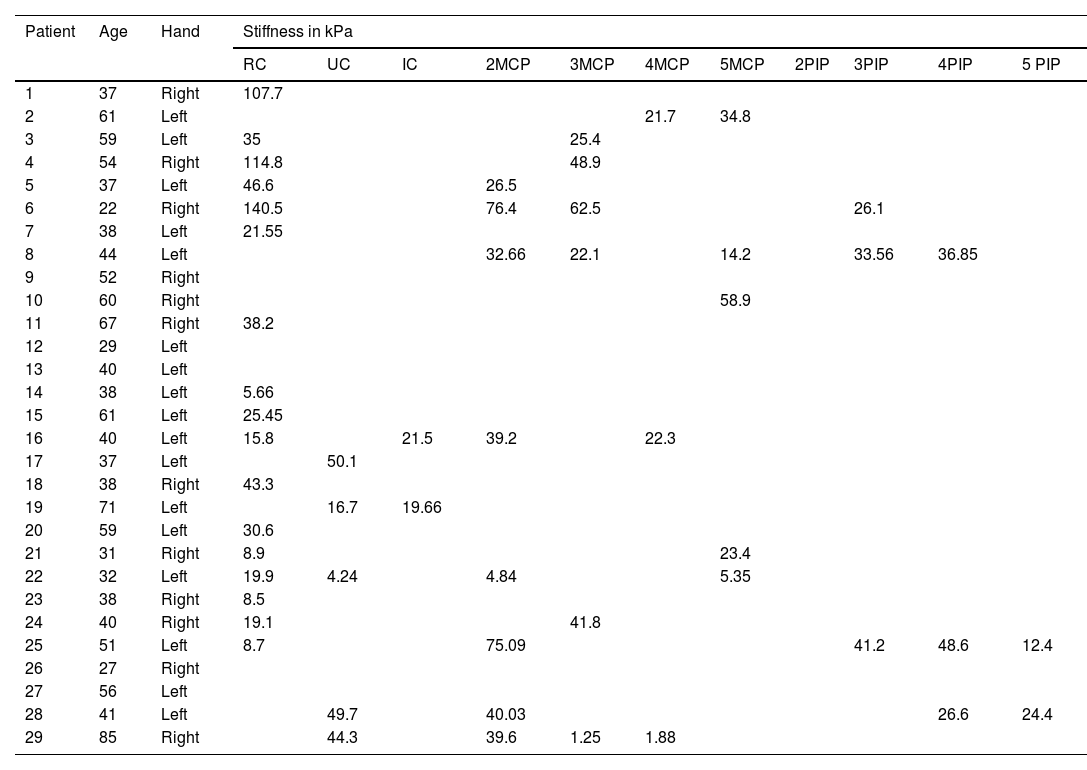
The mean maximum kPa value, the median kPa value and the average joint kPa value showed statistically significant differences between cases and controls. The maximum kPa value for cases was 38.14±35.08kPa and for controls was 4.72±5.93kPa (p-value 0.000). Similarly, the average joint value for cases was 29.77±26.07kPa and for controls was 4.17±5.22kPa (p-value 0.000). The median kPa value was 28.25±25.84 for cases and 3.2±5.2kPa for controls (p-value 0.000). The dorsal radiocarpal joint was the most frequently affected joint by synovitis in both, cases and controls, with a frequency of 41.4% in controls and 58.6% in cases. The mean kPa value for this joint was 7.66±5.39kPa in controls and 40.61±40.76kPa in cases, showing a significant difference (p-value 0.004) (see Table 3).
Anatomical localization and stiffness (expressed in kPa) of joint fluid detected by Shear Wave elastosonography in the patient group suspected of active synovitis.
| Patient | Age | Hand | Stiffness in kPa | ||||||||||
|---|---|---|---|---|---|---|---|---|---|---|---|---|---|
| RC | UC | IC | 2MCP | 3MCP | 4MCP | 5MCP | 2PIP | 3PIP | 4PIP | 5 PIP | |||
| 1 | 37 | Right | 107.7 | ||||||||||
| 2 | 61 | Left | 21.7 | 34.8 | |||||||||
| 3 | 59 | Left | 35 | 25.4 | |||||||||
| 4 | 54 | Right | 114.8 | 48.9 | |||||||||
| 5 | 37 | Left | 46.6 | 26.5 | |||||||||
| 6 | 22 | Right | 140.5 | 76.4 | 62.5 | 26.1 | |||||||
| 7 | 38 | Left | 21.55 | ||||||||||
| 8 | 44 | Left | 32.66 | 22.1 | 14.2 | 33.56 | 36.85 | ||||||
| 9 | 52 | Right | |||||||||||
| 10 | 60 | Right | 58.9 | ||||||||||
| 11 | 67 | Right | 38.2 | ||||||||||
| 12 | 29 | Left | |||||||||||
| 13 | 40 | Left | |||||||||||
| 14 | 38 | Left | 5.66 | ||||||||||
| 15 | 61 | Left | 25.45 | ||||||||||
| 16 | 40 | Left | 15.8 | 21.5 | 39.2 | 22.3 | |||||||
| 17 | 37 | Left | 50.1 | ||||||||||
| 18 | 38 | Right | 43.3 | ||||||||||
| 19 | 71 | Left | 16.7 | 19.66 | |||||||||
| 20 | 59 | Left | 30.6 | ||||||||||
| 21 | 31 | Right | 8.9 | 23.4 | |||||||||
| 22 | 32 | Left | 19.9 | 4.24 | 4.84 | 5.35 | |||||||
| 23 | 38 | Right | 8.5 | ||||||||||
| 24 | 40 | Right | 19.1 | 41.8 | |||||||||
| 25 | 51 | Left | 8.7 | 75.09 | 41.2 | 48.6 | 12.4 | ||||||
| 26 | 27 | Right | |||||||||||
| 27 | 56 | Left | |||||||||||
| 28 | 41 | Left | 49.7 | 40.03 | 26.6 | 24.4 | |||||||
| 29 | 85 | Right | 44.3 | 39.6 | 1.25 | 1.88 | |||||||
RC (dorsal radiocarpal joint); UC (dorsal ulnocarpal joint); IC (dorsal intercarpal joint); MCP (dorsal metacarpophalangeal joint); PIP (dorsal proximal interphalangeal joint).
In relation to the other joints, a statistically significant difference in kPa values between cases and controls was only observed in the ulnocarpal joint (p-value 0.024). Figs. 1–9 display the procedural methods used, as well as examples of different SWE findings (Tables 4 and 5).

Pearson correlation coefficient between de higher kPa values observed by elastosonography in each patient and different activity measurements. TJC: tender joint count; SJC: swollen joint count; VAS: visual analogue scale; CRP: C-reactive protein; ESR: erythrocyte sedimentation rate. Bold p-values=statistically significant. Underlined pvalues=marginally significant.
 curve that shows an area under the curve of 0.829 at discriminating between cases and controls depending on the maximum kPa values.")
 curve that shows an area under the curve of 0.834 at discriminating between cases and controls depending on median kPa values.")
 curve that shows an area under the curve of 0.841 at discriminating between cases and controls depending on mean kPa values.")
 analysis image of dorsal ulnocarpal joint of the wrist in sagittal plane, with the measurement of all quantitative stiffness values and the related average stiffness value, of a 37-year-old female patient who had a history of psoriatic arthritis and suspected to have active arthritis in the rheumatological clinical evaluation.")
Shear wave elastosonography (SWE) analysis image of dorsal ulnocarpal joint of the wrist in sagittal plane, with the measurement of all quantitative stiffness values and the related average stiffness value, of a 37-year-old female patient who had a history of psoriatic arthritis and suspected to have active arthritis in the rheumatological clinical evaluation.
 analysis image of third metacarpophalangeal in sagittal plane, with the measurement of all quantitative stiffness values and the related average stiffness value, of a 59-year-old female patient who had a history of SLE and suspected to have active arthritis in the rheumatological clinical evaluation.")
Shear wave elastosonography (SWE) analysis image of third metacarpophalangeal in sagittal plane, with the measurement of all quantitative stiffness values and the related average stiffness value, of a 59-year-old female patient who had a history of SLE and suspected to have active arthritis in the rheumatological clinical evaluation.
 analysis image of dorsal radiocarpal joint of the wrist in sagittal plane, with the measurement of all quantitative stiffness values and the related average stiffness value of a 38-year-old female patient who had a history of seronegative arthritis and suspected to have active arthritis in rheumatological clinical evaluation.")
Shear wave elastosonography (SWE) analysis image of dorsal radiocarpal joint of the wrist in sagittal plane, with the measurement of all quantitative stiffness values and the related average stiffness value of a 38-year-old female patient who had a history of seronegative arthritis and suspected to have active arthritis in rheumatological clinical evaluation.
 analysis image of dorsal radiocarpal joint of the wrist in sagittal plane, with the measurement of all quantitative stiffness values and the related average stiffness value of a 34-year-old healthy female healthy volunteer.")
 ultrasound exploration with probe localized in sagittal position at the level of dorsal radiocarpal joint.")
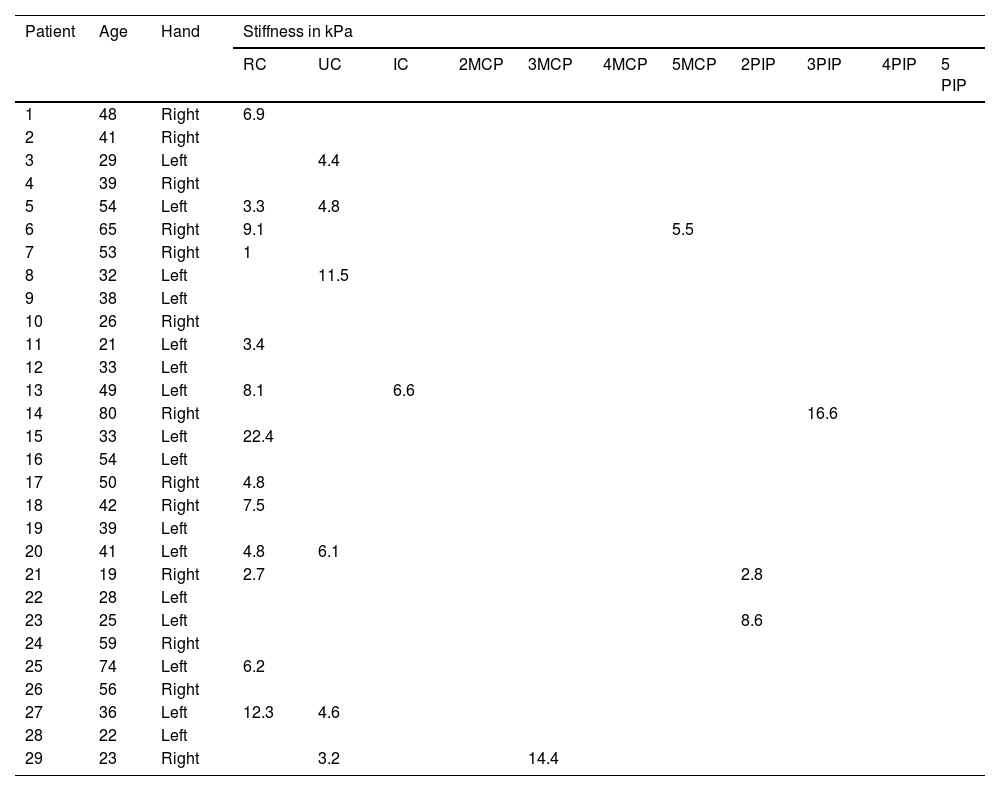
Anatomical localization and stiffness (expressed in kPa) of joint fluid detected by Shear Wave elastosonography in the control group of healthy subjects with no evidence of inflammatory findings in clinical evaluation.
| Patient | Age | Hand | Stiffness in kPa | ||||||||||
|---|---|---|---|---|---|---|---|---|---|---|---|---|---|
| RC | UC | IC | 2MCP | 3MCP | 4MCP | 5MCP | 2PIP | 3PIP | 4PIP | 5 PIP | |||
| 1 | 48 | Right | 6.9 | ||||||||||
| 2 | 41 | Right | |||||||||||
| 3 | 29 | Left | 4.4 | ||||||||||
| 4 | 39 | Right | |||||||||||
| 5 | 54 | Left | 3.3 | 4.8 | |||||||||
| 6 | 65 | Right | 9.1 | 5.5 | |||||||||
| 7 | 53 | Right | 1 | ||||||||||
| 8 | 32 | Left | 11.5 | ||||||||||
| 9 | 38 | Left | |||||||||||
| 10 | 26 | Right | |||||||||||
| 11 | 21 | Left | 3.4 | ||||||||||
| 12 | 33 | Left | |||||||||||
| 13 | 49 | Left | 8.1 | 6.6 | |||||||||
| 14 | 80 | Right | 16.6 | ||||||||||
| 15 | 33 | Left | 22.4 | ||||||||||
| 16 | 54 | Left | |||||||||||
| 17 | 50 | Right | 4.8 | ||||||||||
| 18 | 42 | Right | 7.5 | ||||||||||
| 19 | 39 | Left | |||||||||||
| 20 | 41 | Left | 4.8 | 6.1 | |||||||||
| 21 | 19 | Right | 2.7 | 2.8 | |||||||||
| 22 | 28 | Left | |||||||||||
| 23 | 25 | Left | 8.6 | ||||||||||
| 24 | 59 | Right | |||||||||||
| 25 | 74 | Left | 6.2 | ||||||||||
| 26 | 56 | Right | |||||||||||
| 27 | 36 | Left | 12.3 | 4.6 | |||||||||
| 28 | 22 | Left | |||||||||||
| 29 | 23 | Right | 3.2 | 14.4 | |||||||||
RC (dorsal radiocarpal joint); UC (dorsal ulnocarpal joint); IC (dorsal intercarpal joint); MCP (dorsal metacarpophalangeal joint); PIP (dorsal proximal interphalangeal joint).
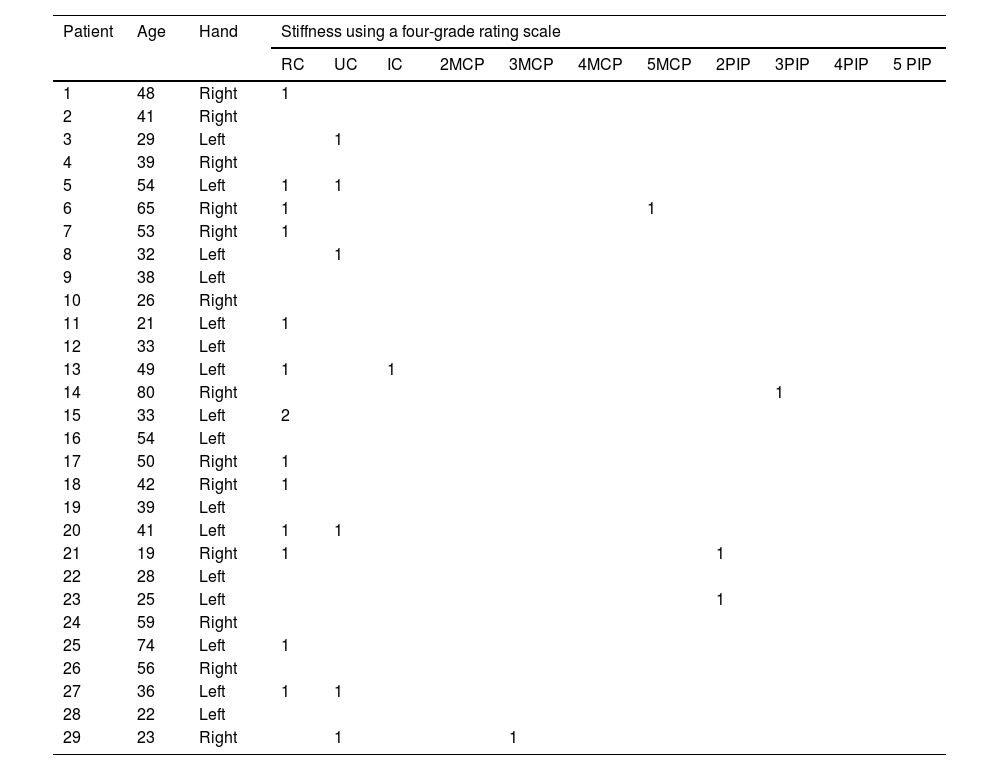
Anatomical localization and stiffness (using a four-grade rating scale depending on the synovial fluid stiffness measured by SWE) of joint fluid detected by Shear Wave elastosonography in the control group of healthy subjects with no evidence of inflammatory findings in clinical evaluation.
| Patient | Age | Hand | Stiffness using a four-grade rating scale | ||||||||||
|---|---|---|---|---|---|---|---|---|---|---|---|---|---|
| RC | UC | IC | 2MCP | 3MCP | 4MCP | 5MCP | 2PIP | 3PIP | 4PIP | 5 PIP | |||
| 1 | 48 | Right | 1 | ||||||||||
| 2 | 41 | Right | |||||||||||
| 3 | 29 | Left | 1 | ||||||||||
| 4 | 39 | Right | |||||||||||
| 5 | 54 | Left | 1 | 1 | |||||||||
| 6 | 65 | Right | 1 | 1 | |||||||||
| 7 | 53 | Right | 1 | ||||||||||
| 8 | 32 | Left | 1 | ||||||||||
| 9 | 38 | Left | |||||||||||
| 10 | 26 | Right | |||||||||||
| 11 | 21 | Left | 1 | ||||||||||
| 12 | 33 | Left | |||||||||||
| 13 | 49 | Left | 1 | 1 | |||||||||
| 14 | 80 | Right | 1 | ||||||||||
| 15 | 33 | Left | 2 | ||||||||||
| 16 | 54 | Left | |||||||||||
| 17 | 50 | Right | 1 | ||||||||||
| 18 | 42 | Right | 1 | ||||||||||
| 19 | 39 | Left | |||||||||||
| 20 | 41 | Left | 1 | 1 | |||||||||
| 21 | 19 | Right | 1 | 1 | |||||||||
| 22 | 28 | Left | |||||||||||
| 23 | 25 | Left | 1 | ||||||||||
| 24 | 59 | Right | |||||||||||
| 25 | 74 | Left | 1 | ||||||||||
| 26 | 56 | Right | |||||||||||
| 27 | 36 | Left | 1 | 1 | |||||||||
| 28 | 22 | Left | |||||||||||
| 29 | 23 | Right | 1 | 1 | |||||||||
RC (dorsal radiocarpal joint); UC (dorsal ulnocarpal joint); IC (dorsal intercarpal joint); MCP (dorsal metacarpophalangeal joint); PIP (dorsal proximal interphalangeal joint).
During the elastosonography, eight patients underwent clinical evaluation: four with SLE, two with RA, one with undifferentiated seronegative arthritis, and one with polymyalgia rheumatica. Their disease activity was classified as mild to moderate, based on measurements of the DAS28-ESR (3.39±1.19), pain using the visual analogue scale (VAS) (3.39±1.2), swollen joint count (SJC) (3±2.2 joints), tender joint count (TJC) (3.1±3 joints), mean C-reactive protein (CRP) (0.63±0.8mg/dL, with a normal value of <0.5mg/dL), and mean erythrocyte sedimentation rate (ESR) (18±14.8mm/h). The mean SLEDAI score in the four SLE patients was 5±2.6. The mean kPa obtained by adding up the kPa values of all the findings in the joints was 67.5±68.2kPa, while the mean maximum kPa found in a single joint in each patient was 42.4±21.6kPa.
Fig. 1 illustrates the association between the maximum kPa value found in patients and various measurements related to disease activity. We found a significant association with the swollen joint count (SJC) and a marginally significant association with the tender joint count (TJC). Additionally, there was a positive association between pain, as measured by VAS, and the DAS28-ESR.
We observed a 34.75% concordance between the location of synovitis detected clinically and through SWE. When analyzing the area under the curve, we obtained an area of 0.829 for discriminating between cases and controls based on the maximum kPa values (Fig. 2), of 0.834 based on the median kPa values (Fig. 3), and an area of 0.841 based on mean kPa values (Fig. 4). The optimal cut-off value, according to the Youden index, would be 16.6kPa for the maximum kPa values, 11.53 for the median kPa values, and 11.56 for the mean kPa values. Fig. 9 provides an example of a SWE examination with the probe located in a sagittal position at the level of the dorsal radiocarpal joint, while Fig. 10 shows an example of a swollen wrist in a patient with a known rheumatological history and suspected active synovitis.
Discussion
Tissue elasticity is an important characteristic that is closely related to pathological tissue states.20 Elastography provides data on biomechanical characteristics, such as stiffness and elasticity, by analyzing radiofrequency signals derived from the elastic response of tissues when stimulated with specific perpendicular ultrasound beams that the transducer automatically produces. A qualitative map is obtained using a colorimetric scale expressed in kilopascals in a range from 0kPa (soft tissue, dark blue) to 180kPa (hard tissue, red).
Using SWE, we can determine the absolute tissue stiffness value in a non-invasive and objective procedure, without requiring an operator-dependent technique.21,22 Its value has already been demonstrated and validated in chronic liver disease,23 liver masses,24 thyroid,25 breast,26 prostate,27 skin,28 and ocular29 pathologies. Its use in superficial musculoskeletal structures represents a new and promising tool in clinical practice.30–33
Conventional ultrasound integrated with the PD vascular module is widely used in clinical practice. Despite showing excellent potential in the diagnosis and detection of synovitis, it exhibits different sensitivity and specificity values and cannot serve as a “gold standard” method for the diagnosis of this condition.2–12 It is well known that an inflammatory infiltrate in synovial fluid has been observed in patients with inflammatory arthropathies.34
Recently, it has been hypothesized and highlighted that in some inflammatory pathologies, such as RA, at the end of the inflammatory cascade, a deposit of neutrophils and fibrin is observed in the synovial fluid of the affected joint. This deposit determines the macroscopic appearance of some hyperechoic bodies on synovial fluid ultrasound and is related to joint stiffness symptoms.35–39
Although the literature describes SWE studies in the musculoskeletal system,30–33,36,37 quantifying synovial fluid stiffness in healthy controls and those with a history of inflammatory pathology has been scarcely performed.18,38 We aimed to evaluate whether there were differences in synovial fluid elasticity between patients with clinical suspicion of synovitis and healthy controls. As far as we know, this is one of the first studies to evaluate the hardness of synovial fluid in inflammatory joint pathologies. Our results showed that the average stiffness of synovial fluid in patients with clinical suspicion of synovitis is significantly higher than in healthy controls. This suggests that synovial fluid showing inflammatory features exhibits increased stiffness, likely due to the accumulation of inflammatory proteins and cells. SWE could potentially be used as a highly specific diagnostic method to differentiate synovitis from non-pathologic joint effusion or that secondary to joint degenerative changes.
This positive correlation between inflammatory activity and increased joint stiffness has already been described in the literature, although conventional elastosonography techniques rather than SWE were used.19,36 Chandel et al. recently conducted a prospective study comparing synovial stiffness values in two groups of patients affected by rheumatoid arthritis and tuberculous arthritis using SWE.39 They obtained statistically significantly higher stiffness values in the rheumatoid arthritis group than in the tuberculous arthritis group. Although the populations under study are different, the results obtained agree with our main hypothesis that an increase and the progressive deposit of cells and proteins in the synovial fluid in inflammatory pathology, such as rheumatoid arthritis, results in an increase in stiffness compared to normal synovial fluid or infected tuberculous synovial fluid, in which the presence of necrotic cells associated with fluid-caseous deposition prevails.
The study by Sammel et al. evaluated this relationship with SWE, showing contradictory results to our data.18 However, the different methodology and patient population used in this study make it less comparable to ours. The negative correlation between kPa and the ESR and CRP values that we found could be explained since most of the patients had normal values of both parameters. It would be necessary to reassess this association in patients with higher activity according to these two variables.
The low level of concordance in the location of synovitis observed clinically and by SWE could be explained by the presence of subclinical arthritis, which could have been underestimated in the physical examination and is widely described in SLE. Four of these eight patients had SLE.40 The mean number of swollen joints by physical examination was 1.37±1.2, while by SWE it was 2.25±1.9. This indicates that SWE might be a sensitive method for the detection of subclinical synovitis.
The presence of physiological fluid in wrist joints, especially in radio carpal joint, among healthy individuals is an interesting finding in our study. Wang et al.41 demonstrated that 40% of examined wrists in healthy asymptomatic individuals had physiological fluid, particularly in the radiocarpal joint.
These findings were further supported by Schmidt et al.42 in their reference values for musculoskeletal ultrasound.
Additionally, a recent MRI study by Corzo Garcia et al.43 showed a similar occurrence of synovial effusion in the radiocarpal joint among healthy individuals.
These findings could suggest that even in a healthy population, activities involving manual work, such as computer usage, can lead to the production of significant amounts of physiological fluid in the wrist joint, particularly in the radiocarpal joint.
There are some limitations to our study. Firstly, the study was conducted with a small cohort of patients and with different types of pathologies where SLE patients might be overrepresented due to an unpremeditated bias of our center. In our hospital, the rheumatologist usually performs joint US evaluation of the more frequent joint diseases (RA, PsA), while the radiologist ordinarily performs the study of SLE arthritis, and we are currently performing several imaging studies in SLE patients. Furthermore, the physical examination could only be performed at the same time of the ultrasound in eight of the patients due to schedule incompatibilities. Secondly, there is a lack of similar studies that can compare data in terms of synovial fluid stiffness, and a lack of histological findings that support the hypothesis that the increase in fluid stiffness found in patients with synovitis is due to an increase in inflammatory proteins and cellular components.
Furthermore, the US is a highly operator-dependent technique that does not allow for the certain differentiation between the superficial and deep layers of the synovial membrane, which may exhibit different levels of stiffness. Other limitations include the use of the DAS28 score as an activity scale for various autoimmune diseases, despite its lack of official validation, as well as the unilateral elastosonographic evaluation of patients, which necessitated the adjustment of SJC and TJC values to those of the hand studied by elastosonography.44,45
Further studies are needed to evaluate the efficacy of this promising method in evaluating synovitis in inflammatory arthropathy and to compare SWE with diagnostic imaging techniques already utilized in the study of synovitis, such as PD and MRI.13,14
ConclusionsPreliminary results from our study suggest that SWE is a promising technique that may play a role in the diagnosis and assessment of synovial inflammatory activity.
FundingThe authors have not declared a specific grant for this research from any funding agency in the public, commercial or not-for-profit sectors.
Conflict-of-interest statementThe authors have no conflicts of interest to declare.
CRediT authorship contribution statementS. Marsico: . I. Carrión Barberà: . A. Agustí Claramunt: . J. Monfort Faure: . J.M. Maiques Llácer: . T.C. Salman Monte: . A. Solano López: .

