


To evaluate if the tumour perfusion at the initial MRI scan is a marker of prognosis for survival in patients diagnosed with High Grade Gliomas (HGG). To analyse the risk factors which influence on the mortality from HGG to quantify the overall survival to be expected in patients.
Patients and methodsThe patients diagnosed with HGG through a MRI scan in a third-level hospital between 2017 and 2019 were selected. Clinical and tumour variables were collected. The survival analysis was used to determine the association between the tumour perfusion and the survival time. The relation between the collected variables and the survival period was assessed through Wald’s statistical method, measuring the relationship via Cox’s regression model. Finally, the type of relationship that exists between the tumour perfusion and the survival was analysed through the Lineal Regression method.Those statistical analysis were carried out using the software SPSS v.17.
Results38 patients were included (average age: 61.1 years old). The general average survival period was 20.6 months. A relationship between the tumour perfusion at the MRI scan and the overall survival has been identified, in detail, a group with intratumor values of relative cerebral blood volume (rCBV)>3.0 has shown a significant decline in the average survival period with regard to the average survival period of the group with values <3.0 (14.6 months vs. 22.8 months, p = 0.046). It has also been proved that variables like Karnofsky’s scale and the response time since the intervention significantly influence on the survival period.
ConclusionsIt has become evident that the tumour perfusion via MRI scan has a prognostic value in the initial analysis of HGG. The average survival period of patients with rCBV less than or equal to 3.0 is significantly higher than those patients whose values are higher, which allows to be more precise with the prognosis of each patient.
Valorar si la perfusión tumoral en el estudio diagnóstico inicial de RM es un marcador pronóstico para la supervivencia en pacientes diagnosticados de gliomas de alto grado. Analizar los factores de riesgo que influyen en la mortalidad por gliomas de alto grado para poder cuantificar la supervivencia global esperada del paciente.
Pacientes y métodosSe seleccionaron las RM de todos los pacientes diagnosticados de glioma de alto grado en un hospital de tercer nivel entre los años 2017 y 2019. Se recogieron variables clínicas y tumorales. Se usó el análisis de supervivencia para determinar la asociación entre la perfusión tumoral y el tiempo de supervivencia. Se estudió la relación entre las variables recogidas y la supervivencia mediante el estadístico de Wald, cuantificando esta relación mediante la Regresión de Cox. Por último, se analizó el tipo de relación existente entre la perfusión tumoral y la supervivencia a través del estudio de Regresión Lineal. Estos análisis estadísticos se realizaron con el software SPSS v.17.
ResultadosSe incluyeron 38 pacientes (media de edad 61,1 años). La supervivencia media global fue de 20,6 meses. Se observó asociación entre la perfusión tumoral en la RM diagnóstica y la supervivencia global, mostrando el grupo con valores intratumorales de volumen sanguíneo cerebral relativo (rVSC) >3.0 una disminución significativa en el tiempo medio de supervivencia respecto al grupo con valores <3.0 (14,6 meses vs 22,8 meses, p = 0,046). También han demostrado influir significativamente en la supervivencia media variables como la escala de Karfnosky y el tiempo de recidiva desde la intervención.
ConclusionesSe ha evidenciado que la perfusión tumoral por RM tiene valor pronóstico en el estudio inicial de los gliomas de alto grado. La media de supervivencia de los pacientes con rVSC inferior o igual a 3.0 es significativamente mayor que en aquellos cuyo valor es superior, lo que permitiría una aproximación pronóstica más precisa en cada paciente en el momento del diagnóstico.
High-grade gliomas (WHO grades III and IV) are the most common malignant brain tumours among adults. Grade IV gliomas have a particularly poor prognosis. The median survival for patients with these gliomas is around 15 months from time of diagnosis. Survival at five years ranges from 5% to 10%.1,2
Magnetic resonance imaging (MRI) is the first-choice diagnostic modality,3,4 and has a key role in the characterisation of lesions as well as in treatment planning. Recent discussion has centred around whether MRI could predict the prognosis of this disease. Grade IV gliomas are tumours with marked neoangiogenesis,5 and perfusion studies can provide considerable information in this regard. As a non-invasive and easily reproducible method, they provide quantitative and qualitative assessment of brain tumours. There are three main techniques used to perform MR perfusion studies: T2*-weighted dynamic susceptibility contrast (DSC), T1-weighted dynamic contrast enhanced (DCE) and Arterial Spin Labelling. T2*-weighted perfusion primarily assesses microvasculature and angiogenesis, while T1-weighted perfusion examines vascular permeability. T2*-weighted perfusion is the most commonly employed technique and the one used in our study. It has a high signal-to-noise ratio and good temporal resolution, as well as a relatively short acquisition time.6 Some of the parameters that can be analysed include cerebral blood volume (CBV), cerebral blood flow (CBF) and mean transit time (MTT). It can also be used to obtain measurements such as relative CBV (rCBV), which is the most commonly used parameter in the assessment of brain tumours.7
Our hypothesis is that elevated CBV values on diagnostic MRI of high-grade gliomas correlate with a worse prognosis. To test this hypothesis, we will analyse the association between tumour perfusion at the initial diagnosis and the overall survival time of patients diagnosed with this pathology. We will also analyse risk factors caused by these tumours that influence mortality in order to estimate a patient’s expected length of survival.
Materials and methodsStudy design and recruitment of the patient seriesWe conducted an observational and retrospective study with a population comprised of patients diagnosed with high-grade gliomas by MRI at our centre between 2017 and 2019. The study was approved by our hospital's ethics committee.
The database used in this study was provided by the neurosurgery department of our hospital and includes patients diagnosed with high-grade gliomas in the aforementioned period.
The inclusion criteria were: 1) adult patients aged > 18; 2) diagnosed with a histologically confirmed high-grade glioma during the 2017–2019 period, and 3) MRI performed at our centre prior to biopsy. Patients were excluded if no initial perfusion study was available or if the initial perfusion study could not be assessed for technical reasons. In the relevant time period, 42 patients had been diagnosed with high-grade gliomas. Two of these were excluded for not having initial perfusion studies and another two were excluded because their perfusion studies could not be assessed for technical reasons. Therefore, the final sample size was 38 patients.
Variables analysedThe following patient characteristics were collected: age at diagnosis, sex, type of resection (total, partial or biopsy)—determined by postoperative MRI performed in the first 48–72 h after surgery, Karnofsky grade (measures the ability of cancer patients to perform routine activities [100: can perform all tasks; 0: dead]), recurrence (yes/no) and time to recurrence (time elapsed in months from date of surgery to date of imaging diagnosis of recurrence), and overall survival time (time elapsed in months from diagnosis to death or last date of update to database [December 2021]). Follow-up MRI scans were performed on a quarterly basis to monitor patients after the end of treatment.
Tumour characteristics: tumour volume (cm3), tumour necrosis (estimated in cm3 by measuring the three axes of the lesion), perfusion (perfusion ratio), laterality and expression of the p53 marker and IDH mutation (yes/no).
Image acquisition and perfusion assessmentAll studies were acquired on 1.5 T (MAGNETOM Aera) or 3.0 T (MAGNETOM Vida) scanners. The sequences performed include sagittal and axial T1-weighted, axial T2-weighted, axial diffusion-weighted (b0 and b800 values) and ADC map, susceptibility-weighted (SWI), 3D-FLAIR, T2*-gradient echo, and post-contrast 3D T1-weighted. The acquisition protocol for the GRE T2*-W perfusion sequence on the 1.5 T scanner used the following parameters: TE/TR 30/1.650 msec, 20 slices, slice thickness of 5 mm, flip angle 90 °, FOV 23 × 23 cm, voxel size 1.8 × 1.8 × 5.0 mm and acquisition matrix of 128 × 128 mm. Scanning parameters for the 3 T scanner are as follows: TE/TR 30/1.600 msec, 20 slices, slice thickness of 4 mm, flip angle 90°, FOV 22 × 22 cm, voxel size 1.7 × 1.7 × 4.0 mm and acquisition matrix of 128 × 128 mm. In both cases 7 mL of Gadovist contrast was administered at a flow rate of 5 mL/s.
For the perfusion study, the area of the tumour with the highest CBV was selected and compared with the corresponding contralateral area, resulting in an rCBV value (Fig. 1).
 Example of a perfusion curve for one of the patients. B) This image uses a colour scale to illustrate the volume of blood reaching each part of the body. The area where perfusion is to be measured has been selected using the elliptical region of interest (ROI) and mirrored so that the exact same area of the contralateral brain is measured. Perfusion (rCBV) is 2.47 higher on the side with the tumour.")
A) Example of a perfusion curve for one of the patients. B) This image uses a colour scale to illustrate the volume of blood reaching each part of the body. The area where perfusion is to be measured has been selected using the elliptical region of interest (ROI) and mirrored so that the exact same area of the contralateral brain is measured. Perfusion (rCBV) is 2.47 higher on the side with the tumour.
The data were anonymised and recorded in a database. Qualitative variables are expressed as absolute frequencies and quantitative variables as the mean and standard deviation (SD).
A survival analysis, or Kaplan-Meier curve, was used to determine whether there are differences in survival depending on the tumour perfusion value. For this purpose, the perfusion percentage variable has been coded into a new dichotomous variable: rCBV greater than 3.0, or rCBV equal to/less than 3.0. This threshold was set in consideration of previous publications8 and with the understanding that it is only an approximate value of the average perfusion of the sample being studied. The logrank test was used to determine if the differences between the two groups were statistically significant.
Analysis of the association between the variables studied and patient survival was performed using the Wald test. The Cox proportional hazards model was subsequently used to quantify this association for those variables for which the statistic was significant.
Finally, the Pearson correlation coefficient was calculated to assess the association between tumour perfusion and patient survival, and linear regression was applied to estimate the relationship.
The statistical analysis was carried out using the SPSS v.17 statistical software for Windows, considering p-values < 0.05 as significant, and setting the confidence interval at 95%.
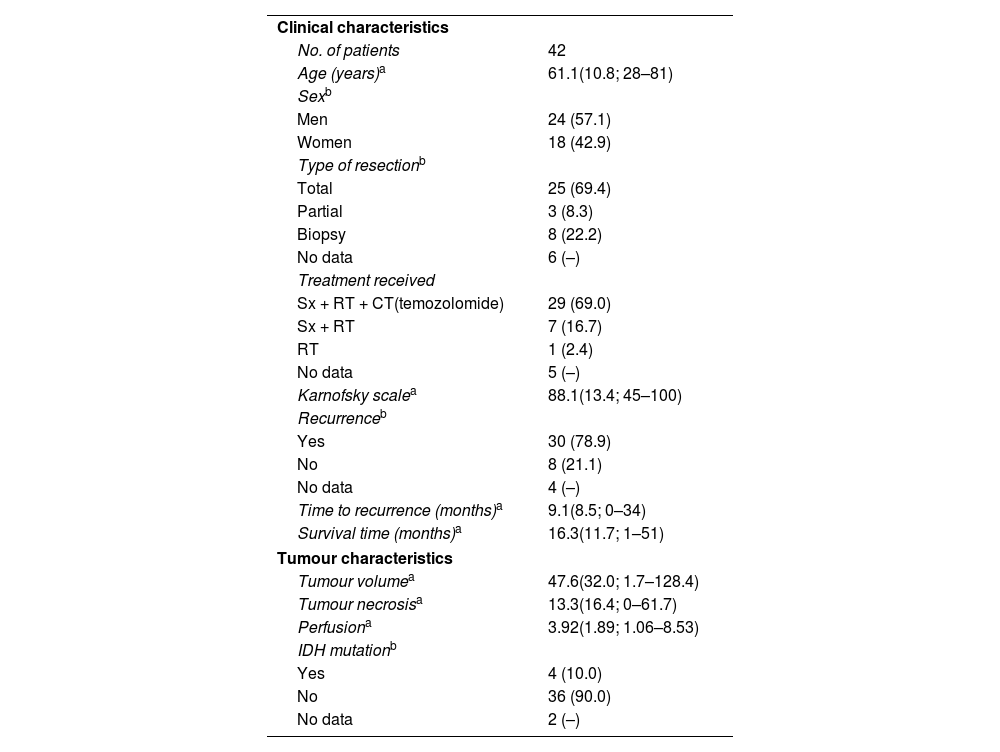
ResultsCharacteristics of the study populationTable 1 shows the clinical and tumour characteristics of the study population.
The clinical and tumour characteristics of the study population.
| Clinical characteristics | |
| No. of patients | 42 |
| Age (years)a | 61.1(10.8; 28–81) |
| Sexb | |
| Men | 24 (57.1) |
| Women | 18 (42.9) |
| Type of resectionb | |
| Total | 25 (69.4) |
| Partial | 3 (8.3) |
| Biopsy | 8 (22.2) |
| No data | 6 (–) |
| Treatment received | |
| Sx + RT + CT(temozolomide) | 29 (69.0) |
| Sx + RT | 7 (16.7) |
| RT | 1 (2.4) |
| No data | 5 (–) |
| Karnofsky scalea | 88.1(13.4; 45–100) |
| Recurrenceb | |
| Yes | 30 (78.9) |
| No | 8 (21.1) |
| No data | 4 (–) |
| Time to recurrence (months)a | 9.1(8.5; 0–34) |
| Survival time (months)a | 16.3(11.7; 1–51) |
| Tumour characteristics | |
| Tumour volumea | 47.6(32.0; 1.7–128.4) |
| Tumour necrosisa | 13.3(16.4; 0–61.7) |
| Perfusiona | 3.92(1.89; 1.06–8.53) |
| IDH mutationb | |
| Yes | 4 (10.0) |
| No | 36 (90.0) |
| No data | 2 (–) |
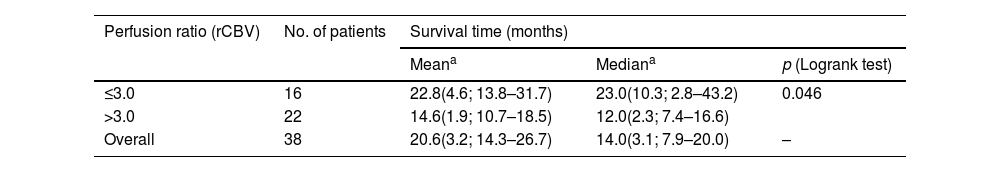
The results of the survival or Kaplan-Meier curves are summarised in Table 2 and Fig. 2, which divides our population according to the optimal threshold for perfusion percentage (≤3.0 or >3.0). Overall mean survival was 20.6 months (SD: 3.2; 95% CI: 14.3–26.7). We can observe that there is a statistically significant decline in mean survival for patients with a rCBV value greater than 3.0 compared to the group with a value equal to or less than 3.0 (14.6 months vs. 22.8 months, respectively, p = 0.046).
Results of Kaplan-Meier analysis and Logrank test for survival time based on the perfusion value.

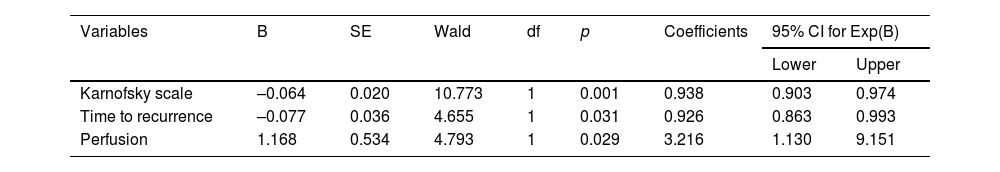
Table 3 shows the variables that influence survival according to their significance level in the Wald test. In our study, significant values were obtained for the following variables: Karnofsky scale (p = 0.001), time to recurrence (p = 0.036) and perfusion (p = 0.029).
Statistics and coefficients of the model variables.
| Variables | B | SE | Wald | df | p | Coefficients | 95% CI for Exp(B) | |
|---|---|---|---|---|---|---|---|---|
| Lower | Upper | |||||||
| Karnofsky scale | –0.064 | 0.020 | 10.773 | 1 | 0.001 | 0.938 | 0.903 | 0.974 |
| Time to recurrence | –0.077 | 0.036 | 4.655 | 1 | 0.031 | 0.926 | 0.863 | 0.993 |
| Perfusion | 1.168 | 0.534 | 4.793 | 1 | 0.029 | 3.216 | 1.130 | 9.151 |
The following Cox proportional hazards equation was used to calculate the probability of death due to high-grade glioma at time t: λt=λ0 texp(-0.064*karnofsky-0.077*t.recidiva+1.168*perfusion
A higher probability of death has been found among patients with higher tumour perfusion. According to the model, the risk of dying for a patient diagnosed with high-grade glioma with an rCBV greater than 3.0 is 3.2 times higher than for a patient with an rCBV lower than 3.0, all other things being equal (95% CI: 1.130–9.151). Meanwhile, a lower probability of death from high-grade glioma has been found in association with higher values on the Karnofsky scale; for every 10-unit increase, all other things being equal, the risk of death decreases by 6.6% (1/0.938 = 1.066; 95% CI: 0.903–0.974). A lower probability of death from high-grade glioma has also been found in association with an increase in time to recurrence from intervention; for each additional month in time to recurrence, the patient's risk of dying decreases by 8% (1/0.926 = 1.080, 95% CI: 0.863–0.993).
Study of the type of relationship between perfusion and patient survivalThe Pearson correlation coefficient calculated for perfusion ratio and survival time in months is 0.163 (p = 0.329), which implies that as the perfusion ratio increases, the expected survival time decreases. However, as no statistically significant differences were found, we cannot conclude that there is a linear relationship between the two variables.
Table 4 details the variables that were statistically significant after linear regression analysis, i.e. the risk factors that influence patient survival. The perfusion ratio variable does not appear to influence survival in this linear model (p = 0.333).
By defining a regression model with the variables that had been found to be significant, we obtained a coefficient of determination, or R2, equal to 0.574, which means that this model would explain 57.4% of the variability in the data. This low R2 value indicates that a linear model is not suitable for predicting patient survival. We have already seen that even the perfusion variable is not included in this model, whereas it does have an influence in the Cox regression model. Thus, it does not make sense to predict survival time using a linear relationship.
DiscussionIn our study, we have found an association between MRI perfusion in the initial study and the length of survival of patients diagnosed with high-grade gliomas. Therefore, cerebral perfusion can be regarded as a prognostic marker in this disease. We observed that in the group of patients exhibiting intratumoural values of rCBV >3.0, the mean survival time decreased significantly compared to the group whose values were ≤3.0 (14.6 months vs. 22.8 months, respectively).
These results are in line with numerous previous publications. Álvarez-Torres et al.9 conducted a multicentre study of 184 patients diagnosed with glioblastomas (GBM). It was based on a previous study by Albarracín et al.10 on vascular habitats of GBM and they conclude that the maximum rCBV (rCBVmax) values obtained can be used as a prognostic biomarker for this disease given that this type of tumour shows significant vascular heterogeneity. Jain et al.11 conclude that the rCBVmax values obtained can be used to predict patient survival independently of the molecular subclasses of GBM. They associate high rCBV values with a worse prognosis. In a study on pre-treatment perfusion MRI for high-grade astrocytomas (grades III and IV), Hirai et al.,12 found that when rCBV values are higher than 2.3, they can be considered to be prognostic biomarkers for predicting patient survival. This rCBV value is slightly lower than the one referenced in our study. In a study including almost 200 patients with low- and high-grade gliomas, Law et al.,13 also conclude that rCBV values above 1.75 are associated with earlier tumour progression (mean: 265 days) unlike those patients with values below 1.75 whose mean time to progression is 3585 days. Similar studies have also been published in which, unlike the above and our own, vascular permeability parameters such as the volume transfer coefficient (Ktrans) are analysed. Mills et al.14 observed that there is a direct relationship between Ktrans and survival time in GBM patients. Likewise, Sanz-Requena et al.15 estimate that Ktrans10% values are associated with a worse prognosis in patients with high-grade gliomas.
It is difficult to predict how long a patient will live following the diagnosis of a high-grade glioma. The only certainty is that in general, the lower the perfusion, the longer the survival time. However, this depends on many factors that are not easy to control: genetics, hereditary conditions, tumour type, tumour stage at diagnosis, etc. As discussed above, this study found that, in addition to perfusion, the Karnofsky grade and the time to recurrence after surgery were also significant. Similar studies with larger numbers of patients have shown that other factors, such as age, may play a role.16 It is therefore necessary to carefully study the patient's medical history and other available information.
On the other hand, the relationship between shorter survival and higher rCBV values is not linear. It would be interesting to investigate other variables, such as necrosis and time to recurrence from surgery,16 and other techniques that, when combined, could influence the model to provide more information for estimating and predicting survival time.17 It would also be useful to consider non-linear regression models, although their formulation is complex.
Concerning the limitations of our study, the first is the small sample size. Although the original database consisted of 42 patients, four were excluded due to the absence of a perfusion study in the initial MRI. The second limitation is that the study was carried out in a single centre. Another may be the non-inclusion of other clinical or histological variables, such as MGMT gene methylation status, which has been linked to the prognosis of glioblastomas.18
In conclusion, our study suggests that there is an association between MR perfusion in the initial study of high-grade gliomas and the overall survival of the patient, observing that in tumours with rCBV values > 3.0, the mean survival time decreases notably. Future studies would be necessary to validate our results including the possibility of analysing the relationship between other risk factors and survival time.
Author contributions- 1
Research coordinators: FFV, MBB, ERR, JSV, FBR and MRG.
- 2
Study concept: MRG.
- 3
Study design: MRG and ERR.
- 4
Data collection: JSV.
- 5
Data analysis and interpretation: MBB.
- 6
Data processing: MBB.
- 7
Literature search: FFV and ERR.
- 8
Drafting of article: FFV.
- 9
Critical review of the manuscript with intellectually relevant contributions: FBR.
- 10
Approval of the final version: FFV, MRG and JSV.
The authors declare that they have not received any public or private sector funding for this study.
Conflicts of interestThe authors declare that they have no conflicts of interest.

