


Transfontanellar brain ultrasound is an essential tool for monitoring the size of the ventricles in preterm neonates and has many advantages over other alternative diagnostic techniques, including its accessibility and non-use of ionizing radiation. When considering the normal ventricular size, it is essential to have reference measurements based on age-matched populations. The objective of this article is to present our reference measures, based on a sample of preterm infants that we have studied.
MethodsA retrospective observational study was conducted. Measurements of the Levene index, frontal horn thickness, and Evans index were obtained in preterm neonates from 25 to 45 weeks, over a period of 5 years, between January 2016 and December 2020. After applying the exclusion criteria, a sample of 199 patients and 350 ultrasound scans were obtained. The independent samples t-test and the Mann–Whitney test were used for the comparison of samples.
ResultsThe distribution of the right and left Levene indices was normal (Shapiro–Wilk test with p = 0.16 and 0.05, respectively), unlike the thickness distribution of the frontal horns (p < 0.05 on both sides). No significant differences were detected between the sexes (p = 0.08). A linear correlation was found between the biparietal diameter and the Levene index.
ConclusionFrom the results obtained in our study, we present reference tables for ventricular size, with the 3rd, 25th, 50th, 75th, and 97th, being the first ones made in our country.
La ecografía cerebral transfontanelar es una herramienta fundamental para monitorizar el tamaño de los ventrículos en los recién nacidos prematuros y tiene como ventajas su accesibilidad y que no usa radiaciones ionizantes. Al considerar el tamaño ventricular normal, es esencial tener medidas de referencia basadas en poblaciones de la misma edad. El objetivo de este artículo es presentar las medidas de referencia obtenidas de una muestra de neonatos prematuros de nuestro centro.
MétodosSe realizó un estudio observacional retrospectivo. Se obtuvieron mediciones del índice de Levene, grosor del cuerno frontal e índice de Evans en recién nacidos prematuros de 25 a 45 semanas, durante un período de 5 años, entre enero de 2017 y diciembre de 2021. Después de aplicar los criterios de exclusión, se tomó una muestra de 199 pacientes y Se obtuvieron 350 ecografías. Para la comparación de muestras se utilizó la prueba t de muestras independientes y la prueba de Mann-Whitney.
ResultadosLa distribución de los índices de Levene derecho e izquierdo fue normal (prueba de Shapiro-Wilk con p = 0,16 y 0,05, respectivamente), a diferencia de la distribución del grosor de los cuernos frontales (p < 0,05 en ambos lados). No se detectaron diferencias significativas entre sexos (p = 0,08). Se encontró una correlación lineal entre el diámetro biparietal y el índice de Levene.
DiscusiónA partir de los resultados obtenidos en nuestro estudio, presentamos tablas de referencia del tamaño ventricular, con los percentiles 3,25,50,75 y 97, siendo las primeras realizadas en nuestro país.
Several studies have suggested that reference values are vital to the diagnosis and treatment of cerebral ventricular dilatation.1,2 There is growing evidence that early interventions to drain cerebrospinal fluid based on ventricular measurements can reduce brain injury and improve neurodevelopment.3 Cranial ultrasound holds numerous its wide availability, high diagnostic yield in expert hands, absence of ionising radiation and ability to scan the patient without having to move them.
While there is a clear relationship between ventricular size and gestational age (GA), the concurrence of other factors such as birth weight and height, or head circumference means this relationship will not always be linear. However, it is important not to overlook other pathological conditions that may have a decisive impact on ventricular size, the most important of which is germinal matrix haemorrhage. In fact, post-haemorrhagic ventricular dilatation is particularly prevalent in preterm neonates, affecting up to 75% of them following severe cerebral haemorrhage. As a consequence of such dilatation, motor impairment may appear in later stages of development,3–5 and can lead to death in up to 44% of cases.6
Levene (1981) proposed exact measurements to aid the diagnosis of clinically significant ventriculomegaly, seeking to develop a reproducible set of measurements suitable for follow-up in successive ultrasound examinations.7 The Levene index (LI), so called in honour of its creator, came into being as a result of this work and is still in use today. It measures the absolute distance between the falx cerebri and the lateral wall of the anterior (or frontal) horn of the lateral ventricle in the coronal plane, at the level of the third ventricle. Subsequently, researchers from different countries have carried out new studies to obtain nomograms for ventricular size in the neonatal population whose normal values could be used as a reference in brain ultrasound studies. These studies used metric parameters similar to those initially used by Levene.4,8,9 However, as has already been pointed out in previous publications,8,10 the normal value curves proposed by different authors vary considerably, with these reference values being even more valuable in the groups most susceptible to developing post-haemorrhagic hydrocephalus, as is the case of the most immature neonates. As if this were not enough, some authors have questioned the usefulness of routine ultrasound examinations in preterm neonates over 30 weeks’ GA, in line with what is also advocated by the American Academy of Neurology and the Child Neurology Society.11
Nevertheless, studies based on new cohorts of preterm infants still seem necessary. This is because in the decades since the first studies of this type were conducted, there have been significant advances in perinatal care and consequently in the survival rate of the most premature neonates. Moreover, ultrasound is not a static technology and better equipment is being manufactured every year, which means the parameters subject to analysis can be more intuitively and accurately assessed. The aim of this study is to revisit some of the most commonly collected measurements in cranial ultrasound scans in neonates, and offer the first nomograms for these characteristics developed with a sample from Spain.
Material and methodsThis retrospective observational study complies with the Declaration of Helsinki and was approved by the Ethics Committee at our hospital.
PatientsWe used hospital records to compile a list of patients who underwent cranial ultrasound in our hospital between January 2017 and December 2021, obtaining an initial sample of 272 individuals.
Infants were eligible for inclusion if they were born at under 32 weeks’ GA. Only ultrasound scans performed between 25 and 45 weeks were collected and all other scans were excluded. This interval was chosen because of the lower likelihood of finding viable neonates below 25 weeks and the theory that LI is less useful in neonates over 40–45 weeks.12,13
Gestation was determined at the first prenatal ultrasound according to the unit’s standard practice. We identified ultrasound records for the eligible infants and reviewed serial ultrasound scans. As the aim was to establish normative values, those with abnormal ultrasounds were excluded from the study. The exclusion criteria were defined as:
- 1
Evidence of severe intraventricular haemorrhage (grade III) or intraparenchymal haemorrhage.
- 2
Presence of a structural abnormality.
- 3
Evidence of periventricular leukomalacia.
- 4
Any infant with a grade II intraventricular haemorrhage who subsequently developed post-haemorrhagic ventricular dilatation.
After applying the exclusion criteria, we obtained a final sample of 199 patients, giving a total number of 350 ultrasound scans to be analysed (Fig. 1a).
Measurements Flow chart with retrospective inclusion of preterm neonates (25–45 weeks) between January 2017 and December 2021. (b) Anatomical illustration of measurements analysed by cranial ultrasound: biparietal diameter (A), frontal horn width (B) and Levene index (C).")
A team of six radiologists with experience in cranial ultrasound (ranging from eight to 30 years of experience) were responsible for acquiring all cranial ultrasound images during the study period. The images were acquired following a standard scanning sequence. Measurements were taken approximately once per week until patient discharge.
During the study period, two different ultrasound machines were used, although they were the same model and had the same software features (Aplio 300, Canon Medical Systems Europe, Valencia, Spain). A curvilinear array transducer with a frequency of 8 MHz was used. Three first-year radiology trainee doctors obtained the measurements from the archived scans.
The LI was measured on an image acquired through the anterior fontanelle in a coronal plane at the level of the foramen of Monro, measuring from the falx to the lateral wall of the lateral ventricle on both sides. The frontal horn width (FHW) was calculated from its measurement in the third coronal image, which includes the third ventricle and the foramen of Monro (Fig. 1b). We also measured the Evans index (EI), defined as the ratio of the distance between the lateral borders of the frontal horns of the lateral ventricles to the biparietal diameter (maximum distance between the two biparietal bones [BPD]).14 Although a very useful and widely used measure,15 we did not measure either the caudothalamic distance (the distance measured from the caudothalamic groove to the upper ventricle wall) or the thalamo-occipital distance because not all sagittal images reviewed were in the right plane to assess these.
The images were viewed on a workstation with image analysis software in a PACS viewer, associated with the Orion Clinic clinical care information system. Measurements were made using the software’s caliper function, obtaining a result in centimetres and a figure to two decimal places.
Data were grouped according to GA at the time of scanning. Only ultrasound scans performed at a GA of between 25 and 45 weeks were included. If the mother was unsure of the date of the last menstrual period, an approximation of GA was chosen based on metric and morphological criteria in the obstetric ultrasound carried out during the gestational phase.
Observer validationAll observers were trained in the collection of these measurements by the more experienced radiologists, who also monitored intra- and inter-observer reliability tests to ensure a high degree of agreement. In a preliminary phase, observers were asked to collect the previously described measurements (bilateral LI and FHW, and EI) from a sample of ten patients obtained by a simple randomisation technique, on two different occasions, four weeks apart. These data were used to ascertain that all observers displayed good intra-observer reliability. The differences between the measurements made by each of the trainee doctors for the same patient were also compared and acceptable inter-observer agreement was found.
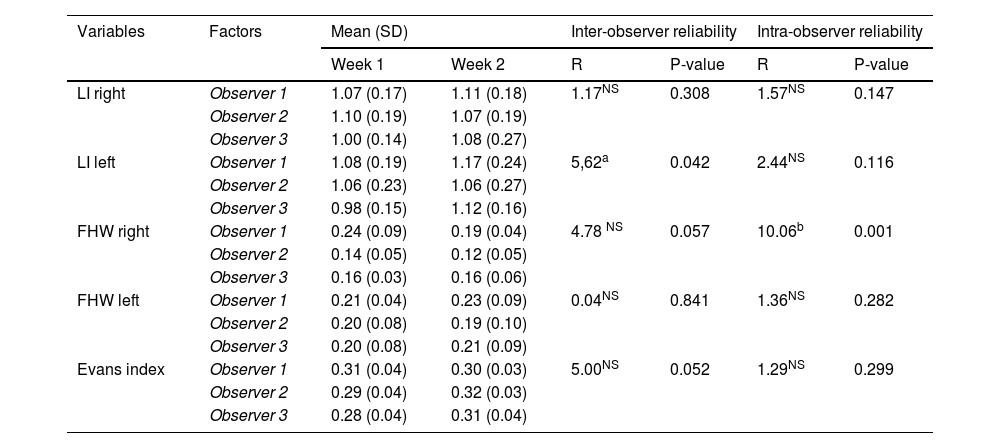
StatisticsThe analysis was carried out with SPSS 22.0 (IBM Corp., Armonk, NY, USA). Data were presented as mean ± standard deviation (SD) or median (interquartile ranges [IQR]), depending on the distribution of the variable. Percentages were also used as frequency measures for non-quantitative data. In order to simultaneously study intra-observer reliability (consistency of the same observer across the two assessment periods) and inter-observer reliability (consistency of results between the three observers), two statistical factors have been defined: a) time with two levels and b) observer with three levels, on the same sample of cases (n = 10 patients). Therefore, both are repeated measures factors. Consequently, the most appropriate method is to apply a two-factor repeated measures ANOVA on each of the five quantitative variables. For the comparison of samples, the independent samples t-test was used for normally distributed samples, while the Mann-Whitney test was used for non-parametrically distributed samples. Pearson's correlation coefficient was used as a measure of linear dependence between two variables.
ResultsStatisticsIn the five years covered by the study, we obtained an initial sample of 272 neonates, eligible for having undergone a cranial ultrasound. Following the exclusion of patients who did not comply with the age criteria, had comorbidities or whose ultrasound images were unavailable or of poor-quality, we obtained a final sample of 199 individuals. Of these, 90 (45.23%) were female, and 109 (54.77%) were male. The mean GA of patients at birth was 28.82 weeks (SD 26.34–31.29).
Intra- and inter-observer reliability studyIn a preliminary stage no statistically significant differences were identified (p > 0.05) in the following variables: right LI, left frontal horn, EI (Table 1), which allows us to confirm intra- and inter-observer reliability. For the left LI there was a marginally significant difference (p < 0.05) in the inter-observer reliability. This was due to Observer 3 attributing lower values for their week one observations (p < 0.05). For the other two observers there was no significant difference (p > 0.05). Therefore, there is a slight doubt as to the internal reliability of this observer, but reliability across the three can be confirmed. For the right FHW, all three observers demonstrated good intra-observer reliability (p > 0.05), but significant differences (p < 0.01) have been found between the observers.
Two-factor repeated measures ANOVA. Analysis of inter- and intra-observer reliability (n = 10 patients).
| Variables | Factors | Mean (SD) | Inter-observer reliability | Intra-observer reliability | |||
|---|---|---|---|---|---|---|---|
| Week 1 | Week 2 | R | P-value | R | P-value | ||
| LI right | Observer 1 | 1.07 (0.17) | 1.11 (0.18) | 1.17NS | 0.308 | 1.57NS | 0.147 |
| Observer 2 | 1.10 (0.19) | 1.07 (0.19) | |||||
| Observer 3 | 1.00 (0.14) | 1.08 (0.27) | |||||
| LI left | Observer 1 | 1.08 (0.19) | 1.17 (0.24) | 5,62a | 0.042 | 2.44NS | 0.116 |
| Observer 2 | 1.06 (0.23) | 1.06 (0.27) | |||||
| Observer 3 | 0.98 (0.15) | 1.12 (0.16) | |||||
| FHW right | Observer 1 | 0.24 (0.09) | 0.19 (0.04) | 4.78 NS | 0.057 | 10.06b | 0.001 |
| Observer 2 | 0.14 (0.05) | 0.12 (0.05) | |||||
| Observer 3 | 0.16 (0.03) | 0.16 (0.06) | |||||
| FHW left | Observer 1 | 0.21 (0.04) | 0.23 (0.09) | 0.04NS | 0.841 | 1.36NS | 0.282 |
| Observer 2 | 0.20 (0.08) | 0.19 (0.10) | |||||
| Observer 3 | 0.20 (0.08) | 0.21 (0.09) | |||||
| Evans index | Observer 1 | 0.31 (0.04) | 0.30 (0.03) | 5.00NS | 0.052 | 1.29NS | 0.299 |
| Observer 2 | 0.29 (0.04) | 0.32 (0.03) | |||||
| Observer 3 | 0.28 (0.04) | 0.31 (0.04) | |||||
NS: not significant; ANOVA: analysis of variance; LI: Levene index; FHW: frontal horn width.
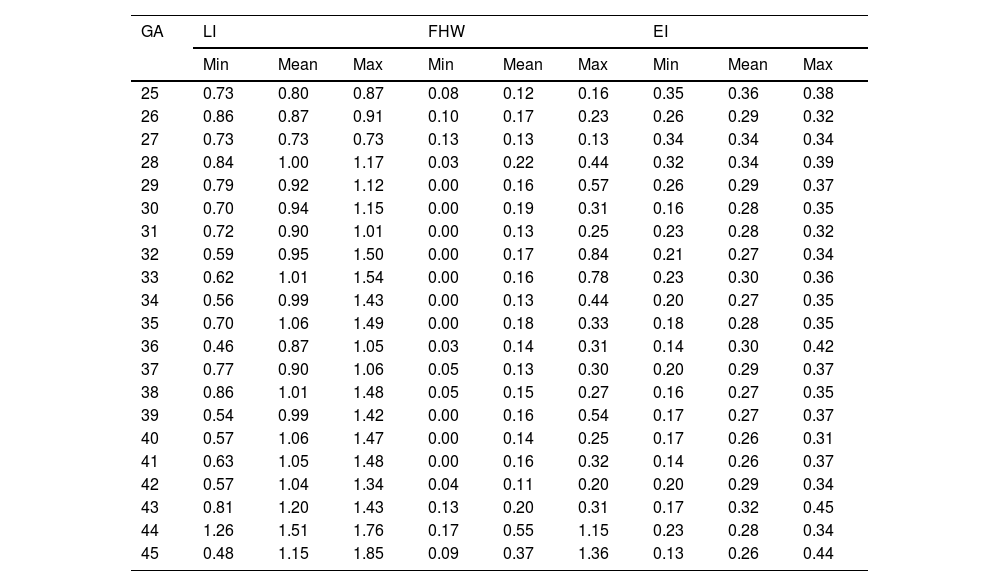
Table 2 sets out the minimum, maximum and mean values for LI, FHW and EI according to GA week.
Mean, minimum (min) and maximum (max) Levene index (LI) value, frontal horn width (FHW), Evans index (EI) according to gestational age (GA) (weeks).
| GA | LI | FHW | EI | ||||||
|---|---|---|---|---|---|---|---|---|---|
| Min | Mean | Max | Min | Mean | Max | Min | Mean | Max | |
| 25 | 0.73 | 0.80 | 0.87 | 0.08 | 0.12 | 0.16 | 0.35 | 0.36 | 0.38 |
| 26 | 0.86 | 0.87 | 0.91 | 0.10 | 0.17 | 0.23 | 0.26 | 0.29 | 0.32 |
| 27 | 0.73 | 0.73 | 0.73 | 0.13 | 0.13 | 0.13 | 0.34 | 0.34 | 0.34 |
| 28 | 0.84 | 1.00 | 1.17 | 0.03 | 0.22 | 0.44 | 0.32 | 0.34 | 0.39 |
| 29 | 0.79 | 0.92 | 1.12 | 0.00 | 0.16 | 0.57 | 0.26 | 0.29 | 0.37 |
| 30 | 0.70 | 0.94 | 1.15 | 0.00 | 0.19 | 0.31 | 0.16 | 0.28 | 0.35 |
| 31 | 0.72 | 0.90 | 1.01 | 0.00 | 0.13 | 0.25 | 0.23 | 0.28 | 0.32 |
| 32 | 0.59 | 0.95 | 1.50 | 0.00 | 0.17 | 0.84 | 0.21 | 0.27 | 0.34 |
| 33 | 0.62 | 1.01 | 1.54 | 0.00 | 0.16 | 0.78 | 0.23 | 0.30 | 0.36 |
| 34 | 0.56 | 0.99 | 1.43 | 0.00 | 0.13 | 0.44 | 0.20 | 0.27 | 0.35 |
| 35 | 0.70 | 1.06 | 1.49 | 0.00 | 0.18 | 0.33 | 0.18 | 0.28 | 0.35 |
| 36 | 0.46 | 0.87 | 1.05 | 0.03 | 0.14 | 0.31 | 0.14 | 0.30 | 0.42 |
| 37 | 0.77 | 0.90 | 1.06 | 0.05 | 0.13 | 0.30 | 0.20 | 0.29 | 0.37 |
| 38 | 0.86 | 1.01 | 1.48 | 0.05 | 0.15 | 0.27 | 0.16 | 0.27 | 0.35 |
| 39 | 0.54 | 0.99 | 1.42 | 0.00 | 0.16 | 0.54 | 0.17 | 0.27 | 0.37 |
| 40 | 0.57 | 1.06 | 1.47 | 0.00 | 0.14 | 0.25 | 0.17 | 0.26 | 0.31 |
| 41 | 0.63 | 1.05 | 1.48 | 0.00 | 0.16 | 0.32 | 0.14 | 0.26 | 0.37 |
| 42 | 0.57 | 1.04 | 1.34 | 0.04 | 0.11 | 0.20 | 0.20 | 0.29 | 0.34 |
| 43 | 0.81 | 1.20 | 1.43 | 0.13 | 0.20 | 0.31 | 0.17 | 0.32 | 0.45 |
| 44 | 1.26 | 1.51 | 1.76 | 0.17 | 0.55 | 1.15 | 0.23 | 0.28 | 0.34 |
| 45 | 0.48 | 1.15 | 1.85 | 0.09 | 0.37 | 1.36 | 0.13 | 0.26 | 0.44 |
LI and FHW are given in centimetres; EI has no units.
As the right and left LI were normally distributed (Shapiro-Wilk test with p = 0.16 and 0.05, respectively), a paired t-test was performed to detect any asymmetry, with no statistically significant differences found between the two samples (p = 0.77). For this reason, the LI was subsequently averaged, as in previous studies,2,6,7 thus establishing the nomograms shown in Fig. 2a and b. As established by subsequent research, we have added a graph showing the evolution of 97th percentile plus 4 mm, since this is considered a good reference parameter for initiating treatment for ventriculomegaly (Fig. 2c).16 No significant differences in mean LI were detected between the two sexes (p = 0.08). The evolution of LI according to GA with sex-differentiated curves is shown in Fig. 2d.
 and percentiles (b) 3, 25, 50, 75 and 97. (c) Graph with 97th percentile (solid line) and 97th percentile + 4 mm (dashed line). (d) Longitudinal reference curves of the Levene index according to sex.")
FWH followed a non-normal distribution (p < 0.05 on both sides). However, the Wilcoxon test determined that there were no significant differences between the two samples, albeit only marginally (p = 0.06). The nomogram for FHW can be seen in Fig. 3a and b.
 and percentiles 3, 25, 50, 75 and 97 (b).")
Fig. 4a and b show the percentile distribution of the BPD, which is used as a reference for body size.
 and 3, 25, 50, 75 and 97 percentiles (b).")
We also examined the percentile distribution of the EI, with the corresponding graphical representation in Fig. 5a and b.
 and 3, 25, 50, 75 and 97 percentiles (b).")
In order to detect which variable correlates best with the BPD, we examined its linear dependence with Pearson's correlation coefficient, obtaining the results presented in Table 3. Therefore, the coefficient is to one, the greater the dependence between the two variables.
Correlation of different variables with biparietal diameter using the Pearson correlation coefficient.
| Variables | Correlation coefficient |
|---|---|
| Evans index/Biparietal diameter | 0.034 |
| Frontal horn width/Biparietal diameter | 0.055 |
| Biparietal diameter/Biparietal diameter | 0.832 |
| Levene index/Biparietal diameter | 0.837 |
Cranial ultrasound is a staple tool for studying the size of ventricles in newborns, allowing the effective and rapid diagnosis of abnormal enlargement of the cerebral ventricles.17 Although the diagnosis of moderate and severe ventriculomegaly may be a priori straightforward, the radiologist may face real difficulties when trying to differentiate mild ventriculomegaly from a ventricular size within normal limits. This limitation is not unique to cranial ultrasound, but also occurs when using alternative diagnostic techniques such as computed tomography (CT) or magnetic resonance imaging (MRI).18
The fact that ventricular size increases over time further complicates the standardisation of the dimensions considered normal, making it necessary to create longitudinal reference curves. It is important that these nomograms, in addition to being up to date, come from a population of neonates with comparable body build and phylogenetic characteristics.
When analysing the Fenton charts taken as a reference for postnatal growth in preterm neonates,19 it seems that the weight curve has too steep a slope to establish an adequate correlation with LI or FHW. Although the weight parameter has been taken as a reference point with which to correlate LI in most previous studies,7–9 the morphology of the curves suggests that it would be more logical to correlate LI with other neonate physical characteristics such as height or head circumference, also represented in the Fenton table. In our study, we have chosen to use BPD, which is not only an indicator of the body size of the individual, but also a measure that can be obtained with LI in the same scan. This decision is supported by the good linear correlation between LI and BPD in our study. In addition, a good correlation can be indirectly inferred due to the observable stability of the EI, in line with previous studies.20,21
In our study, a slightly larger ventricular size was observed in males. However, this difference was not significant. Brouwer et al. already proposed the existence of a higher FHW at birth in males, a situation that is later compensated by a smaller increase in FHW until they reach the equivalent of full-term GA, followed by the complete disappearance between the sexes at later stages.9 To date, reference nomograms for LI have not distinguished between the sexes and this is because other authors have also failed to detect such significance.8 However, there does seem to be a clear predisposition of male preterm neonates to present with isolated congenital hydrocephalus22,23 or hydrocephalus associated with intracranial haemorrhage.24–26
In terms of reproducibility, observers were consistent in their own measurements of the ventricles and as a group. The right and left LI parameters proved to be the most reliable. In this sense, the results obtained were not exactly the same to those of a study of similar design,9 but that fact that our project included three observers instead of two and that, unlike others, the same ultrasound machine was always used should be considered. The EI has also shown good inter- and intra-observer reliability, as is the case in adults,27,28 which makes it a doubly interesting measure, given its direct relationship with other parameters such as LI or BPD.
The use of FHW has been recommended by some authors due to the fact that these values can be abnormal in the earliest stages of hydrocephalus.29 Accordingly, an FHW of less than 3 mm has been proposed as normal, with the 95th percentile curve reaching 2 mm at 36 weeks and 3 mm at 40 weeks.30 These results seem to some extent congruent with what we observed in our work, but the non-normal distribution of the variable, as well as the intra-observer variability of the right FHW raise doubts as to its reproducibility. We should also highlight that in some cases, the lateral ventricles increase in size at the expense of the occipital horns. In these cases, it would be advisable to examine other measurements such as the thalamo-occipital distance. Nevertheless, it has not been demonstrated that increased occipital horn size is a reliable marker of increased intracranial pressure.10
One limitation of this study is that there are not many other studies that, like ours, use repeated ultrasound measurements that lead not only to cross-sectional but also longitudinal reference curves,9,31 so comparisons will not always be exact. Furthermore, the exclusion criteria vary. Some studies, such as ours, exclude severe ventricular haemorrhages while others exclude patients with mild ventricular haemorrhages or even cerebellar haemorrhages.7,9,31 In the current literature, extremely preterm neonates are underrepresented, due to the narrow margins of viability in these GAs, the only exception being the study by Goeral et al.31 Another limitation is that this study was conducted retrospectively, but it would be interesting if, based on what was observed in this study, a new prospective multicentre project could be designed to validate the results obtained. As this is the first study of this kind conducted in Spain, we would like to urge other hospital teams to join efforts to produce the most reliable longitudinal reference curves possible, which would undoubtedly result in more accurate diagnosis and better care for our patients.
ConclusionThese reference tables for ventricular size, with percentiles 3, 25, 50, 50, 75 and 97, obtained from cranial ultrasound scans in neonates with GA of between 25 and 45 weeks, will enable faster, safer and more accurate diagnoses of abnormally enlarged the lateral ventricles. We recommend them as an updated version of previous tables.
Author contributionsStudy concept and design, and data collection, analysis and interpretation: ANB, RRH, JRH, AB.
Article draft and critical content review: ANB, RRH, JRH, AB, PFG, SMD.
Final approval of the submitted version: ANB, PFG, SMD.
FundingThis research has not received funding support from public sector agencies, the business sector or any non-profit organisations.
Conflicts of interestThe authors declare that they have no conflicts of interest.

