


QTc interval prolongation is common in patients with liver cirrhosis. Cirrhotic patients suffering from complications could also prolong QT interval. We aimed to explore the role of QTc interval prolongation in cirrhotic patients with upper gastrointestinal bleeding (UGIB). Overall, 167 patients were analyzed. QTc interval prolongation presented in 111 patients (66.5%). One hundred and seven patients (64.1%) suffered from acute UGIB. Results showed that RBC, Hb, ALB and calcium (Ca) were significantly lower, and DBIL, GGT, APTT, Child–Pugh score, MELD score and ALBI score were significantly higher in the prolongation group than those without QTc prolongation. AUROC of QTc was .699 (95%CI: .623–.768). In the acute UGIB subgroup, AUROC of QTc was .478 (95%CI: .347–.611). In the HBV subgroup, AUROC of QTc was .722 (95%CI: .616–.812). QTc interval prolongation was prevalent in cirrhotic patients with UGIB and correlated with liver dysfunction. QTc might not be a valid predictor of in-hospital mortality.
La prolongación del intervalo QTc es común en pacientes con cirrosis hepática. Los pacientes cirróticos que sufrieron complicaciones también podrían prolongar el intervalo QT. Nuestro objetivo fue explorar el papel de la prolongación del intervalo QTc en pacientes cirróticos con hemorragia digestiva alta (UGIB). En total, se analizaron 167 pacientes. La prolongación del intervalo QTc se presentó en 111 pacientes (66,5%). 107 pacientes (64,1%) padecían UGIB aguda. Los resultados mostraron que RBC, Hb, ALB y calcio (Ca) fueron significativamente más bajos, y DBIL, GGT, APTT, Child-Pugh score, MELD score y ALBI score fueron significativamente más altos en el grupo de prolongación que aquellos sin prolongación QTc. El AUROC de QTc fue de 0,699 (IC 95%: 0,623-0,768). En el subgrupo UGIB agudo, el AUROC de QTc fue 0,478 (IC 95%: 0,347-0,611). En el subgrupo de VHB, el AUROC de QTc fue 0,722 (IC 95%: 0,616-0,812). La prolongación del intervalo QTc fue prevalente en pacientes cirróticos con UGIB y se correlacionó con disfunción hepática. QTc podría no ser un predictor válido de mortalidad hospitalaria.
Liver cirrhosis is the six most common cause of death all over the world, which is often as a consequence of chronic viral hepatitis, alcohol abuse, drug or autoimmune hepatitis.1 Decompensated cirrhosis is characterized by hepatic dysfunction and portal hypertension, the latter often results in upper gastrointestinal bleeding (UGIB). UGIB is a threatening common complication in patients with liver cirrhosis and consists of esophageal gastric variceal bleeding (EGVB), portal hypertensive gastropathy and peptic ulcer. The incidence of UGIB is approximately 100 per 10,000 population per year.2 EGVB represents for 60–65% mobility. UGIB mainly presents with hematemesis or melena or hematochezia if the bleeding is fast or heavy. Almost 80% of gastrointestinal bleeding and 11–15% of blood in the stool are caused by UGIB, thus UGIB is crucial in the differential diagnosis for all gastrointestinal bleeds.3
Cirrhotic cardiomyopathy (CCM) is firstly proposed by experts at the World Congress of Gastroenterology in 2005, which is defined as chronic cardiac insufficiency with systolic dysfunction and/or diastolic relaxation, and electrophysiological abnormalities such as prolongation of QT interval.4,5 QT interval prolongation occurs in 30–50% of patients with liver cirrhosis.6 QT interval varies widely from age, gender and heart rate. QTc interval is corrected by heart rate with 440ms as a threshold. QTc interval prolongation is correlated with ventricular arrhythmias and sudden cardiac death in congenital and acquired conditions.7 Prolongation of QTc interval is prevalent in patients with CCM and it is significantly associated with the severity of the liver diseases, portosystemic shunt, and portal hypertension.6 Previous studies investigated the correlation of QTc interval prolongation with patients with cirrhosis undergoing liver transplantation, with various etiologies and complications.5,8–11 However, few studies had explored the correlation of QTc interval prolongation with patients of UGIB. Now we conducted a retrospective study to explore the role of QTc interval prolongation in cirrhotic patients with UGIB.
Material and methodsWe retrospectively collected patients diagnosed with liver cirrhosis consecutively admitted to our hospital from May 2017 to May 2018. Patients who met the following criteria were included. (1) Patients were diagnosed with liver cirrhosis based on history of liver diseases, clinical manifestations, imaging examinations or liver biopsy. (2) Patients suffered from UGIB. (3) All patients have gone 12-lead electrocardiogram (ECG) tests. Patients presenting with malignancies or cardiac diseases or lack of completed laboratory data were excluded. The ethical approval was acquired from the Ethic Committee Board of our hospital. This study was retrospectively reviewed thus the informed consents were exempted.
The baseline characteristics consisted of number of patients analyzed, sex, age, etiologies, vital signs, laboratory tests (i.e., red blood count (RBC), hemoglobin (Hb), white blood count (WBC), platelet, total bilirubin (TBIL), albumin (ALB), creatinine, prothrombin time (PT), international normalized ratio (INR), etc.), clinical manifestations, acute UGIB, hepatic encephalopathy (HE), Child–Pugh class/score, model for end-stage liver diseases (MELD) score, Albumin-Bilirubin (ALBI) score/class, QTc interval, and in-hospital mortality. Data were collected at admission. QTc interval prolongation was defined as greater than 440ms. Patients were classified into two groups based on the presence of QTc interval prolongation.
Child–Pugh score was calculated based on five variables: TBIL, ALB, INR, ascites, hepatic encephalopathy. Child–Pugh was classified into three grades: class A, 5–6 scores; class B, 7–9 scores; class C, 10–15 scores.
MELD score=9.57×loge (creatinine (umol/L)×0.01)+3.78×loge (creatinine (umol/L)×0.05)+11.2×loge (INR)+6.43.
ALBI score=(log10 bilirubin (umol/L)×0.66)+albumin (g/L)×−0.085). ALBI was classified into three grades: grade 1, ≤−2.6; grade 2, >−2.6 to ≤1.39; grade 3, >−1.39.
Statistical analysisContinuous variables were expressed as mean±standard deviation or median (range) due to distribution, and categorical variables were expressed as frequency (percentage). Independent sample t test was used for comparison of continuous data and chi-square test was used for comparison of categorical data. We also performed receiving-operator characteristics (ROC) curve analysis to explore the discriminative ability of QTc in predicting the in-hospital mortality. Areas under the ROC curve (AUROC) with 95% confidence interval (95%CI) was reported. A two-tailed P value<0.05 was considered statistically significant. SPSS-Windows version 23.0 was used to perform all statistical analysis. Medcalc software version 11.4.2.0 was used for ROC curve analysis.
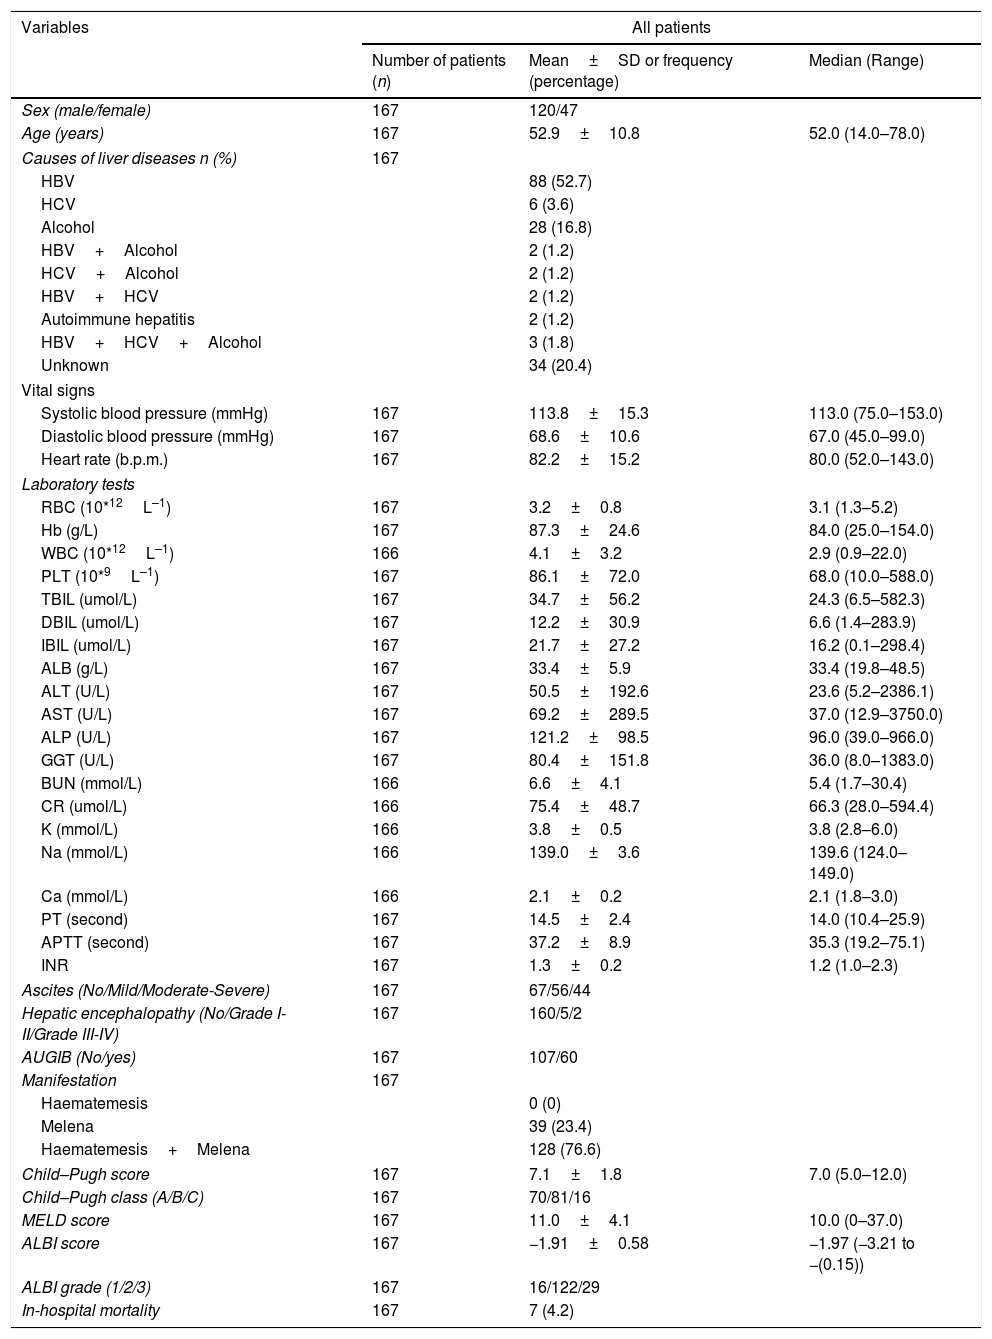
ResultsThere were 2696 patients diagnosed with liver cirrhosis admitted to our hospital. 1021 patients did not undergo 12-lead ECG, 850 suffered from hepatocellular carcinoma (HCC) or other malignancies, 19 were presented with cardiac diseases. Overall, 167 cirrhotic patients with UGIB were enrolled in our study (Fig. 1). Baseline characteristics of eligible patients were shown in Table 1. 120 patients were male (71.9%). The average age was 52.9±10.8. The main etiology was hepatitis B virus (52.7%), followed by alcohol abuse (16.8%). However, etiology of 20.4% remained unknown. 107 patients (64.1%) suffered from acute UGIB, which was defined based on Baveno VI. QTc interval prolongation was presented in 111 patients (66.5%). The in-hospital mortality was 7 (4.2%).

Baseline characteristics.
| Variables | All patients | ||
|---|---|---|---|
| Number of patients (n) | Mean±SD or frequency (percentage) | Median (Range) | |
| Sex (male/female) | 167 | 120/47 | |
| Age (years) | 167 | 52.9±10.8 | 52.0 (14.0–78.0) |
| Causes of liver diseases n (%) | 167 | ||
| HBV | 88 (52.7) | ||
| HCV | 6 (3.6) | ||
| Alcohol | 28 (16.8) | ||
| HBV+Alcohol | 2 (1.2) | ||
| HCV+Alcohol | 2 (1.2) | ||
| HBV+HCV | 2 (1.2) | ||
| Autoimmune hepatitis | 2 (1.2) | ||
| HBV+HCV+Alcohol | 3 (1.8) | ||
| Unknown | 34 (20.4) | ||
| Vital signs | |||
| Systolic blood pressure (mmHg) | 167 | 113.8±15.3 | 113.0 (75.0–153.0) |
| Diastolic blood pressure (mmHg) | 167 | 68.6±10.6 | 67.0 (45.0–99.0) |
| Heart rate (b.p.m.) | 167 | 82.2±15.2 | 80.0 (52.0–143.0) |
| Laboratory tests | |||
| RBC (10*12L–1) | 167 | 3.2±0.8 | 3.1 (1.3–5.2) |
| Hb (g/L) | 167 | 87.3±24.6 | 84.0 (25.0–154.0) |
| WBC (10*12L–1) | 166 | 4.1±3.2 | 2.9 (0.9–22.0) |
| PLT (10*9L–1) | 167 | 86.1±72.0 | 68.0 (10.0–588.0) |
| TBIL (umol/L) | 167 | 34.7±56.2 | 24.3 (6.5–582.3) |
| DBIL (umol/L) | 167 | 12.2±30.9 | 6.6 (1.4–283.9) |
| IBIL (umol/L) | 167 | 21.7±27.2 | 16.2 (0.1–298.4) |
| ALB (g/L) | 167 | 33.4±5.9 | 33.4 (19.8–48.5) |
| ALT (U/L) | 167 | 50.5±192.6 | 23.6 (5.2–2386.1) |
| AST (U/L) | 167 | 69.2±289.5 | 37.0 (12.9–3750.0) |
| ALP (U/L) | 167 | 121.2±98.5 | 96.0 (39.0–966.0) |
| GGT (U/L) | 167 | 80.4±151.8 | 36.0 (8.0–1383.0) |
| BUN (mmol/L) | 166 | 6.6±4.1 | 5.4 (1.7–30.4) |
| CR (umol/L) | 166 | 75.4±48.7 | 66.3 (28.0–594.4) |
| K (mmol/L) | 166 | 3.8±0.5 | 3.8 (2.8–6.0) |
| Na (mmol/L) | 166 | 139.0±3.6 | 139.6 (124.0–149.0) |
| Ca (mmol/L) | 166 | 2.1±0.2 | 2.1 (1.8–3.0) |
| PT (second) | 167 | 14.5±2.4 | 14.0 (10.4–25.9) |
| APTT (second) | 167 | 37.2±8.9 | 35.3 (19.2–75.1) |
| INR | 167 | 1.3±0.2 | 1.2 (1.0–2.3) |
| Ascites (No/Mild/Moderate-Severe) | 167 | 67/56/44 | |
| Hepatic encephalopathy (No/Grade I-II/Grade III-IV) | 167 | 160/5/2 | |
| AUGIB (No/yes) | 167 | 107/60 | |
| Manifestation | 167 | ||
| Haematemesis | 0 (0) | ||
| Melena | 39 (23.4) | ||
| Haematemesis+Melena | 128 (76.6) | ||
| Child–Pugh score | 167 | 7.1±1.8 | 7.0 (5.0–12.0) |
| Child–Pugh class (A/B/C) | 167 | 70/81/16 | |
| MELD score | 167 | 11.0±4.1 | 10.0 (0–37.0) |
| ALBI score | 167 | −1.91±0.58 | −1.97 (−3.21 to −(0.15)) |
| ALBI grade (1/2/3) | 167 | 16/122/29 | |
| In-hospital mortality | 167 | 7 (4.2) | |
Abbreviations: ALB, albumin; ALP, alkaline phosphatase; ALT, alanine aminotransferase; APTT, activated partial thromboplastin time; AST, aspartate aminotransferase; AUGIB, acute upper gastrointestinal bleeding; BUN, blood urea nitrogen; CR, creatinine; DBIL, direct bilirubin; GGT, gamma-glutamyl transpeptidase; HBV, hepatitis B virus; HCV, hepatitis C virus; IBIL, indirect bilirubin; INR, international normalized ratio; MELD, Model for End-Stage Liver Diseases; PBC, primary biliary cirrhosis; PLT, platelet; PT, prothrombin time; QTc, QT interval corrected by heart rate; RBC, red blood count; SD, standard deviation; TBIL, total bilirubin; WBC, white blood count.
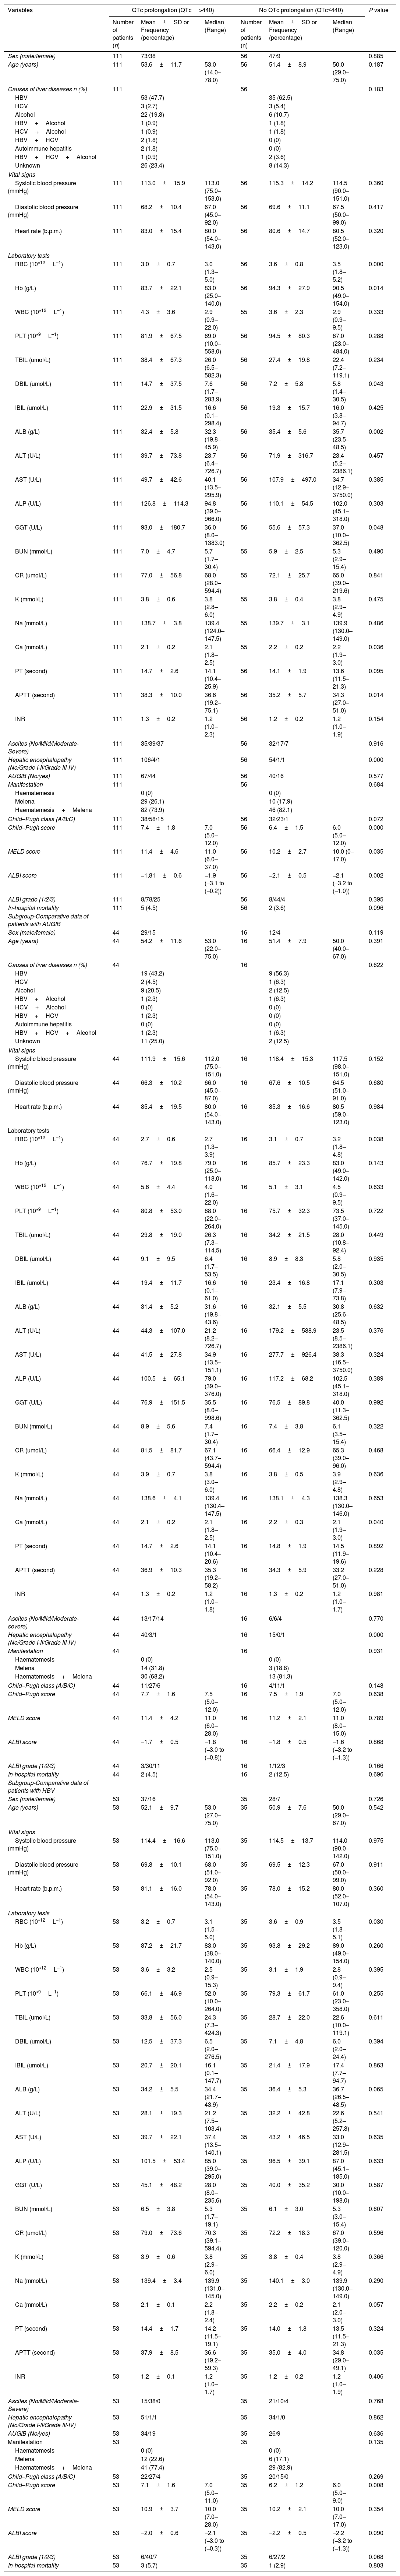
We compared the characteristics of all patients with and without QTc interval prolongation (Table 2). Results showed that RBC, Hb, ALB and calcium (Ca) were significantly lower, and DBIL, GGT, APTT, Child–Pugh score, MELD score and ALBI score were significantly higher in prolongation group than those without QTc prolongation. However, acute UGIB prevalence and in-hospital mortality were not significantly different in patients with and without QTc prolongation group. In the ROC analysis, AUROC of QTc was 0.699 (95%CI: 0.623–0.768). QTc had a cut-off value of 465 with sensitivity of 71.4% specificity 69.4% (Fig. 2).
Comparative data of patients.
| Variables | QTc prolongation (QTc>440) | No QTc prolongation (QTc≤440) | P value | ||||
|---|---|---|---|---|---|---|---|
| Number of patients (n) | Mean±SD or Frequency (percentage) | Median (Range) | Number of patients (n) | Mean±SD or Frequency (percentage) | Median (Range) | ||
| Sex (male/female) | 111 | 73/38 | 56 | 47/9 | 0.885 | ||
| Age (years) | 111 | 53.6±11.7 | 53.0 (14.0–78.0) | 56 | 51.4±8.9 | 50.0 (29.0–75.0) | 0.187 |
| Causes of liver diseases n (%) | 111 | 56 | 0.183 | ||||
| HBV | 53 (47.7) | 35 (62.5) | |||||
| HCV | 3 (2.7) | 3 (5.4) | |||||
| Alcohol | 22 (19.8) | 6 (10.7) | |||||
| HBV+Alcohol | 1 (0.9) | 1 (1.8) | |||||
| HCV+Alcohol | 1 (0.9) | 1 (1.8) | |||||
| HBV+HCV | 2 (1.8) | 0 (0) | |||||
| Autoimmune hepatitis | 2 (1.8) | 0 (0) | |||||
| HBV+HCV+Alcohol | 1 (0.9) | 2 (3.6) | |||||
| Unknown | 26 (23.4) | 8 (14.3) | |||||
| Vital signs | |||||||
| Systolic blood pressure (mmHg) | 111 | 113.0±15.9 | 113.0 (75.0–153.0) | 56 | 115.3±14.2 | 114.5 (90.0–151.0) | 0.360 |
| Diastolic blood pressure (mmHg) | 111 | 68.2±10.4 | 67.0 (45.0–92.0) | 56 | 69.6±11.1 | 67.5 (50.0–99.0) | 0.417 |
| Heart rate (b.p.m.) | 111 | 83.0±15.4 | 80.0 (54.0–143.0) | 56 | 80.6±14.7 | 80.5 (52.0–123.0) | 0.320 |
| Laboratory tests | |||||||
| RBC (10*12L–1) | 111 | 3.0±0.7 | 3.0 (1.3–5.0) | 56 | 3.6±0.8 | 3.5 (1.8–5.2) | 0.000 |
| Hb (g/L) | 111 | 83.7±22.1 | 83.0 (25.0–140.0) | 56 | 94.3±27.9 | 90.5 (49.0–154.0) | 0.014 |
| WBC (10*12L–1) | 111 | 4.3±3.6 | 2.9 (0.9–22.0) | 55 | 3.6±2.3 | 2.9 (0.9–9.5) | 0.333 |
| PLT (10*9L–1) | 111 | 81.9±67.5 | 69.0 (10.0–558.0) | 56 | 94.5±80.3 | 67.0 (23.0–484.0) | 0.288 |
| TBIL (umol/L) | 111 | 38.4±67.3 | 26.0 (6.5–582.3) | 56 | 27.4±19.8 | 22.4 (7.2–119.1) | 0.234 |
| DBIL (umol/L) | 111 | 14.7±37.5 | 7.6 (1.7–283.9) | 56 | 7.2±5.8 | 5.8 (1.4–30.5) | 0.043 |
| IBIL (umol/L) | 111 | 22.9±31.5 | 16.6 (0.1–298.4) | 56 | 19.3±15.7 | 16.0 (3.8–94.7) | 0.425 |
| ALB (g/L) | 111 | 32.4±5.8 | 32.3 (19.8–45.9) | 56 | 35.4±5.6 | 35.7 (23.5–48.5) | 0.002 |
| ALT (U/L) | 111 | 39.7±73.8 | 23.7 (6.4–726.7) | 56 | 71.9±316.7 | 23.4 (5.2–2386.1) | 0.457 |
| AST (U/L) | 111 | 49.7±42.6 | 40.1 (13.5–295.9) | 56 | 107.9±497.0 | 34.7 (12.9–3750.0) | 0.385 |
| ALP (U/L) | 111 | 126.8±114.3 | 94.8 (39.0–966.0) | 56 | 110.1±54.5 | 102.0 (45.1–318.0) | 0.303 |
| GGT (U/L) | 111 | 93.0±180.7 | 36.0 (8.0–1383.0) | 56 | 55.6±57.3 | 37.0 (10.0–362.5) | 0.048 |
| BUN (mmol/L) | 111 | 7.0±4.7 | 5.7 (1.7–30.4) | 55 | 5.9±2.5 | 5.3 (2.9–15.4) | 0.490 |
| CR (umol/L) | 111 | 77.0±56.8 | 68.0 (28.0–594.4) | 55 | 72.1±25.7 | 65.0 (39.0–219.6) | 0.841 |
| K (mmol/L) | 111 | 3.8±0.6 | 3.8 (2.8–6.0) | 55 | 3.8±0.4 | 3.8 (2.9–4.9) | 0.475 |
| Na (mmol/L) | 111 | 138.7±3.8 | 139.4 (124.0–147.5) | 55 | 139.7±3.1 | 139.9 (130.0–149.0) | 0.486 |
| Ca (mmol/L) | 111 | 2.1±0.2 | 2.1 (1.8–2.5) | 55 | 2.2±0.2 | 2.2 (1.9–3.0) | 0.036 |
| PT (second) | 111 | 14.7±2.6 | 14.1 (10.4–25.9) | 56 | 14.1±1.9 | 13.6 (11.5–21.3) | 0.095 |
| APTT (second) | 111 | 38.3±10.0 | 36.6 (19.2–75.1) | 56 | 35.2±5.7 | 34.3 (27.0–51.0) | 0.014 |
| INR | 111 | 1.3±0.2 | 1.2 (1.0–2.3) | 56 | 1.2±0.2 | 1.2 (1.0–1.9) | 0.154 |
| Ascites (No/Mild/Moderate-Severe) | 111 | 35/39/37 | 56 | 32/17/7 | 0.916 | ||
| Hepatic encephalopathy (No/Grade I-II/Grade III-IV) | 111 | 106/4/1 | 56 | 54/1/1 | 0.000 | ||
| AUGIB (No/yes) | 111 | 67/44 | 56 | 40/16 | 0.577 | ||
| Manifestation | 111 | 56 | 0.684 | ||||
| Haematemesis | 0 (0) | 0 (0) | |||||
| Melena | 29 (26.1) | 10 (17.9) | |||||
| Haematemesis+Melena | 82 (73.9) | 46 (82.1) | |||||
| Child–Pugh class (A/B/C) | 111 | 38/58/15 | 56 | 32/23/1 | 0.072 | ||
| Child–Pugh score | 111 | 7.4±1.8 | 7.0 (5.0–12.0) | 56 | 6.4±1.5 | 6.0 (5.0–12.0) | 0.000 |
| MELD score | 111 | 11.4±4.6 | 11.0 (6.0–37.0) | 56 | 10.2±2.7 | 10.0 (0–17.0) | 0.035 |
| ALBI score | 111 | −1.81±0.6 | −1.9 (−3.1 to (−0.2)) | 56 | −2.1±0.5 | −2.1 (−3.2 to (−1.0)) | 0.002 |
| ALBI grade (1/2/3) | 111 | 8/78/25 | 56 | 8/44/4 | 0.395 | ||
| In-hospital mortality | 111 | 5 (4.5) | 56 | 2 (3.6) | 0.096 | ||
| Subgroup-Comparative data of patients with AUGIB | |||||||
| Sex (male/female) | 44 | 29/15 | 16 | 12/4 | 0.119 | ||
| Age (years) | 44 | 54.2±11.6 | 53.0 (22.0–75.0) | 16 | 51.4±7.9 | 50.0 (40.0–67.0) | 0.391 |
| Causes of liver diseases n (%) | 44 | 16 | 0.622 | ||||
| HBV | 19 (43.2) | 9 (56.3) | |||||
| HCV | 2 (4.5) | 1 (6.3) | |||||
| Alcohol | 9 (20.5) | 2 (12.5) | |||||
| HBV+Alcohol | 1 (2.3) | 1 (6.3) | |||||
| HCV+Alcohol | 0 (0) | 0 (0) | |||||
| HBV+HCV | 1 (2.3) | 0 (0) | |||||
| Autoimmune hepatitis | 0 (0) | 0 (0) | |||||
| HBV+HCV+Alcohol | 1 (2.3) | 1 (6.3) | |||||
| Unknown | 11 (25.0) | 2 (12.5) | |||||
| Vital signs | |||||||
| Systolic blood pressure (mmHg) | 44 | 111.9±15.6 | 112.0 (75.0–151.0) | 16 | 118.4±15.3 | 117.5 (98.0–151.0) | 0.152 |
| Diastolic blood pressure (mmHg) | 44 | 66.3±10.2 | 66.0 (45.0–87.0) | 16 | 67.6±10.5 | 64.5 (51.0–91.0) | 0.680 |
| Heart rate (b.p.m.) | 44 | 85.4±19.5 | 80.0 (54.0–143.0) | 16 | 85.3±16.6 | 80.5 (59.0–123.0) | 0.984 |
| Laboratory tests | |||||||
| RBC (10*12L–1) | 44 | 2.7±0.6 | 2.7 (1.3–3.9) | 16 | 3.1±0.7 | 3.2 (1.8–4.8) | 0.038 |
| Hb (g/L) | 44 | 76.7±19.8 | 79.0 (25.0–118.0) | 16 | 85.7±23.3 | 83.0 (49.0–142.0) | 0.143 |
| WBC (10*12L–1) | 44 | 5.6±4.4 | 4.0 (1.6–22.0) | 16 | 5.1±3.1 | 4.5 (0.9–9.5) | 0.633 |
| PLT (10*9L–1) | 44 | 80.8±53.0 | 68.0 (22.0–264.0) | 16 | 75.7±32.3 | 73.5 (37.0–145.0) | 0.722 |
| TBIL (umol/L) | 44 | 29.8±19.0 | 26.3 (7.3–114.5) | 16 | 34.2±21.5 | 28.0 (10.8–92.4) | 0.449 |
| DBIL (umol/L) | 44 | 9.1±9.5 | 6.4 (1.7–53.5) | 16 | 8.9±8.3 | 5.8 (2.0–30.5) | 0.935 |
| IBIL (umol/L) | 44 | 19.4±11.7 | 16.6 (0.1–61.0) | 16 | 23.4±16.8 | 17.1 (7.9–73.8) | 0.303 |
| ALB (g/L) | 44 | 31.4±5.2 | 31.6 (19.8–43.6) | 16 | 32.1±5.5 | 30.8 (25.6–48.5) | 0.632 |
| ALT (U/L) | 44 | 44.3±107.0 | 21.2 (8.2–726.7) | 16 | 179.2±588.9 | 23.5 (8.5–2386.1) | 0.376 |
| AST (U/L) | 44 | 41.5±27.8 | 34.9 (13.5–151.1) | 16 | 277.7±926.4 | 38.3 (16.5–3750.0) | 0.324 |
| ALP (U/L) | 44 | 100.5±65.1 | 79.0 (39.0–376.0) | 16 | 117.2±68.2 | 102.5 (45.1–318.0) | 0.389 |
| GGT (U/L) | 44 | 76.9±151.5 | 35.5 (8.0–998.6) | 16 | 76.5±89.8 | 40.0 (11.3–362.5) | 0.992 |
| BUN (mmol/L) | 44 | 8.9±5.6 | 7.4 (1.7–30.4) | 16 | 7.4±3.8 | 6.1 (3.5–15.4) | 0.322 |
| CR (umol/L) | 44 | 81.5±81.7 | 67.1 (43.7–594.4) | 16 | 66.4±12.9 | 65.3 (39.0–96.0) | 0.468 |
| K (mmol/L) | 44 | 3.9±0.7 | 3.8 (3.0–6.0) | 16 | 3.8±0.5 | 3.9 (2.9–4.8) | 0.636 |
| Na (mmol/L) | 44 | 138.6±4.1 | 139.4 (130.4–147.5) | 16 | 138.1±4.3 | 138.3 (130.0–146.0) | 0.653 |
| Ca (mmol/L) | 44 | 2.1±0.2 | 2.1 (1.8–2.5) | 16 | 2.2±0.3 | 2.1 (1.9–3.0) | 0.040 |
| PT (second) | 44 | 14.7±2.6 | 14.1 (10.4–20.6) | 16 | 14.8±1.9 | 14.5 (11.9–19.6) | 0.892 |
| APTT (second) | 44 | 36.9±10.3 | 35.3 (19.2–58.2) | 16 | 34.3±5.9 | 33.2 (27.0–51.0) | 0.228 |
| INR | 44 | 1.3±0.2 | 1.2 (1.0–1.8) | 16 | 1.3±0.2 | 1.2 (1.0–1.7) | 0.981 |
| Ascites (No/Mild/Moderate-severe) | 44 | 13/17/14 | 16 | 6/6/4 | 0.770 | ||
| Hepatic encephalopathy (No/Grade I-II/Grade III-IV) | 44 | 40/3/1 | 16 | 15/0/1 | 0.000 | ||
| Manifestation | 44 | 16 | 0.931 | ||||
| Haematemesis | 0 (0) | 0 (0) | |||||
| Melena | 14 (31.8) | 3 (18.8) | |||||
| Haematemesis+Melena | 30 (68.2) | 13 (81.3) | |||||
| Child–Pugh class (A/B/C) | 44 | 11/27/6 | 16 | 4/11/1 | 0.148 | ||
| Child–Pugh score | 44 | 7.7±1.6 | 7.5 (5.0–12.0) | 16 | 7.5±1.9 | 7.0 (5.0–12.0) | 0.638 |
| MELD score | 44 | 11.4±4.2 | 11.0 (6.0–28.0) | 16 | 11.2±2.1 | 11.0 (8.0–15.0) | 0.789 |
| ALBI score | 44 | −1.7±0.5 | −1.8 (−3.0 to (−0.8)) | 16 | −1.8±0.5 | −1.6 (−3.2 to (−1.3)) | 0.868 |
| ALBI grade (1/2/3) | 44 | 3/30/11 | 16 | 1/12/3 | 0.166 | ||
| In-hospital mortality | 44 | 2 (4.5) | 16 | 2 (12.5) | 0.696 | ||
| Subgroup-Comparative data of patients with HBV | |||||||
| Sex (male/female) | 53 | 37/16 | 35 | 28/7 | 0.726 | ||
| Age (years) | 53 | 52.1±9.7 | 53.0 (27.0–75.0) | 35 | 50.9±7.6 | 50.0 (29.0–67.0) | 0.542 |
| Vital signs | |||||||
| Systolic blood pressure (mmHg) | 53 | 114.4±16.6 | 113.0 (75.0–151.0) | 35 | 114.5±13.7 | 114.0 (90.0–142.0) | 0.975 |
| Diastolic blood pressure (mmHg) | 53 | 69.8±10.1 | 68.0 (51.0–92.0) | 35 | 69.5±12.3 | 67.0 (50.0–99.0) | 0.911 |
| Heart rate (b.p.m.) | 53 | 81.1±16.0 | 78.0 (54.0–143.0) | 35 | 78.0±15.2 | 80.0 (52.0–107.0) | 0.360 |
| Laboratory tests | |||||||
| RBC (10*12L–1) | 53 | 3.2±0.7 | 3.1 (1.5–5.0) | 35 | 3.6±0.9 | 3.5 (1.8–5.1) | 0.030 |
| Hb (g/L) | 53 | 87.2±21.7 | 83.0 (38.0–140.0) | 35 | 93.8±29.2 | 89.0 (49.0–154.0) | 0.260 |
| WBC (10*12L–1) | 53 | 3.6±3.2 | 2.5 (0.9–15.3) | 35 | 3.1±1.9 | 2.8 (0.9–9.4) | 0.395 |
| PLT (10*9L–1) | 53 | 66.1±46.9 | 52.0 (10.0–264.0) | 35 | 79.3±61.7 | 61.0 (23.0–358.0) | 0.255 |
| TBIL (umol/L) | 53 | 33.8±56.0 | 24.3 (7.3–424.3) | 35 | 28.7±22.0 | 22.6 (10.0–119.1) | 0.611 |
| DBIL (umol/L) | 53 | 12.5±37.3 | 6.5 (2.0–276.5) | 35 | 7.1±4.8 | 6.0 (2.0–24.4) | 0.394 |
| IBIL (umol/L) | 53 | 20.7±20.1 | 16.1 (0.1–147.7) | 35 | 21.4±17.9 | 17.4 (7.7–94.7) | 0.863 |
| ALB (g/L) | 53 | 34.2±5.5 | 34.4 (21.7–43.9) | 35 | 36.4±5.3 | 36.7 (26.5–48.5) | 0.065 |
| ALT (U/L) | 53 | 28.1±19.3 | 21.2 (7.5–103.4) | 35 | 32.2±42.8 | 22.6 (5.2–257.8) | 0.541 |
| AST (U/L) | 53 | 39.7±22.1 | 37.4 (13.5–140.1) | 35 | 43.2±46.5 | 33.0 (12.9–281.5) | 0.635 |
| ALP (U/L) | 53 | 101.5±53.4 | 85.0 (39.0–295.0) | 35 | 96.5±39.1 | 87.0 (45.1–185.0) | 0.633 |
| GGT (U/L) | 53 | 45.1±48.2 | 28.0 (8.0–235.6) | 35 | 40.0±35.2 | 30.0 (10.0–198.0) | 0.587 |
| BUN (mmol/L) | 53 | 6.5±3.8 | 5.3 (1.7–19.1) | 35 | 6.1±3.0 | 5.3 (3.0–15.4) | 0.607 |
| CR (umol/L) | 53 | 79.0±73.6 | 70.3 (39.1–594.4) | 35 | 72.2±18.3 | 67.0 (39.0–120.0) | 0.596 |
| K (mmol/L) | 53 | 3.9±0.6 | 3.8 (2.9–6.0) | 35 | 3.8±0.4 | 3.8 (2.9–4.9) | 0.366 |
| Na (mmol/L) | 53 | 139.4±3.4 | 139.9 (131.0–145.0) | 35 | 140.1±3.0 | 139.9 (130.0–149.0) | 0.290 |
| Ca (mmol/L) | 53 | 2.1±0.1 | 2.2 (1.8–2.4) | 35 | 2.2±0.2 | 2.1 (2.0–3.0) | 0.057 |
| PT (second) | 53 | 14.4±1.7 | 14.2 (11.5–19.1) | 35 | 14.0±1.8 | 13.5 (11.5–21.3) | 0.324 |
| APTT (second) | 53 | 37.9±8.5 | 36.6 (19.2–59.3) | 35 | 35.0±4.0 | 34.8 (29.0–49.1) | 0.035 |
| INR | 53 | 1.2±0.1 | 1.2 (1.0–1.7) | 35 | 1.2±0.2 | 1.2 (1.0–1.9) | 0.406 |
| Ascites (No/Mild/Moderate-Severe) | 53 | 15/38/0 | 35 | 21/10/4 | 0.768 | ||
| Hepatic encephalopathy (No/Grade I-II/Grade III-IV) | 53 | 51/1/1 | 35 | 34/1/0 | 0.862 | ||
| AUGIB (No/yes) | 53 | 34/19 | 35 | 26/9 | 0.636 | ||
| Manifestation | 53 | 35 | 0.135 | ||||
| Haematemesis | 0 (0) | 0 (0) | |||||
| Melena | 12 (22.6) | 6 (17.1) | |||||
| Haematemesis+Melena | 41 (77.4) | 29 (82.9) | |||||
| Child–Pugh class (A/B/C) | 53 | 22/27/4 | 35 | 20/15/0 | 0.269 | ||
| Child–Pugh score | 53 | 7.1±1.6 | 7.0 (5.0–11.0) | 35 | 6.2±1.2 | 6.0 (5.0–9.0) | 0.008 |
| MELD score | 53 | 10.9±3.7 | 10.0 (7.0–28.0) | 35 | 10.2±2.1 | 10.0 (7.0–17.0) | 0.354 |
| ALBI score | 53 | −2.0±0.6 | −2.1 (−3.0 to (−0.3)) | 35 | −2.2±0.5 | −2.2 (−3.2 to (−1.3)) | 0.090 |
| ALBI grade (1/2/3) | 53 | 6/40/7 | 35 | 6/27/2 | 0.068 | ||
| In-hospital mortality | 53 | 3 (5.7) | 35 | 1 (2.9) | 0.803 | ||
Abbreviations: ALB, albumin; ALP, alkaline phosphatase; ALT, alanine aminotransferase; APTT, activated partial thromboplastin time; AST, aspartate aminotransferase; AUGIB, acute upper gastrointestinal bleeding; BUN, blood urea nitrogen; Ca, calcium; CR, creatinine; DBIL, direct bilirubin; GGT, gamma-glutamyl transpeptidase; HBV, hepatitis B virus; HCV, hepatitis C virus; IBIL, indirect bilirubin; INR, international normalized ratio; K, kalium; MELD, Model for End-Stage Liver Diseases; Na, natrium; PBC, primary biliary cirrhosis; PLT, platelet; PT, prothrombin time; QTc, QT interval corrected by heart rate; RBC, red blood count; SD, standard deviation; TBIL, total bilirubin; WBC, white blood count.

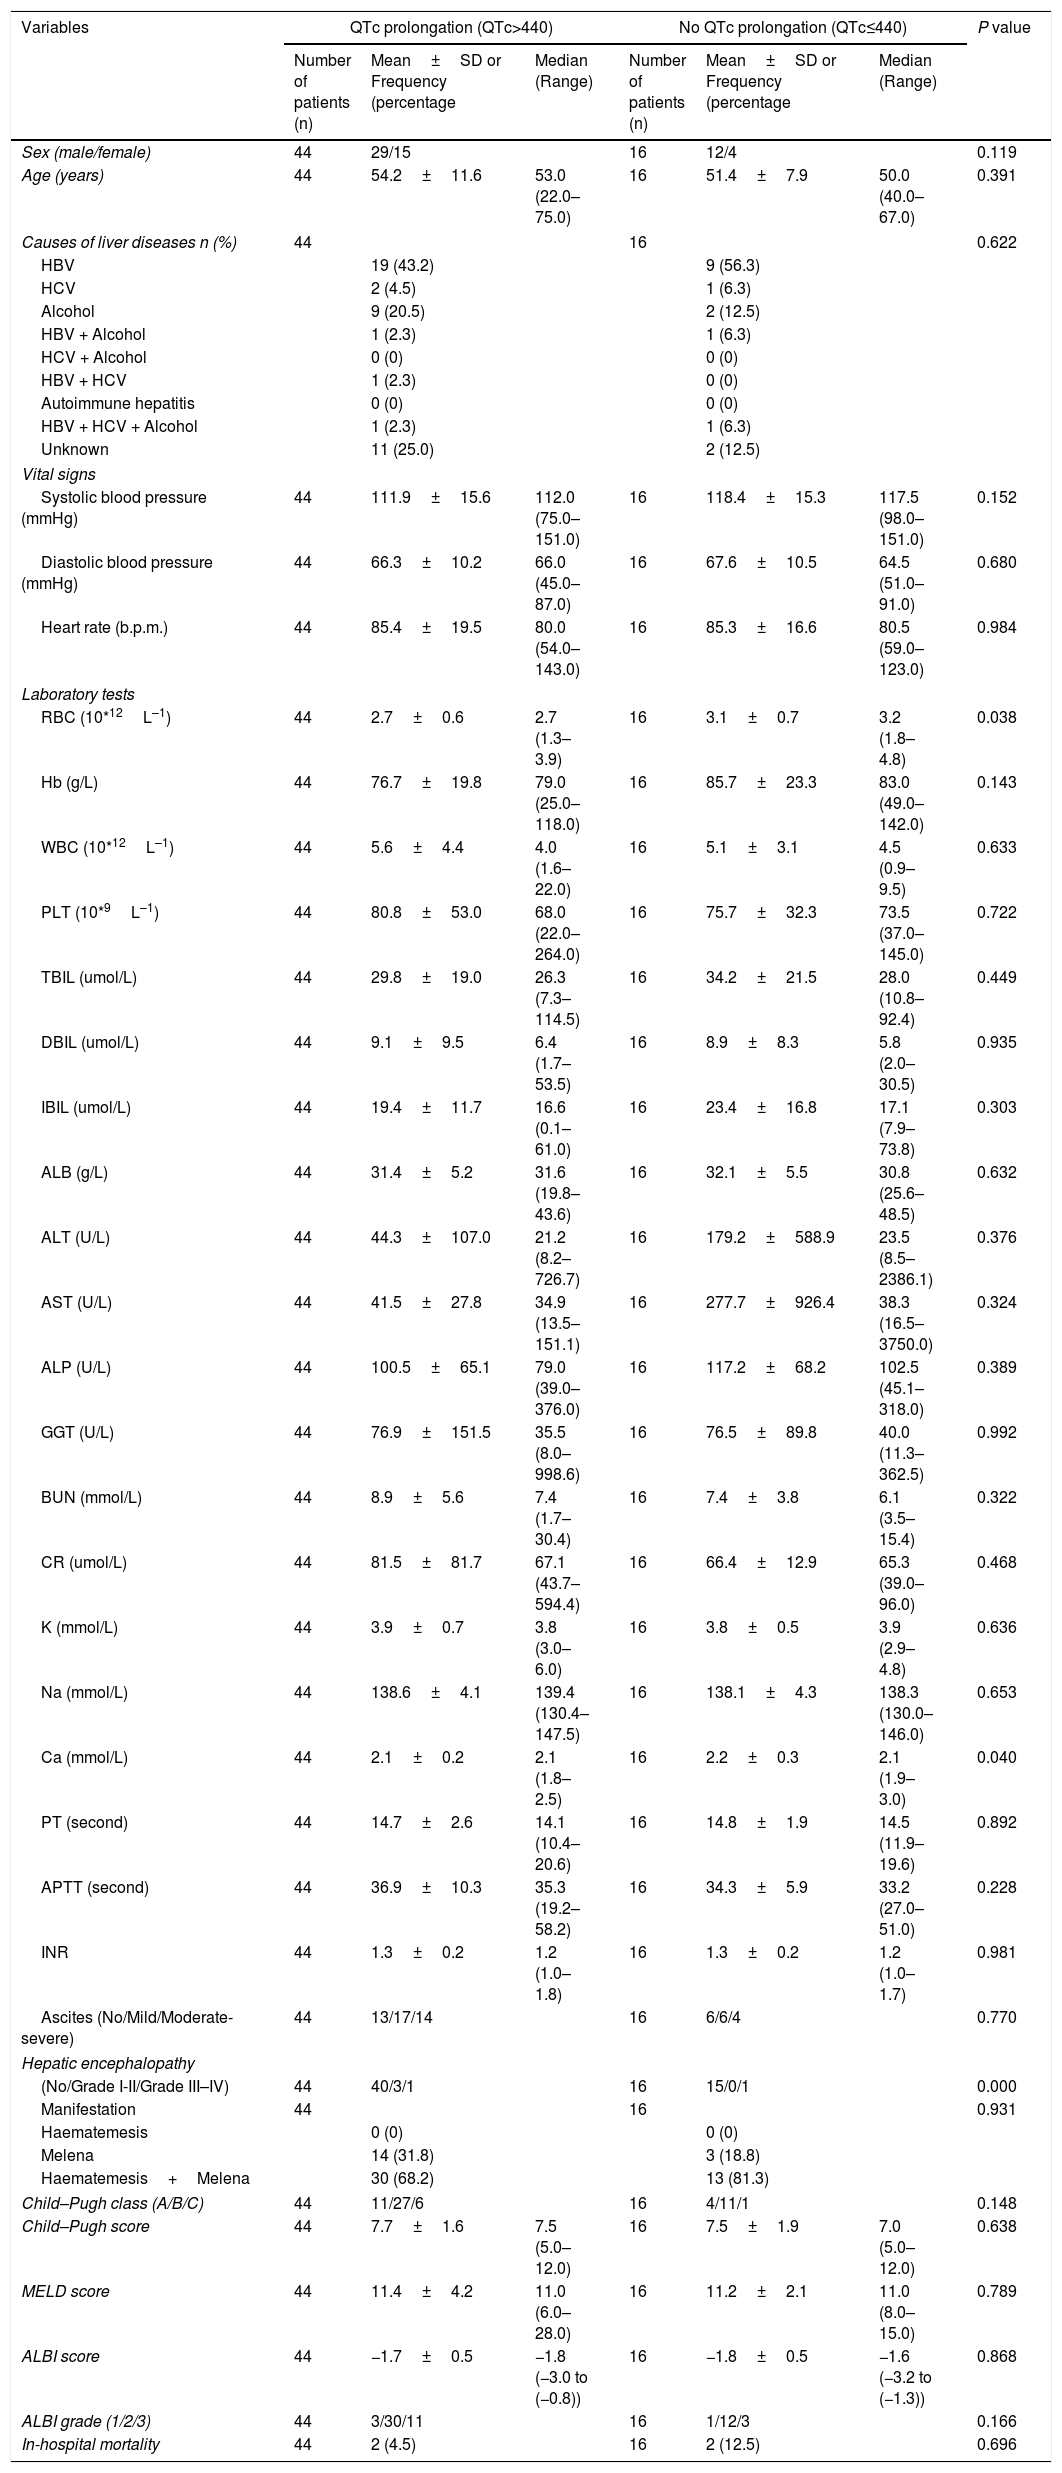
Sixty patients suffered from acute UGIB, and we compared the characteristics of patients with acute UGIB (Table 3). Results showed that RBC and Ca were significantly lower in patients with QTc prolongation. However, prognostic models of liver cirrhosis including Child–Pugh, MELD, and ALBI were not significantly different in patients with and without QTc interval prolongation. In the ROC analysis, AUROC of QTc was 0.478 (95%CI: 0.347–0.611). QTc had a cut-off value of 435 with sensitivity of 50.0% specificity 78.6% (Fig. 3).
Comparative data of patients with AUGIB.
| Variables | QTc prolongation (QTc>440) | No QTc prolongation (QTc≤440) | P value | ||||
|---|---|---|---|---|---|---|---|
| Number of patients (n) | Mean±SD or Frequency (percentage | Median (Range) | Number of patients (n) | Mean±SD or Frequency (percentage | Median (Range) | ||
| Sex (male/female) | 44 | 29/15 | 16 | 12/4 | 0.119 | ||
| Age (years) | 44 | 54.2±11.6 | 53.0 (22.0–75.0) | 16 | 51.4±7.9 | 50.0 (40.0–67.0) | 0.391 |
| Causes of liver diseases n (%) | 44 | 16 | 0.622 | ||||
| HBV | 19 (43.2) | 9 (56.3) | |||||
| HCV | 2 (4.5) | 1 (6.3) | |||||
| Alcohol | 9 (20.5) | 2 (12.5) | |||||
| HBV + Alcohol | 1 (2.3) | 1 (6.3) | |||||
| HCV + Alcohol | 0 (0) | 0 (0) | |||||
| HBV + HCV | 1 (2.3) | 0 (0) | |||||
| Autoimmune hepatitis | 0 (0) | 0 (0) | |||||
| HBV + HCV + Alcohol | 1 (2.3) | 1 (6.3) | |||||
| Unknown | 11 (25.0) | 2 (12.5) | |||||
| Vital signs | |||||||
| Systolic blood pressure (mmHg) | 44 | 111.9±15.6 | 112.0 (75.0–151.0) | 16 | 118.4±15.3 | 117.5 (98.0–151.0) | 0.152 |
| Diastolic blood pressure (mmHg) | 44 | 66.3±10.2 | 66.0 (45.0–87.0) | 16 | 67.6±10.5 | 64.5 (51.0–91.0) | 0.680 |
| Heart rate (b.p.m.) | 44 | 85.4±19.5 | 80.0 (54.0–143.0) | 16 | 85.3±16.6 | 80.5 (59.0–123.0) | 0.984 |
| Laboratory tests | |||||||
| RBC (10*12L–1) | 44 | 2.7±0.6 | 2.7 (1.3–3.9) | 16 | 3.1±0.7 | 3.2 (1.8–4.8) | 0.038 |
| Hb (g/L) | 44 | 76.7±19.8 | 79.0 (25.0–118.0) | 16 | 85.7±23.3 | 83.0 (49.0–142.0) | 0.143 |
| WBC (10*12L–1) | 44 | 5.6±4.4 | 4.0 (1.6–22.0) | 16 | 5.1±3.1 | 4.5 (0.9–9.5) | 0.633 |
| PLT (10*9L–1) | 44 | 80.8±53.0 | 68.0 (22.0–264.0) | 16 | 75.7±32.3 | 73.5 (37.0–145.0) | 0.722 |
| TBIL (umol/L) | 44 | 29.8±19.0 | 26.3 (7.3–114.5) | 16 | 34.2±21.5 | 28.0 (10.8–92.4) | 0.449 |
| DBIL (umol/L) | 44 | 9.1±9.5 | 6.4 (1.7–53.5) | 16 | 8.9±8.3 | 5.8 (2.0–30.5) | 0.935 |
| IBIL (umol/L) | 44 | 19.4±11.7 | 16.6 (0.1–61.0) | 16 | 23.4±16.8 | 17.1 (7.9–73.8) | 0.303 |
| ALB (g/L) | 44 | 31.4±5.2 | 31.6 (19.8–43.6) | 16 | 32.1±5.5 | 30.8 (25.6–48.5) | 0.632 |
| ALT (U/L) | 44 | 44.3±107.0 | 21.2 (8.2–726.7) | 16 | 179.2±588.9 | 23.5 (8.5–2386.1) | 0.376 |
| AST (U/L) | 44 | 41.5±27.8 | 34.9 (13.5–151.1) | 16 | 277.7±926.4 | 38.3 (16.5–3750.0) | 0.324 |
| ALP (U/L) | 44 | 100.5±65.1 | 79.0 (39.0–376.0) | 16 | 117.2±68.2 | 102.5 (45.1–318.0) | 0.389 |
| GGT (U/L) | 44 | 76.9±151.5 | 35.5 (8.0–998.6) | 16 | 76.5±89.8 | 40.0 (11.3–362.5) | 0.992 |
| BUN (mmol/L) | 44 | 8.9±5.6 | 7.4 (1.7–30.4) | 16 | 7.4±3.8 | 6.1 (3.5–15.4) | 0.322 |
| CR (umol/L) | 44 | 81.5±81.7 | 67.1 (43.7–594.4) | 16 | 66.4±12.9 | 65.3 (39.0–96.0) | 0.468 |
| K (mmol/L) | 44 | 3.9±0.7 | 3.8 (3.0–6.0) | 16 | 3.8±0.5 | 3.9 (2.9–4.8) | 0.636 |
| Na (mmol/L) | 44 | 138.6±4.1 | 139.4 (130.4–147.5) | 16 | 138.1±4.3 | 138.3 (130.0–146.0) | 0.653 |
| Ca (mmol/L) | 44 | 2.1±0.2 | 2.1 (1.8–2.5) | 16 | 2.2±0.3 | 2.1 (1.9–3.0) | 0.040 |
| PT (second) | 44 | 14.7±2.6 | 14.1 (10.4–20.6) | 16 | 14.8±1.9 | 14.5 (11.9–19.6) | 0.892 |
| APTT (second) | 44 | 36.9±10.3 | 35.3 (19.2–58.2) | 16 | 34.3±5.9 | 33.2 (27.0–51.0) | 0.228 |
| INR | 44 | 1.3±0.2 | 1.2 (1.0–1.8) | 16 | 1.3±0.2 | 1.2 (1.0–1.7) | 0.981 |
| Ascites (No/Mild/Moderate-severe) | 44 | 13/17/14 | 16 | 6/6/4 | 0.770 | ||
| Hepatic encephalopathy | |||||||
| (No/Grade I-II/Grade III–IV) | 44 | 40/3/1 | 16 | 15/0/1 | 0.000 | ||
| Manifestation | 44 | 16 | 0.931 | ||||
| Haematemesis | 0 (0) | 0 (0) | |||||
| Melena | 14 (31.8) | 3 (18.8) | |||||
| Haematemesis+Melena | 30 (68.2) | 13 (81.3) | |||||
| Child–Pugh class (A/B/C) | 44 | 11/27/6 | 16 | 4/11/1 | 0.148 | ||
| Child–Pugh score | 44 | 7.7±1.6 | 7.5 (5.0–12.0) | 16 | 7.5±1.9 | 7.0 (5.0–12.0) | 0.638 |
| MELD score | 44 | 11.4±4.2 | 11.0 (6.0–28.0) | 16 | 11.2±2.1 | 11.0 (8.0–15.0) | 0.789 |
| ALBI score | 44 | −1.7±0.5 | −1.8 (−3.0 to (−0.8)) | 16 | −1.8±0.5 | −1.6 (−3.2 to (−1.3)) | 0.868 |
| ALBI grade (1/2/3) | 44 | 3/30/11 | 16 | 1/12/3 | 0.166 | ||
| In-hospital mortality | 44 | 2 (4.5) | 16 | 2 (12.5) | 0.696 | ||
Abbreviations: ALB, albumin; ALP, alkaline phosphatase; ALT, alanine aminotransferase; APTT, activated partial thromboplastin time; AST, aspartate aminotransferase; AUGIB, acute upper gastrointestinal bleeding; BUN, blood urea nitrogen; Ca, calcium; CR, creatinine; DBIL, direct bilirubin; GGT, gamma-glutamyl transpeptidase; HBV, hepatitis B virus; HCV, hepatitis C virus; IBIL, indirect bilirubin; INR, international normalized ratio; K, kalium; MELD, Model for End-Stage Liver Diseases; Na, natrium; PBC, primary biliary cirrhosis; PLT, platelet; PT, prothrombin time; QTc, QT interval corrected by heart rate; RBC, red blood count; SD, standard deviation; TBIL, total bilirubin; WBC, white blood count

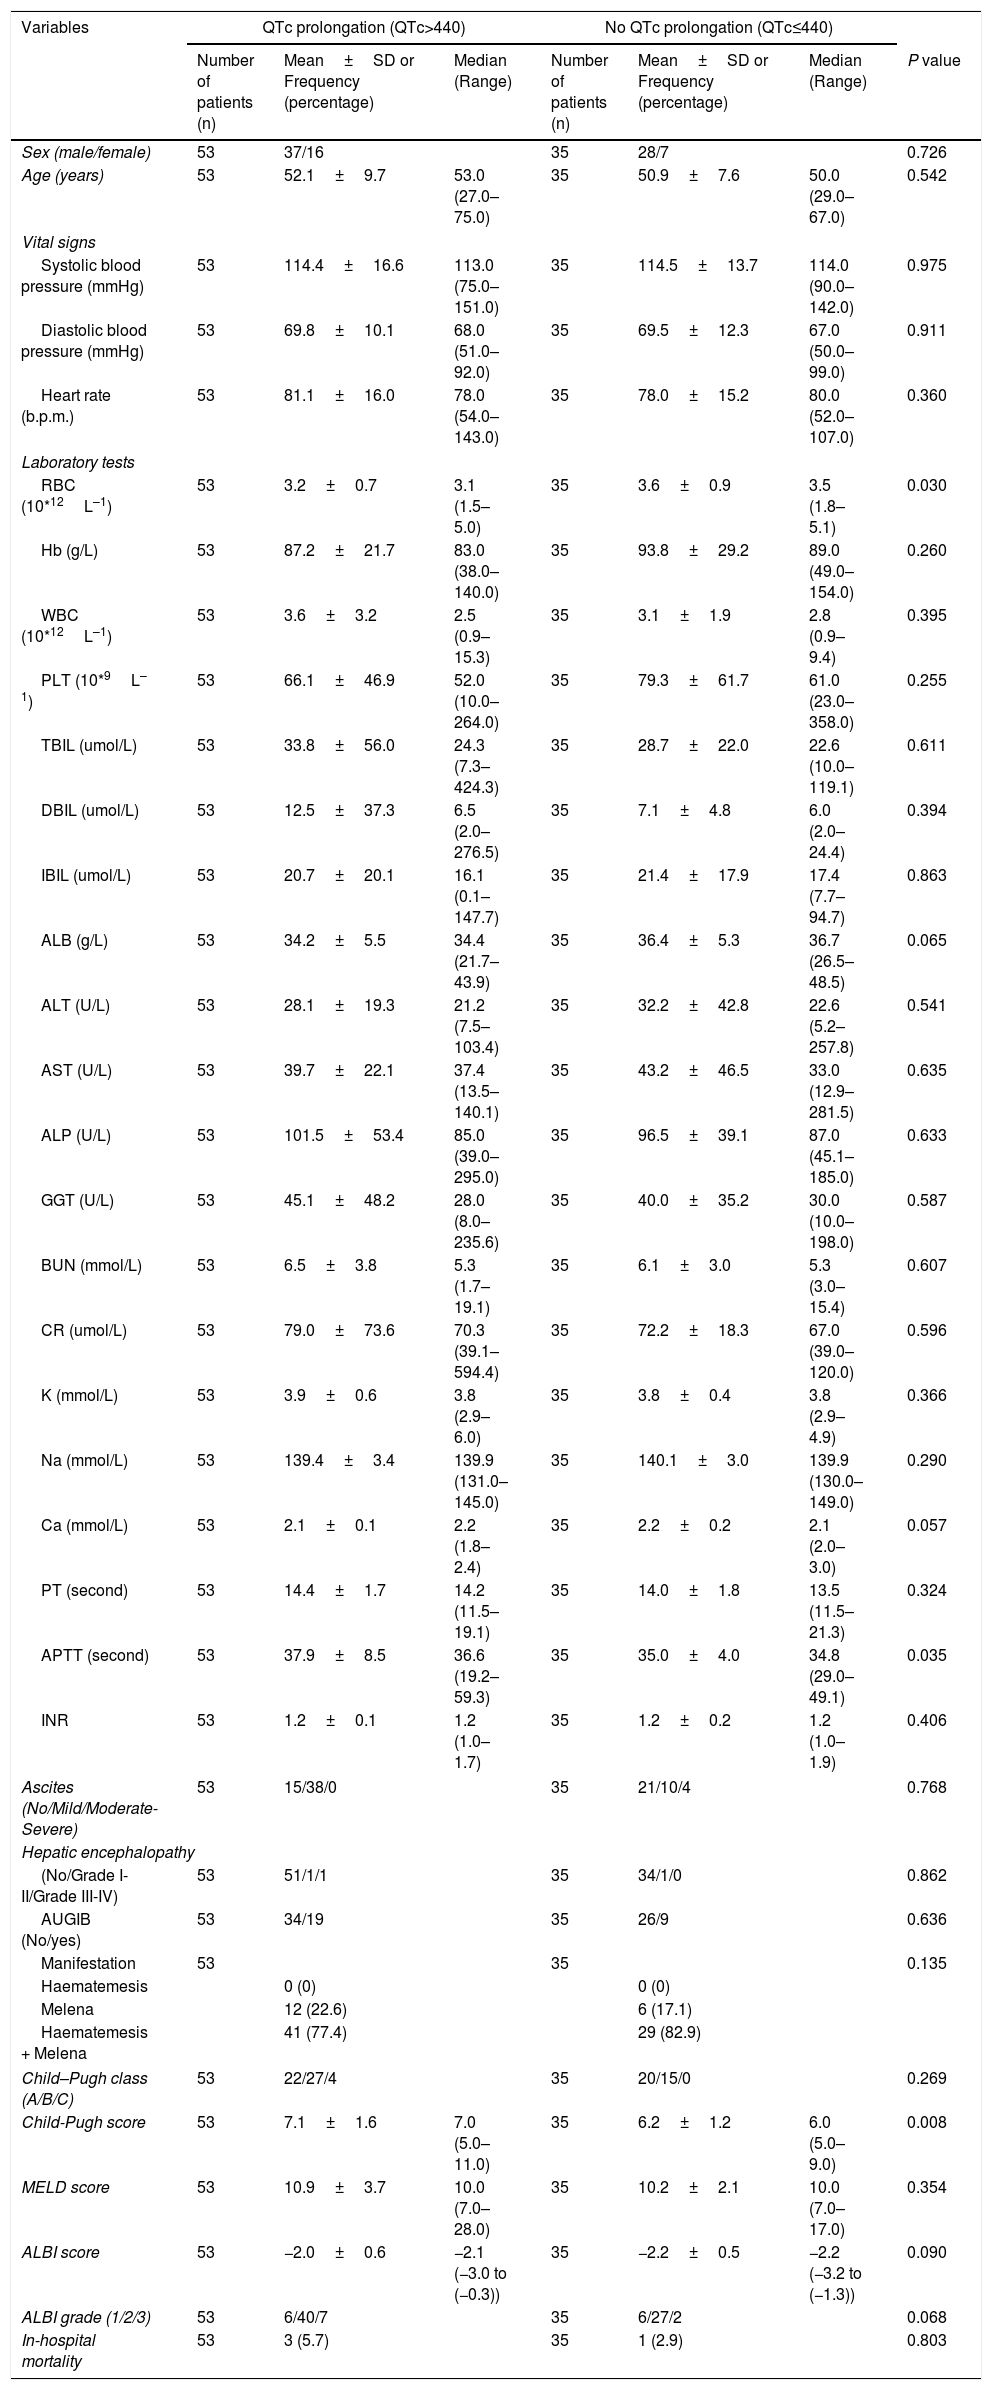
Eighty-eight patients infected with HBV, and we also compared the characteristics of patients with HBV (Table 4). Results showed that RBC was significantly lower, APTT and Child–Pugh were significantly higher in patients with QTc interval prolongation. In the ROC analysis, AUROC of QTc was 0.722 (95%CI: 0.616–0.812). QTc had a cut-off value of 465 with sensitivity of 75.0% specificity 73.8% (Fig. 4).
Comparative data of patients with HBV.
| Variables | QTc prolongation (QTc>440) | No QTc prolongation (QTc≤440) | |||||
|---|---|---|---|---|---|---|---|
| Number of patients (n) | Mean±SD or Frequency (percentage) | Median (Range) | Number of patients (n) | Mean±SD or Frequency (percentage) | Median (Range) | P value | |
| Sex (male/female) | 53 | 37/16 | 35 | 28/7 | 0.726 | ||
| Age (years) | 53 | 52.1±9.7 | 53.0 (27.0–75.0) | 35 | 50.9±7.6 | 50.0 (29.0–67.0) | 0.542 |
| Vital signs | |||||||
| Systolic blood pressure (mmHg) | 53 | 114.4±16.6 | 113.0 (75.0–151.0) | 35 | 114.5±13.7 | 114.0 (90.0–142.0) | 0.975 |
| Diastolic blood pressure (mmHg) | 53 | 69.8±10.1 | 68.0 (51.0–92.0) | 35 | 69.5±12.3 | 67.0 (50.0–99.0) | 0.911 |
| Heart rate (b.p.m.) | 53 | 81.1±16.0 | 78.0 (54.0–143.0) | 35 | 78.0±15.2 | 80.0 (52.0–107.0) | 0.360 |
| Laboratory tests | |||||||
| RBC (10*12L–1) | 53 | 3.2±0.7 | 3.1 (1.5–5.0) | 35 | 3.6±0.9 | 3.5 (1.8–5.1) | 0.030 |
| Hb (g/L) | 53 | 87.2±21.7 | 83.0 (38.0–140.0) | 35 | 93.8±29.2 | 89.0 (49.0–154.0) | 0.260 |
| WBC (10*12L–1) | 53 | 3.6±3.2 | 2.5 (0.9–15.3) | 35 | 3.1±1.9 | 2.8 (0.9–9.4) | 0.395 |
| PLT (10*9L–1) | 53 | 66.1±46.9 | 52.0 (10.0–264.0) | 35 | 79.3±61.7 | 61.0 (23.0–358.0) | 0.255 |
| TBIL (umol/L) | 53 | 33.8±56.0 | 24.3 (7.3–424.3) | 35 | 28.7±22.0 | 22.6 (10.0–119.1) | 0.611 |
| DBIL (umol/L) | 53 | 12.5±37.3 | 6.5 (2.0–276.5) | 35 | 7.1±4.8 | 6.0 (2.0–24.4) | 0.394 |
| IBIL (umol/L) | 53 | 20.7±20.1 | 16.1 (0.1–147.7) | 35 | 21.4±17.9 | 17.4 (7.7–94.7) | 0.863 |
| ALB (g/L) | 53 | 34.2±5.5 | 34.4 (21.7–43.9) | 35 | 36.4±5.3 | 36.7 (26.5–48.5) | 0.065 |
| ALT (U/L) | 53 | 28.1±19.3 | 21.2 (7.5–103.4) | 35 | 32.2±42.8 | 22.6 (5.2–257.8) | 0.541 |
| AST (U/L) | 53 | 39.7±22.1 | 37.4 (13.5–140.1) | 35 | 43.2±46.5 | 33.0 (12.9–281.5) | 0.635 |
| ALP (U/L) | 53 | 101.5±53.4 | 85.0 (39.0–295.0) | 35 | 96.5±39.1 | 87.0 (45.1–185.0) | 0.633 |
| GGT (U/L) | 53 | 45.1±48.2 | 28.0 (8.0–235.6) | 35 | 40.0±35.2 | 30.0 (10.0–198.0) | 0.587 |
| BUN (mmol/L) | 53 | 6.5±3.8 | 5.3 (1.7–19.1) | 35 | 6.1±3.0 | 5.3 (3.0–15.4) | 0.607 |
| CR (umol/L) | 53 | 79.0±73.6 | 70.3 (39.1–594.4) | 35 | 72.2±18.3 | 67.0 (39.0–120.0) | 0.596 |
| K (mmol/L) | 53 | 3.9±0.6 | 3.8 (2.9–6.0) | 35 | 3.8±0.4 | 3.8 (2.9–4.9) | 0.366 |
| Na (mmol/L) | 53 | 139.4±3.4 | 139.9 (131.0–145.0) | 35 | 140.1±3.0 | 139.9 (130.0–149.0) | 0.290 |
| Ca (mmol/L) | 53 | 2.1±0.1 | 2.2 (1.8–2.4) | 35 | 2.2±0.2 | 2.1 (2.0–3.0) | 0.057 |
| PT (second) | 53 | 14.4±1.7 | 14.2 (11.5–19.1) | 35 | 14.0±1.8 | 13.5 (11.5–21.3) | 0.324 |
| APTT (second) | 53 | 37.9±8.5 | 36.6 (19.2–59.3) | 35 | 35.0±4.0 | 34.8 (29.0–49.1) | 0.035 |
| INR | 53 | 1.2±0.1 | 1.2 (1.0–1.7) | 35 | 1.2±0.2 | 1.2 (1.0–1.9) | 0.406 |
| Ascites (No/Mild/Moderate-Severe) | 53 | 15/38/0 | 35 | 21/10/4 | 0.768 | ||
| Hepatic encephalopathy | |||||||
| (No/Grade I-II/Grade III-IV) | 53 | 51/1/1 | 35 | 34/1/0 | 0.862 | ||
| AUGIB (No/yes) | 53 | 34/19 | 35 | 26/9 | 0.636 | ||
| Manifestation | 53 | 35 | 0.135 | ||||
| Haematemesis | 0 (0) | 0 (0) | |||||
| Melena | 12 (22.6) | 6 (17.1) | |||||
| Haematemesis + Melena | 41 (77.4) | 29 (82.9) | |||||
| Child–Pugh class (A/B/C) | 53 | 22/27/4 | 35 | 20/15/0 | 0.269 | ||
| Child-Pugh score | 53 | 7.1±1.6 | 7.0 (5.0–11.0) | 35 | 6.2±1.2 | 6.0 (5.0–9.0) | 0.008 |
| MELD score | 53 | 10.9±3.7 | 10.0 (7.0–28.0) | 35 | 10.2±2.1 | 10.0 (7.0–17.0) | 0.354 |
| ALBI score | 53 | −2.0±0.6 | −2.1 (−3.0 to (−0.3)) | 35 | −2.2±0.5 | −2.2 (−3.2 to (−1.3)) | 0.090 |
| ALBI grade (1/2/3) | 53 | 6/40/7 | 35 | 6/27/2 | 0.068 | ||
| In-hospital mortality | 53 | 3 (5.7) | 35 | 1 (2.9) | 0.803 | ||
Abbreviations: ACLF, acute-on-chronic liver failure; ALB, albumin; ALP, alkaline phosphatase; ALT, alanine aminotransferase; APTT, activated partial thromboplastin time; AST, aspartate aminotransferase; AUGIB, acute upper gastrointestinal bleeding; BUN, blood urea nitrogen; Ca, calcium; CR, creatinine; DBIL, direct bilirubin; GGT, gamma-glutamyl transpeptidase; HBV, hepatitis B virus; IBIL, indirect bilirubin; INR, international normalized ratio; K, kalium; MELD, Model for End-Stage Liver Diseases; Na, natrium; PBC, primary biliary cirrhosis; PLT, platelet; PT, prothrombin time; QTc, QT interval corrected by heart rate; RBC, red blood count; SD, standard deviation; TBIL, total bilirubin; WBC, white blood count.

As we all know, this is the first study to explore the role of QTc interval prolongation in patients with UGIB. Our study found that QTc interval prolongation was prevalent in patients with liver cirrhosis suffered UGIB, and it was associated with the severity of liver function, RBC, ALB, Ca, DBIL, GGT, APTT level and HE. QTc had the highest AUROC in predicting in-hospital mortality of HBV subgroup and the lowest of acute UGIB subgroup. Patients with prolonged QTc interval had higher in-hospital mortality. However, the difference was not statistically significant between patients with and without QT interval prolongation.
Prolonged QT interval has been found correlated with portal hypertension, acute UGIB, ascites and myocardial dysfunction, and this may explain our study found it was positively related with RBC.12 Prolonged QTc interval may be improved after liver transplantation or use of non-selective beta-blockers.5,13,14 QT interval may be influenced by some factors such as serum electrolytes and diuretic treatment.15–17 Our study showed that Ca level was negatively correlated with QT interval prolongation. Genovesi et al. also proposed that reduction of Ca level might be associated with QT interval prolongation.18 ALB was also decreased in QT interval prolongation group. The result was similar with the study by Zhao et al.19
Previous studies have evaluated the correlation of QTc interval prolongation with liver diseases. Trevisani et al. explored the QTc interval prolongation in cirrhotic and non-cirrhotic patients with acute gastrointestinal bleeding (AGIB). Patients were assessed before bleeding (T0), at the time of bleeding (T1), and 6 weeks afterwards (T2). In cirrhotic patients’ group, QTc length and long QTc prevalence at T1 in patients who died were significantly higher than survivors (476.1±7.8 versus 445.7±4.7, P=0.001), (72.7% versus 31.4%, P=0.005, respectively). However, QTc was not significantly different between T0, T1 and T2 in non-cirrhotic group. In multivariate analysis, QTc was independently associated with 6-week mortality (hazard ratio=1.025, 95%CI: 1.001–1.039, P<0.001). The cut-off value for QTc was 460 and AUROC was 0.75 (95%CI: 0.63–0.85). The results were similar with our study.11 Hajiaghamohammadi et al. conducted a case-control study to assess the QT interval prolongation in cirrhotic and non-cirrhotic patients. QTc was longer in cirrhotic patients than non-cirrhotic patients, and QTc was significantly associated with Child–Pugh.20 Biselli et al. evaluated cirrhotic patients with AGIB and proposed that prognostic score of mortality incorporated QTc would increase the accuracy.8
A single center study performed by Glowczynska et al. aimed to explore patients with end-stage liver disease waiting for orthotropic liver transplantation (OLTx). QTc interval in patients with alcoholic was higher than those with hepatitis and other etiologies (394, 380, and 370, P=0.017). QTc interval in patients with ascites and HE was higher than those without (394 versus 374, P=0.015; 390 versus 375, P=0.05, respectively). Patients with gastroesophageal varices also had higher QTc interval than those without but not significantly different between two groups (385 versus 377, P=0.29). There was no significantly difference of QTc between survivors and non-survivors.9 Kim et al. also assessed the correlation with QT prolongation and liver cirrhosis. QT prolongation was significantly associated with mortality (odds ratio=1.69, 95%CI: 1.03–2.77, P=0.039).10
Some limitations in our study should be mentioned. First, this was a retrospective study that bias of patient selection would not be avoided. Second, the number of patients underwent 12-lead electrocardiogram tests was relatively less that would make results of less accuracy. Third, causes of UGIB was not provided, the results might be more reliable if we divided patients into subgroups. Fourth, long-term prognosis was not assessed thus the correlation of QTc interval with long-term prognosis was not evaluated.
ConclusionsQTc interval prolongation was prevalent in cirrhotic patients with UGIB. QTc interval prolongation was correlated with liver dysfunction. QTc might not be a valid predictor of in-hospital mortality in cirrhotic patients with UGIB. In the future, multicenter, prospective and well-designed study should be proposed to explore the role of QTc interval in patients with liver cirrhosis.
FundingThis research did not receive any specific grant from funding agencies in the public, commercial, or not-for-profit sectors.
Author contributionsYing Peng: designed the study, reviewed the literature, collected the data, performed the statistical analysis, interpreted the data, and draft the manuscript. Min Ou: collected the data, performed the statistical analysis, interpreted the data, and drafted the manuscript. Yin Tian and Guoqiang Zhuang gave critical comments and revised the manuscript. All authors have made an intellectual contribution to the manuscript and approved the submission.
Conflict of interestsNone declared.
