


There is growing evidence regarding the imaging findings of coronavirus disease 2019 (COVID-19) in chest X-rays and computed tomography scans; however, their availability during this pandemic outbreak might be compromised. Currently, the role of point-of-care ultrasonography (POCUS) has yet to be explored.
ObjectivesTo describe the POCUS findings of COVID-19 in patients with the disease admitted to the emergency department (ED), correlating them with vital signs, laboratory and radiologic results, therapeutic decisions, and the prognosis.
MethodsProspective study performed in the ED of 2 academic hospitals. Patients with highly suspected or confirmed COVID-19 underwent a lung ultrasonography (lung POCUS), focused cardiac ultrasound (FOCUS), and inferior vena cava (IVC) exam.
ResultsBetween March and April 2020, 96 patients were enrolled. The mean age was 68.2 years (SD 17.5). The most common findings in the lung POCUS were an irregular pleural line (63.2%), bilateral confluence (55.2%), and isolated B-lines (53.1%), which were associated with a positive RT-PCR (odds ratio 4.327; 95% CI 1.216–15.401; p<.001), and correlated with IL-6 levels (rho=0.622; p=.002). The IVC negatively correlated with levels of expiratory pO2 (rho=−0.539; p=.014) and inspiratory pO2 (rho=−0.527; p=0.017), and expiratory diameter positively correlated with troponin I (rho=0.509; p=.03). After the POCUS exam, almost 20% of the patients had an associated condition that required a change in their treatment or management.
ConclusionsPOCUS parameters have the potential to impact the diagnosis, management, and prognosis of patients with confirmed or suspected COVID-19.
Existe una evidencia creciente con respecto a los hallazgos por imagen de la COVID-19, tanto en radiografías de tórax como en tomografía computarizada; sin embargo, la disponibilidad de estas técnicas durante la pandemia podría verse comprometida.
ObjetivosDescribir los hallazgos en la ecografía en el punto de atención (POCUS) en pacientes con COVID-19 que consultaron en el servicio de urgencias (SU), correlacionándolos con signos vitales, resultados analíticos y radiológicos, decisiones terapéuticas y pronóstico.
MétodosEstudio prospectivo realizado en los SU de dos hospitales académicos. Los pacientes con COVID-19 con alta sospecha o confirmada se sometieron a una ecografía pulmonar (POCUS pulmonar), una ecocardioscopia y una ecografía de la vena cava inferior (VCI).
ResultadosEntre marzo y abril del 2020, se reclutaron 96 pacientes. La edad media fue de 68,2 años (DE 17,5). Los hallazgos más comunes en el POCUS pulmonar fueron la línea pleural irregular (63,2%), las líneas B confluyentes bilateral (55,2%) y aisladas (53,1%), que se vincularon con una RT-PCR (odds ratio 4,327; IC 95% 1,216 a 15,401; p < 0,001), y se asoció con los niveles de interleucina-6 (IL-6) (ρ = 0,622; p = 0,002). La VCI se correlacionó negativamente con los niveles de pO2 espiratorio (ρ = − 0,539; p = 0,014) y pO2 inspiratorio (ρ = − 0,527; p = 0,017), y el diámetro espiratorio se relacionó positivamente con la troponina I (ρ = 0,509; p = 0, 03). Después del examen POCUS, casi el 20% de los pacientes tenían una condición asociada que requería un cambio en el tratamiento o manejo previo.
ConclusionesLos parámetros POCUS tienen el potencial de afectar el diagnóstico, manejo y pronóstico de pacientes con sospecha o confirmación de COVID-19.
On March 11, 2020, the World Health Organization declared a pandemic caused by a novel coronavirus, named Severe Acute Respiratory Syndrome Coronavirus 2 (SARS-CoV-2), spreading to more than 180 countries,1 with 37,418,821 confirmed cases and 1,076,818 deaths.2
Coronavirus disease 2019 (COVID-19) is a highly contagious illness caused by infection with SARS-CoV-2. In this emergency, the ability to quickly characterize a confirmed or suspected case is critical, given almost any emergency department will struggle to keep up with the increasing number of patients and the shortage of health resources.
The primary diagnostic method is reverse transcription polymerase chain reaction (RT-PCR) of the nucleic acid of SARS-CoV-2 in nasopharyngeal swabs.3 However, it has many limitations, such as low sensitivity and the technical difficulties associated with performing it.4
Various studies have suggested that abnormalities as shown on computed tomography (CT) are highly sensitive for diagnosis of patients with COVID-19, and should be considered as a screening tool.4 Moreover, various clinical, laboratory, and imaging parameters have been associated with prognosis5 and have been used to guide therapy.6
However, because these diagnostic, laboratory, and therapeutic resources might not be ubiquitously available, we need alternative modalities to more rapidly characterize our patients.
Point-of-care ultrasonography (POCUS) is ubiquitous and quickly performed following simple and easy to apply protocols5; therefore, it can be performed in mild or even unstable patients, in various settings. The presence of subpleural consolidations, thickened pleural lines, and B-lines are highly specific for lung involvement affecting the interstitium (interstitial syndrome), which in these cases suggests the presence of COVID-19 pneumonia.7–9
The role and impact of this technique in this pandemic has not yet been explored.
Patients and methodsThis was a prospective study performed in the emergency department (ED) of 2 academic hospitals, conducted in accordance with the Declaration of Helsinki, and approved by the Research Ethics Committee of each University Hospital involved. Informed consent was obtained from each enrolled patient.
Patient selectionPatients admitted to the ED with a clinical suspicion of COVID-19 (temperature above 37.2°C, acute respiratory symptoms, gastrointestinal symptoms, or fatigue) requiring X-ray for evaluation were included. We excluded patients<18 years or those who declined to participate. A convenience sample of patients who met these inclusion criteria were consecutively enrolled and prospectively studied.
Patients were followed-up the following week, either during hospitalization or after hospital discharge, as appropriate.
Initial patient assessmentThe initial evaluation of the patients included recording their medical history (demographic data, comorbidities, medications); symptoms; physical exam (temperature, blood pressure, heart rate, respiratory rate, and oxygen saturation); chest X-ray; and laboratory tests (hemogram, basic metabolic panel [e.g., glucose, electrolytes, kidney function, liver enzymes], lactate dehydrogenase [LDH], ferritin, interleukin-6 [IL-6], C-reactive protein [CRP], procalcitonin, blood gases [lactate and pH], and coagulation [D-dimer, international normalized ratio, partial thromboplastin time, fibrinogen]).
Two radiologist trainees with 2–4 years of experience reviewed and informed all chest X-ray under the supervision of a senior radiologist with more than 10 years of experience.
Ultrasound data collectionTwo ultrasound fellowship-trained emergency physicians (experienced sonologists according to the American College of Emergency Physicians ultrasonographic guidelines, with more than 10 ultrasound exams performed per week, and 5 years of experience in performing and interpreting POCUS)10 performed all the ultrasound exams. Therefore, an opportunity sampling method was implemented for patient selection.
Participants underwent ultrasonographic measurement of the inferior vena cava (IVC) and a focused cardiac ultrasound (FOCUS). A lung ultrasonography (LUS) was performed following a 12-zone protocol.11 Each intercostal space of the upper and lower parts of the anterior, lateral, and posterior regions of the left and right chest wall was carefully examined. Findings were defined and recorded as follows7,12 (Fig. 1):
- -
A-lines: horizontal reverberation artifacts parallel to the pleural line.
- -
Pleural effusion: a typically anechoic space between the parietal and visceral pleura.
- -
B-lines: hyperechoic vertical artifacts that arise from the pleural line, extending to the bottom of the screen without fading that erases the A-line artifact.
- ∘
Confluent B-lines: multiple converging or coalescent B-lines.
- ∘
Isolated B-lines: discrete, well demarcated B-lines.
- ∘
- -
Irregular pleural line: indented or broken pleural line.
- -
Small consolidations: consolidations (hypoechoic areas) smaller than 1cm in diameter, surrounded by a hyperechoic artifact tail.
- -
Lobar consolidations: larger (over 1cm) consolidation areas with or without the presence of air bronchograms.
. A-lines: horizontal reverberation artifacts parallel to the pleural line (A); B-lines: hyperechoic vertical artifacts that arise from the pleural line, extending to the bottom of the screen without fading that erases the A-line artifact, that can converge (B) or be well demarcated (C); Irregular pleural line: indented or broken pleural line (D); Consolidations: subpleural hypoechoic areas surrounded by a hyperechoic artifact tail (E); Pleural effusion: anechoic space between the parietal and visceral pleura (F).")
Lung ultrasound showing the different signs (white arrow). A-lines: horizontal reverberation artifacts parallel to the pleural line (A); B-lines: hyperechoic vertical artifacts that arise from the pleural line, extending to the bottom of the screen without fading that erases the A-line artifact, that can converge (B) or be well demarcated (C); Irregular pleural line: indented or broken pleural line (D); Consolidations: subpleural hypoechoic areas surrounded by a hyperechoic artifact tail (E); Pleural effusion: anechoic space between the parietal and visceral pleura (F).
A compatible LUS exam was considered a bilateral pattern of B-lines, isolated or confluent, irregular pleural lines, and/or subpleural consolidations.
The examinations were performed using a GE LOGIQ e ultrasound system fitted with a phased and curvilinear array transducer (1.5–4.5MHz) (General Electrics Healthcare, Madrid, Spain) as a cart-based device, and a Butterfly IQ (Butterfly Network, Guilford, CT, USA) as a hand-held device.
The two sonographers were blinded to the patient's past medical history, vital signs, symptoms, laboratory measurements and therapy. The results of the ultrasound were recorded in the patient's medical history, and this information was available to the treating physician, who adjusted the therapy based on these findings.
Outcome measures and definitionsThe main purpose of this study was to describe and characterize the POCUS findings of the disease in patients with COVID-19 admitted to the ED. The primary outcome was to determine the impact of POCUS parameters on the prognosis of patients with highly suspected or confirmed COVID-19. The secondary outcome was to correlate these parameters with the physical exam, laboratory markers, and chest X-ray.
We defined a confirmed case as any patient with clinical symptoms and positive RT-PCR, and a high suspicion case as any patient with negative RT-PCR but compatible clinical symptoms and typical X-ray, CT scan, or lung POCUS.
Statistical analysisBaseline characteristics are presented as mean and standard deviation (SD) for continuous variables and count and proportions for categorical variables. For group comparisons, we used a t-test for continuous variables and the chi-squared or Fisher's exact test for categorical variables. The correlations between continuous variables were tested using Spearman's rho test for categorical variables. Mean values were reported, along with 95% confidence intervals (CIs). Statistical significance was set at p<.05.
Statistical analyses were conducted with IBM SPSS software v20.0 (SPSS Inc., Chicago, IL, USA).
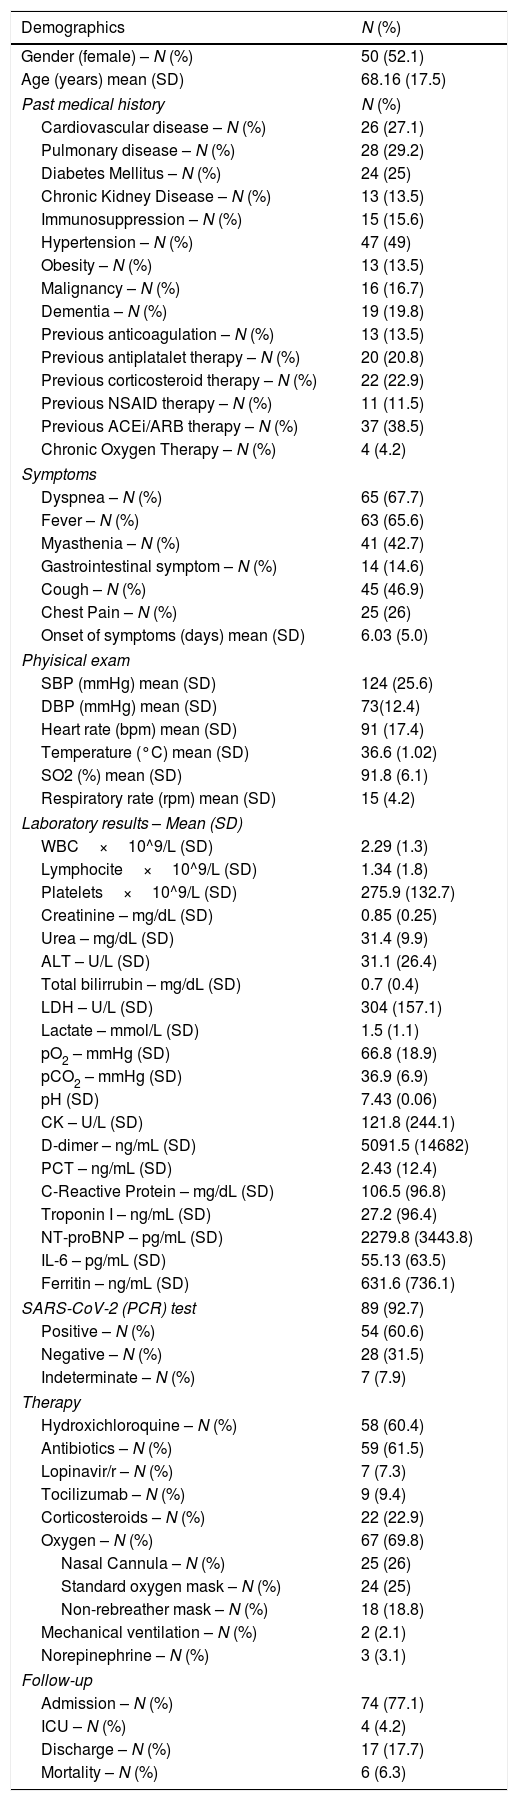
ResultsA total of 96 patients were enrolled between March and April 2020 (summarized in Table 1 and Fig. 2). The mean age was 68.2 years (SD 17.5), and 50 (52.1%) patients were women. Nearly half (47 [49%]) of the patients had hypertension, most receiving angiotensin-converting-enzyme inhibitors or angiotensin receptor blocker therapy. The most common presenting symptom was dyspnea (67.7%) and fever (65.6%), and the mean onset of symptoms was 6 days (SD 5.0). The patients were normotensive and had low oxygen saturation (91.8%, SD 6.1), with a respiratory rate of 15rpm (SD 4.2), and many needed supplemental oxygen (69.7%). The mean lymphocyte count was 1.34×10⁹ (SD 1.8), CRP was 106.5 (96.8%), and LDH was 304U/L (SD 157.1) at admission. The main therapy was hydroxychloroquine (50 patients, 60.4%).
Demographics and clinical characteristics of patients included (N=96).
| Demographics | N (%) |
|---|---|
| Gender (female) – N (%) | 50 (52.1) |
| Age (years) mean (SD) | 68.16 (17.5) |
| Past medical history | N (%) |
| Cardiovascular disease – N (%) | 26 (27.1) |
| Pulmonary disease – N (%) | 28 (29.2) |
| Diabetes Mellitus – N (%) | 24 (25) |
| Chronic Kidney Disease – N (%) | 13 (13.5) |
| Immunosuppression – N (%) | 15 (15.6) |
| Hypertension – N (%) | 47 (49) |
| Obesity – N (%) | 13 (13.5) |
| Malignancy – N (%) | 16 (16.7) |
| Dementia – N (%) | 19 (19.8) |
| Previous anticoagulation – N (%) | 13 (13.5) |
| Previous antiplatalet therapy – N (%) | 20 (20.8) |
| Previous corticosteroid therapy – N (%) | 22 (22.9) |
| Previous NSAID therapy – N (%) | 11 (11.5) |
| Previous ACEi/ARB therapy – N (%) | 37 (38.5) |
| Chronic Oxygen Therapy – N (%) | 4 (4.2) |
| Symptoms | |
| Dyspnea – N (%) | 65 (67.7) |
| Fever – N (%) | 63 (65.6) |
| Myasthenia – N (%) | 41 (42.7) |
| Gastrointestinal symptom – N (%) | 14 (14.6) |
| Cough – N (%) | 45 (46.9) |
| Chest Pain – N (%) | 25 (26) |
| Onset of symptoms (days) mean (SD) | 6.03 (5.0) |
| Phyisical exam | |
| SBP (mmHg) mean (SD) | 124 (25.6) |
| DBP (mmHg) mean (SD) | 73(12.4) |
| Heart rate (bpm) mean (SD) | 91 (17.4) |
| Temperature (°C) mean (SD) | 36.6 (1.02) |
| SO2 (%) mean (SD) | 91.8 (6.1) |
| Respiratory rate (rpm) mean (SD) | 15 (4.2) |
| Laboratory results – Mean (SD) | |
| WBC×10^9/L (SD) | 2.29 (1.3) |
| Lymphocite×10^9/L (SD) | 1.34 (1.8) |
| Platelets×10^9/L (SD) | 275.9 (132.7) |
| Creatinine – mg/dL (SD) | 0.85 (0.25) |
| Urea – mg/dL (SD) | 31.4 (9.9) |
| ALT – U/L (SD) | 31.1 (26.4) |
| Total bilirrubin – mg/dL (SD) | 0.7 (0.4) |
| LDH – U/L (SD) | 304 (157.1) |
| Lactate – mmol/L (SD) | 1.5 (1.1) |
| pO2 – mmHg (SD) | 66.8 (18.9) |
| pCO2 – mmHg (SD) | 36.9 (6.9) |
| pH (SD) | 7.43 (0.06) |
| CK – U/L (SD) | 121.8 (244.1) |
| D-dimer – ng/mL (SD) | 5091.5 (14682) |
| PCT – ng/mL (SD) | 2.43 (12.4) |
| C-Reactive Protein – mg/dL (SD) | 106.5 (96.8) |
| Troponin I – ng/mL (SD) | 27.2 (96.4) |
| NT-proBNP – pg/mL (SD) | 2279.8 (3443.8) |
| IL-6 – pg/mL (SD) | 55.13 (63.5) |
| Ferritin – ng/mL (SD) | 631.6 (736.1) |
| SARS-CoV-2 (PCR) test | 89 (92.7) |
| Positive – N (%) | 54 (60.6) |
| Negative – N (%) | 28 (31.5) |
| Indeterminate – N (%) | 7 (7.9) |
| Therapy | |
| Hydroxichloroquine – N (%) | 58 (60.4) |
| Antibiotics – N (%) | 59 (61.5) |
| Lopinavir/r – N (%) | 7 (7.3) |
| Tocilizumab – N (%) | 9 (9.4) |
| Corticosteroids – N (%) | 22 (22.9) |
| Oxygen – N (%) | 67 (69.8) |
| Nasal Cannula – N (%) | 25 (26) |
| Standard oxygen mask – N (%) | 24 (25) |
| Non-rebreather mask – N (%) | 18 (18.8) |
| Mechanical ventilation – N (%) | 2 (2.1) |
| Norepinephrine – N (%) | 3 (3.1) |
| Follow-up | |
| Admission – N (%) | 74 (77.1) |
| ICU – N (%) | 4 (4.2) |
| Discharge – N (%) | 17 (17.7) |
| Mortality – N (%) | 6 (6.3) |
ACEi: Angiotensin-converting-enzyme inhibitors. ARB: Angiotensin receptor blockers; CK: creatine kinase; IL-6: Interleukin 6; LDH: Lactate dehydrogenase; NT-ProBNP: N-terminal pro-brain natriuretic peptide; PCR: Polymerase chain reaction; PCT: procalcitonin; SD: standard deviation.
The role of point-of-care ultrasonography in the initial characterization of patients with COVID-19: Results from a prospective multicentric study.

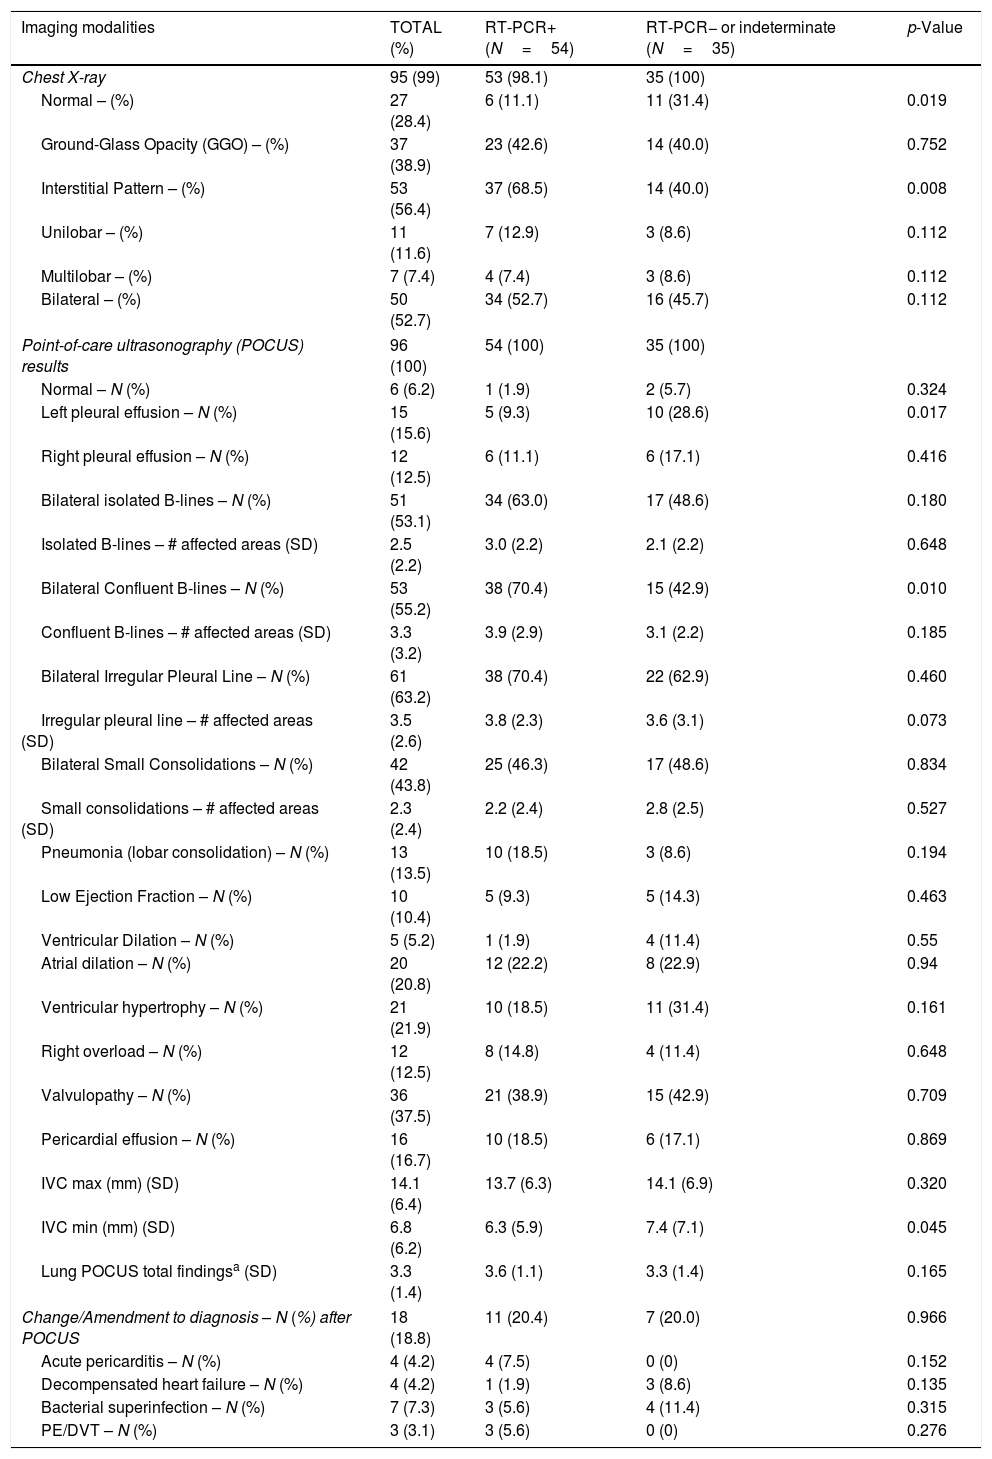
All the included patients underwent a POCUS study, and almost all of them had a chest X-ray (see Table 2).
Imaging modalities (Chest X-ray and Point-of-Care Ultrasound) findings of patients included (N=96), with or without positive test on RT-PCR. RT-PCR not performed in 7 patients.
| Imaging modalities | TOTAL (%) | RT-PCR+ (N=54) | RT-PCR− or indeterminate (N=35) | p-Value |
|---|---|---|---|---|
| Chest X-ray | 95 (99) | 53 (98.1) | 35 (100) | |
| Normal – (%) | 27 (28.4) | 6 (11.1) | 11 (31.4) | 0.019 |
| Ground-Glass Opacity (GGO) – (%) | 37 (38.9) | 23 (42.6) | 14 (40.0) | 0.752 |
| Interstitial Pattern – (%) | 53 (56.4) | 37 (68.5) | 14 (40.0) | 0.008 |
| Unilobar – (%) | 11 (11.6) | 7 (12.9) | 3 (8.6) | 0.112 |
| Multilobar – (%) | 7 (7.4) | 4 (7.4) | 3 (8.6) | 0.112 |
| Bilateral – (%) | 50 (52.7) | 34 (52.7) | 16 (45.7) | 0.112 |
| Point-of-care ultrasonography (POCUS) results | 96 (100) | 54 (100) | 35 (100) | |
| Normal – N (%) | 6 (6.2) | 1 (1.9) | 2 (5.7) | 0.324 |
| Left pleural effusion – N (%) | 15 (15.6) | 5 (9.3) | 10 (28.6) | 0.017 |
| Right pleural effusion – N (%) | 12 (12.5) | 6 (11.1) | 6 (17.1) | 0.416 |
| Bilateral isolated B-lines – N (%) | 51 (53.1) | 34 (63.0) | 17 (48.6) | 0.180 |
| Isolated B-lines – # affected areas (SD) | 2.5 (2.2) | 3.0 (2.2) | 2.1 (2.2) | 0.648 |
| Bilateral Confluent B-lines – N (%) | 53 (55.2) | 38 (70.4) | 15 (42.9) | 0.010 |
| Confluent B-lines – # affected areas (SD) | 3.3 (3.2) | 3.9 (2.9) | 3.1 (2.2) | 0.185 |
| Bilateral Irregular Pleural Line – N (%) | 61 (63.2) | 38 (70.4) | 22 (62.9) | 0.460 |
| Irregular pleural line – # affected areas (SD) | 3.5 (2.6) | 3.8 (2.3) | 3.6 (3.1) | 0.073 |
| Bilateral Small Consolidations – N (%) | 42 (43.8) | 25 (46.3) | 17 (48.6) | 0.834 |
| Small consolidations – # affected areas (SD) | 2.3 (2.4) | 2.2 (2.4) | 2.8 (2.5) | 0.527 |
| Pneumonia (lobar consolidation) – N (%) | 13 (13.5) | 10 (18.5) | 3 (8.6) | 0.194 |
| Low Ejection Fraction – N (%) | 10 (10.4) | 5 (9.3) | 5 (14.3) | 0.463 |
| Ventricular Dilation – N (%) | 5 (5.2) | 1 (1.9) | 4 (11.4) | 0.55 |
| Atrial dilation – N (%) | 20 (20.8) | 12 (22.2) | 8 (22.9) | 0.94 |
| Ventricular hypertrophy – N (%) | 21 (21.9) | 10 (18.5) | 11 (31.4) | 0.161 |
| Right overload – N (%) | 12 (12.5) | 8 (14.8) | 4 (11.4) | 0.648 |
| Valvulopathy – N (%) | 36 (37.5) | 21 (38.9) | 15 (42.9) | 0.709 |
| Pericardial effusion – N (%) | 16 (16.7) | 10 (18.5) | 6 (17.1) | 0.869 |
| IVC max (mm) (SD) | 14.1 (6.4) | 13.7 (6.3) | 14.1 (6.9) | 0.320 |
| IVC min (mm) (SD) | 6.8 (6.2) | 6.3 (5.9) | 7.4 (7.1) | 0.045 |
| Lung POCUS total findingsa (SD) | 3.3 (1.4) | 3.6 (1.1) | 3.3 (1.4) | 0.165 |
| Change/Amendment to diagnosis – N (%) after POCUS | 18 (18.8) | 11 (20.4) | 7 (20.0) | 0.966 |
| Acute pericarditis – N (%) | 4 (4.2) | 4 (7.5) | 0 (0) | 0.152 |
| Decompensated heart failure – N (%) | 4 (4.2) | 1 (1.9) | 3 (8.6) | 0.135 |
| Bacterial superinfection – N (%) | 7 (7.3) | 3 (5.6) | 4 (11.4) | 0.315 |
| PE/DVT – N (%) | 3 (3.1) | 3 (5.6) | 0 (0) | 0.276 |
DVT: deep vein thrombosis; GGO: Ground-Glass Opacity; IVC: inferior vena cava; pulmonary embolism; POCUS: point-of-care ultrasonography; SD: standard deviation.
The most frequent pattern in the chest X-ray was an interstitial pattern (56.4%), and more than one-third had ground-glass opacities (GGOs). Almost 30% of them had a normal chest X-ray.
Regarding the lung POCUS, the most common finding was an irregular pleural line (63.2%), followed by bilateral confluent (55.2%) and isolated B-lines (53.1%). Four patients had a completely normal lung ultrasound, whereas 22 (23%) patients had pleural effusion. The expiratory and inspiratory average diameters of the IVC were 14.1 (6.4) and 6.8 (6.2) mm, respectively. The FOCUS revealed a low ejection fraction in 10 patients.
After the POCUS exam, almost 20% of the patients had an associated condition that required a change in their treatment or management.
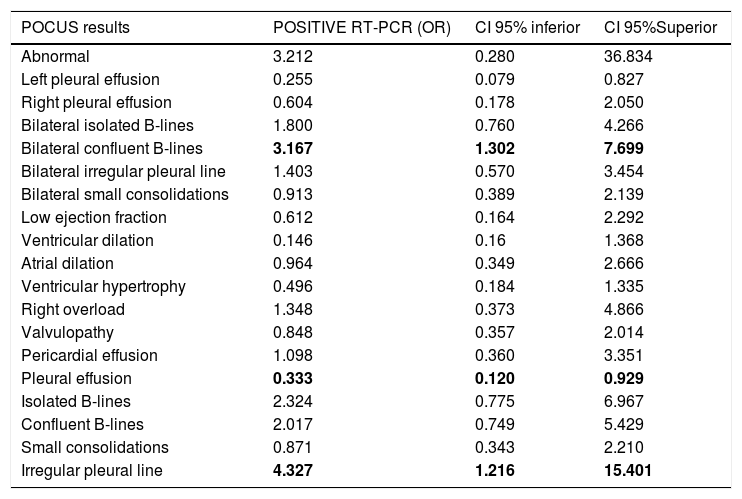
Correlation of POCUS and RT-PCR of SARS-CoV-2The presence of irregular pleural line (see Table 3) was associated with a positive RT-PCR (odds ratio [OR] 4.327; 95% CI 1.216–11.246; p<.001), with sensitivity (S) 71.7% specificity (Sp) 65.1%, positive predictive value (PPV) 61.5%, and negative predictive value (NPV) 71.7%. The chest X-ray had S 62.2%, Sp 71.4%, PPV 88.5%, and NPV 34.9% (OR 4.107; 95% CI 1.427–11.818; p=.006).
Correlation of POCUS findings and positive RT-PCR.
| POCUS results | POSITIVE RT-PCR (OR) | CI 95% inferior | CI 95%Superior |
|---|---|---|---|
| Abnormal | 3.212 | 0.280 | 36.834 |
| Left pleural effusion | 0.255 | 0.079 | 0.827 |
| Right pleural effusion | 0.604 | 0.178 | 2.050 |
| Bilateral isolated B-lines | 1.800 | 0.760 | 4.266 |
| Bilateral confluent B-lines | 3.167 | 1.302 | 7.699 |
| Bilateral irregular pleural line | 1.403 | 0.570 | 3.454 |
| Bilateral small consolidations | 0.913 | 0.389 | 2.139 |
| Low ejection fraction | 0.612 | 0.164 | 2.292 |
| Ventricular dilation | 0.146 | 0.16 | 1.368 |
| Atrial dilation | 0.964 | 0.349 | 2.666 |
| Ventricular hypertrophy | 0.496 | 0.184 | 1.335 |
| Right overload | 1.348 | 0.373 | 4.866 |
| Valvulopathy | 0.848 | 0.357 | 2.014 |
| Pericardial effusion | 1.098 | 0.360 | 3.351 |
| Pleural effusion | 0.333 | 0.120 | 0.929 |
| Isolated B-lines | 2.324 | 0.775 | 6.967 |
| Confluent B-lines | 2.017 | 0.749 | 5.429 |
| Small consolidations | 0.871 | 0.343 | 2.210 |
| Irregular pleural line | 4.327 | 1.216 | 15.401 |
CI: Confidence Interval; OR: Odds Ratio; POCUS: point-of-care ultrasonography; RT-PCR: reverse transcription polymerase chain reaction of the nucleic acid of SARS-CoV-2. Bold values denote statistical significance at the p < 0.05 level.
The presence of confluent B-lines was associated with a positive RT-PCR (OR 3.167; 95% CI 1.302–7.699; p=.023), with S 86.8%, Sp 32.6%, PPV 61.3%, and NPV 66.7%. Positive or indeterminate RT-PCR was associated with S 81.7%, Sp 42.9%, PPV 89.3%, and NPV 28.5% (OR 3.350; 95% CI 1.012–11.094; p=.04).
Correlation of POCUS and chest X-rayThe presence of confluent B-lines was associated with pathological findings in the chest X-ray, with S 83.8%, Sp 66.7%, PPV 89.9%, and NPV 53.8% (OR 10.333; 95% CI 3.447–30.976; p<.001). The presence of consolidations (small and lobar) was associated with a pathological X-ray, with S 73%, Sp 61.9%, PPV 87.1%, and NPV 39.4% (OR 4.388; 95% CI 1.583–12.158; p=.003).
Bilateral confluent B-lines were associated with the finding of an interstitial pattern, with S 75.5%, Sp 70.7%, PPV 76.9%, and NPV 69% (OR 2.392; 95% CI 1.012–5.654; p<.001), and GGOs with S 32.4%, Sp 53.4%, NPV 72.1%, and PPV 48.1% (OR 2.392; 95% CI 1.012–5.654; p=.045).
However, we did not find any significant association between isolated B-lines and interstitial pattern (p=.156), GGO (p=0.928), or any pathologic X-ray findings (p=.831).
Correlation of POCUS and laboratory parametersThere was a positive correlation between IL-6 and the number of affected areas on lung POCUS: confluent B-lines (rho=0.622; p=.002) and irregular pleural line (rho=0.509; p=.013). A high IVC inspiratory diameter also correlated with IL-6 (rho=0.550; p=.007); however, a pathologic chest X-ray showed a lower correlation (rho=0.442; p=.035). Other laboratory and inflammatory markers showed a good correlation with IL-6: CRP (rho=0.604; p=.002), procalcitonin (rho=0.504; p=.024), ferritin (rho=0.579; p=.005), AST (rho=0.635; p=.001) and LDH (rho 0.695; p<.001). The highest correlation was found with the respiratory rate (rho=0.789; p<.001) and N-terminal pro B-type natriuretic peptide (rho=0.990; p=.001). These patients were more likely to receive anti-IL-6 therapy (rho=0.612; p=.002).
We found a statistically significant negative correlation of pO2 levels with IVC diameter, both inspiratory (rho=−0.527; p=.017) and expiratory (rho=−0.539; p=.014). The IVC expiratory diameter positively correlated with troponin I levels (rho=0.509; p=.03).
Correlation of POCUS and therapyPatients who showed confluent B-lines were more likely to receive anti-IL-6 therapy (rho=0.206; p=.045), and patients who showed a lobar consolidation were more likely to receive therapy with hydroxychloroquine (rho=0.810; p=.001). Remarkably, this correlation was much lower when small consolidations (rho=252, p=.013) or confluent (rho=0.262; p=.01) or isolated (rho=0.279, p=.006) B-lines were present.
Correlation of POCUS and prognosisAt the end of the first week of follow-up, 6 (6.3%) patients had died and 17 (17.1%) were discharged home. The remaining 73 (76.0%) patients were still hospitalized.
Normal chest X-ray had a weak correlation with ED discharge (rho=0.235; p=.022). Abnormal chest X-ray was not associated with mortality (p=.178) or poor outcome (ICU admission, the need for mechanical ventilation, inotropic drugs or death; p=.115). Normal lung POCUS had a moderate correlation with ED discharge (rho=.444; p<.001). Abnormal lung POCUS findings were not associated with mortality (p=.514) or poor outcome (p=.446).
Patients with comorbid diseases were more prone to have apical lung involvement: hypertension (OR 3.040; 95% CI 1.055–8.762; p=.034), cardiomyopathy (OR 2.917; 95% CI 1.152–7.386; p=.021), and dementia (OR 4.286; 95% CI 1.492-12.310; p=.005). Although the apical lung involvement had a weak correlation with poor outcome (rho=0.217; p=.034), such as mortality or need of mechanical ventilation, it was comparable to lymphocyte count (rho=−0.273; p=.009), creatinine (rho=0.267; p=.011), and procalcitonin (rho=0.367; p=.002).
DiscussionSafety and quality are vital components in an ED patient's management. Many hospitals are struggling to reduce ED overcrowding and to increase patient safety through multimodal interventions on patient flow in the ED, especially with laboratory and diagnostic imaging departments.13
There is growing literature regarding the prognostic factors,5 diagnosis,3,4 and therapeutic challenges6 in patients with COVID-19.
In diagnosis, the sensitivity of RT-PCR for diagnosing SARS-CoV-2 has been quantified as 63% in nasal swab and 32% in pharyngeal swab,14 which is similar to our results; we found a positive rate of only 59.5% in patients with clinical suspicion of COVID-19. Therefore, imaging methods play a key role in the diagnosis and assessment of these patients.
A study of 1049 patients undergoing chest CT scan and RT-PCR testing determined that CT abnormalities had a high sensitivity for diagnosing patients with COVID-19,4 suggesting that a CT scan should be considered as a screening tool, especially in epidemic areas with high pretest probability. However, the use of CT in the ED has many limitations, such as radiation exposure, especially for mild illness, its low availability, and the contraindication for its use in unstable patients.
Therefore, in many centers, CT scans have been replaced by chest X-ray. However, as we have seen, chest X-rays have been shown to have a very low NPV (34.9%). In a study of patients undergoing an initial screening for COVID-19, they found a sensitivity of 25% and a specificity of 90%.15
In our study, we found that of 27 patients with normal chest X-ray, 23 (85.1%) had a pathological POCUS finding. A previous study found that a normal chest X-ray was present in 31% of patients with positive RT-PCR for COVID-19,16 which is similar to our results (28.4%). We hypothesize that this low percentage is due to the low accuracy of X-ray for detecting interstitial abnormalities,5 represented in our study as isolated B-lines on lung POCUS, and becoming apparent on X-ray as the disease progresses, with the appearance of confluent B-lines and other findings.
Similar to our results, a recent prospective study, in which lung POCUS was performed on 84 patients, found that the presence of bilateral B-lines had the highest positive likelihood ratio for the diagnosis of COVID-19 (RT-PCR-positive).17
Our study, in line with early literature, suggests a valuable role for lung POCUS in patients with COVID-19, leading to early correct diagnoses and appropriate management, particularly in triage.18
Regarding therapy, by adding POCUS to our protocol, we could determine the presence of synchronous or comorbid diseases, such as heart failure or lobar pneumonia (viral or bacterial), or confirm the presence of deep vein thrombosis or pericardial effusion, which in our study was observed in approximately 1 of 5 (18.8%) patients. These findings should trigger the initiation or adjustment of therapy (e.g., antibiotics, anticoagulants, diuretics, or colchicine).
Moreover, we showed that that the number of affected lung areas correlated with inflammatory markers, such as IL-6, which in turn could serve as a guide to start therapy with an anti-IL-6 therapy (e.g., tocilizumab). Remarkably, but understandably, this marker was associated with a higher respiratory rate, acute phase reactants (CRP, procalcitonin, ferritin) and LDH, which according to previous studies are also prognostic markers.5 We did not observe a correlation with ICU admission, therapeutic or invasive procedures, or death, possibly due to the short follow-up (1 week).
Evidence in follow-up and prognosis, dynamic changes in chest CT findings (GGO lesions, crazy-paving pattern, and consolidation) have been proposed to occur during the time course and progression of the disease,19,20 which could be a marker of the disease stage. Given this disease tends to have a rapid progression, a CT scan might not be available, or the patient's condition might not allow its performance.14 As previously reported in the COVID-19 era, there is a correlation between Lung POCUS findings and those of the CT scan21,22; therefore, follow-up could be more easily replaced with POCUS because it would be more accessible. This possibility should be explored in future studies.
The presence of apical lung involvement in POCUS correlated in our study with various comparable comorbid diseases (hypertension, cardiomyopathy, dementia) that yielded specific laboratory markers (creatinine, lymphocyte count, procalcitonin), and as expected, prognoses.5
The IVC, as a marker of fluid status, moderately correlated with levels of pO2 and troponin I, which could represent hemodynamic congestion (higher inspiratory and expiratory diameters) and poorer oxygenation. Therefore, we believe that integrating IVC into our current practice is appropriate, given it more physiologically addresses the assessment of the volume status.
In our study, we found a higher prevalence of pleural effusion (23%) than previously reported,16,20 which could be due to the accuracy of the technique compared with CT scan or chest X-ray12; therefore, its mere presence should not be considered as a prognostic factor.
The main strengths of our study, is that to our knowledge, this is the first study evaluating the potential impact of POCUS on patients with COVID-19, with diagnostic, prognostic, and therapeutic implications.
We would like to share our study findings, given the urgent need for various strategies in order to better manage patients with COVID-19, and to diminish the SARS-CoV-2 spread and its prognosis in the current pandemic context. Given the shortage of resources constitutes an undeniable public health threat, we consider POCUS to be a potential solution, and recommend that it be performed as a first-line imaging test for patients with COVID-19.
There are several limitations to consider. The main limitation is that lung POCUS findings overlap with those from other pneumonia etiologies or incidental chronic findings (e.g., chronic heart failure or pulmonary fibrosis). In epidemic areas, however, positive lung POCUS features, even with negative RT-PCR or chest X-ray, can still be highly suggestive of COVID-19 infection, which could preclude that the sensitivity and specificity reported of lung POCUS might be higher. Thus, more studies should be performed comparing it with other techniques (e.g., CT scan). Many patients with COVID-19 in our ED with negative RT-PCR or chest X-ray do not always receive a chest CT, and therefore there is a chance of misdiagnosis. This limitation was minimized, given the patients were followed-up by reviewing their electronic history, and any complications were recorded. In addition, we have to highlight that the main purpose of the study was to compare the performance of POCUS in COVID-19 patients, and the study was not powered to evaluate the performance of a diagnostic or management strategy based on POCUS findings; therefore, for this purpose, the study can only be considered hypothesis generating.
Another limitation is that selection bias might have occurred. Two expert sonographers performed all ultrasound scans on a consecutive sample selected based on their availability (during their working hours), which limits the generalizability of our results. The impact of this limitation is minimized by variable schedules and changing shifts, unpredictable a priori (in continuous care). Additionally, false negative ultrasounds might be found in the initial stage of the disease, before lung involvement.
Thus, the results from this study provide an opportunity to further investigate the use of ultrasound in various settings and clinical scenarios.
In conclusion, in this pandemic era, given the shortage of resources constitutes an undeniable public health threat, POCUS presents the potential to impact the diagnosis, management, and prognosis of patients with confirmed or suspected COVID-19.
Authors’ contributionConception and design: YTC. Analysis and interpretation: YTC. Data collection: YTC, PRF, RFF, ESR, BAM. Writing the article: YTC, ALM. Critical revision of the article: YTC, PRF, RFF, ALM. Final approval of the article: YTC, PRF, RFF, ALM, ESR, BAM, AMV, ARN. Statistical analysis: YTC, ALM. Overall responsibility: YTC.
EthicsAll authors read and approved the final manuscript. This work has not been supported by public grants or financial support. No sources of funding were used to assist in the preparation of this study. Each author certifies that he has no commercial associations that might pose a conflict of interest in connection with the submitted article. We certify that this research was conducted in conformity with ethical principles of our institution. This work, figures and tables, have not been previously published and reproduced from another source.
Data access and responsibilityThe principal investigator, Yale Tung Chen, had full access to all of the data in the study and takes responsibility for the integrity of the data and the accuracy of the data analysis.
FundingThis research received no external funding.
Conflict of interestThe authors declare that they have no conflict of interest.
The authors have declared no conflicts of interest.
- 1.
Why is this topic important?
Coronavirus Disease 2019 (COVID-19) is a highly contagious illness caused by severe acute respiratory syndrome coronavirus 2 (SARS-CoV-2). In this pandemic era, with the low sensitivity of diagnostic tests and a shortage or difficult-to-access resources, such as CT scan, specific laboratory markers such as IL-6 or therapy, and the lack of reliable prognostic markers (e.g., need for ICU admission or mechanical ventilation), constitutes an undeniable public health threat.
The role of point-of-care ultrasonography (POCUS) has yet to be explored.
- 2.
What does this study attempt to show?
We aimed to describe and characterize the POCUS findings in patients with COVID-19 admitted to the emergency department (ED), to correlate these parameters with vital signs, laboratory prognostic markers, and chest X-ray.
- 3.
What are the key findings?
- -
Diagnostic: POCUS findings correlated with the result of the reverse transcription-polymerase chain reaction (RT-PCR) and chest X-ray abnormalities.
- -
Therapeutic: After POCUS, approximately 20% of the patients had an associated condition that required a change in their treatment or management. POCUS findings correlated with IL-6 levels (potential therapy with anti-IL-6).
- -
Prognostic: Apical involvement in lung POCUS correlated with a poor outcome (ICU admission, need for mechanical ventilation, inotropic drugs, and death). IVC correlated with troponin I and levels of pO2.
- 4.
How is patient care impacted?
Diagnostic imaging plays a key role in the management of patients with COVID-19, and POCUS might be a potential solution to the limitations in the various strategies used to manage these patients. We recommend that POCUS should be performed as a first-line imaging test for patients with COVID-19.