


The COVID-19 pandemic posed severe challenges for governments, presenting unknown situations and requiring decisions to be made under unprecedented uncertainty. Scientists responded fast, developing vaccines to mitigate the effects of the disease and improve pandemic management. This study examines the evolution of healthcare efficiency during the first year of vaccination against COVID-19 and identifies the impact of related social, economic, and political factors. Using the Global Malmquist-Luenberger index, we measure the evolution of efficiency during the first year of the COVID-19 pandemic. We employ a truncated-regression model estimated by maximum likelihood to determine the impact of various environmental factors on the change in efficiency. The results show that 70% of the countries in the sample, most of which had high vaccination coverage, improved their efficiency during the first year of COVID-19 vaccine deployment. A larger dependent population was associated with lower efficiency levels. Higher governance quality was positively and significantly related to efficiency. In contrast, GDP growth forecasts and government type had no statistically significant effects. The results confirm that homogeneous and complete vaccination in all countries improved the efficient management of this highly contagious disease. These findings can help policymakers analyse their management performance and better understand the factors that contribute to efficient management during pandemics.
The global pandemic caused by the SARS-CoV-2 virus had significant and far-reaching impacts on health, economic, environmental, and social domains (Mofijur et al., 2021; Sharma et al., 2022; Blasco et al., 2024; Ding et al., 2025). This unprecedented crisis put severe pressure on public services, exposing managerial and organisational shortcomings (Casalegno et al., 2023). In particular, health systems were not designed to handle a large-scale and unpredictably evolving challenge that required the rapid mobilisation of resources and affected the entire population (Henriques & Gouveia, 2022). Factors such as shortages of personal protective equipment, understaffing, and the need to prioritise patients forced healthcare professionals to work under chaotic conditions, with exhausting shifts and high levels of psychological distress (Sanduni Nishara & Ariyasinghe Asurakkody, 2025).
However, the scientific community responded quickly by developing a vaccine capable of mitigating the consequences of the disease (hereinafter, COVID-19). With this advance, the 21st century has ushered in a new era of vaccinology, with recombinant gene technology accelerating vaccine development (Kim et al., 2020). COVID-19 vaccine delivery began in late 2020. Five vaccines (AstraZeneca, Pfizer BioNTech, Sinovac, Moderna, and Sputnik) led the effort, and despite initial controversy and public scepticism, they were widely delivered, with 13.492 billion doses delivered by August 2023 (World Health Organization, 2023). Within weeks, these vaccines became the beacon of hope for a return to normalcy (Amankwah-Amoah, 2022).
In this context, the following research questions are proposed:
- -
RQ1. How did the efficiency of COVID-19 management evolve during the first year of vaccination?
- -
RQ2. What economic or political factors may have conditioned the development of efficient COVID-19 management?
To address these questions, we evaluate the inter-annual health system efficiency levels of 162 countries in managing the COVID-19 pandemic. Using the Global Malmquist-Luenberger (GML) index, we estimate the productivity of health systems, defined as maximising desirable outputs (vaccinated) while minimising undesirable outputs (confirmed cases and COVID-19 mortality). In addition, we estimate the impact of various demographic, economic, and political factors on efficiency to identify elements that could enhance pandemic management in the future.
The analysis focuses on the first year of vaccination. This timeframe was chosen because most Western countries lifted initial restrictions after the first year. This action reduced epidemiological surveillance and compromised the reliability of vaccination data after the first year.
The research aims to provide public decision-makers with empirical evidence on pandemic management that can help improve their response capacity in similar future contexts. Despite the growing body of literature on COVID-19 from various perspectives, including health (Rosenberg et al., 2020), as well as economic and political concerns (Higginson et al., 2020), few studies have specifically assessed whether the pandemic was efficiently managed (Breitenbach et al., 2021).
The remainder of the paper is structured as follows: Section 2 reviews studies on the efficiency of health systems in managing the COVID-19 pandemic and presents hypotheses and their theoretical foundations. Section 3 describes the methodology used in the analysis. Section 4 details the variables used in the research and the composition of the sample. Section 5 presents the results obtained. Finally, section 6 summarises the main conclusions drawn, discusses their implications for public managers, acknowledges the limitations of the study, and suggests possible lines of future research.
Literature ReviewIn this section, we first review recent literature on efficiency in managing the COVID-19 pandemic and the factors that may influence this efficiency. The research hypotheses and their theoretical foundations are then presented.
Literature BackgroundThe first cases of the coronavirus were detected in China in December 2019. Three months later, its global spread had become alarming.1 On March 11, 2020, the World Health Organization (WHO) officially declared COVID-19 a pandemic.
In the absence of a vaccine or proven treatment in the early stages of the pandemic, countries implemented various non-pharmaceutical interventions (NPIs) to curb the spread of the virus, such as lockdowns, social distancing, quarantines, travel restrictions, and patient isolation (Santeramo et al., 2021). The efficiency of NPIs in containing the virus varied substantially across countries (Shirouyehzad et al., 2020; Breitenbach et al., 2021), underscoring the need for a strong and well-managed healthcare system to mitigate the negative health outcomes associated with COVID-19 (Santeramo et al., 2021).
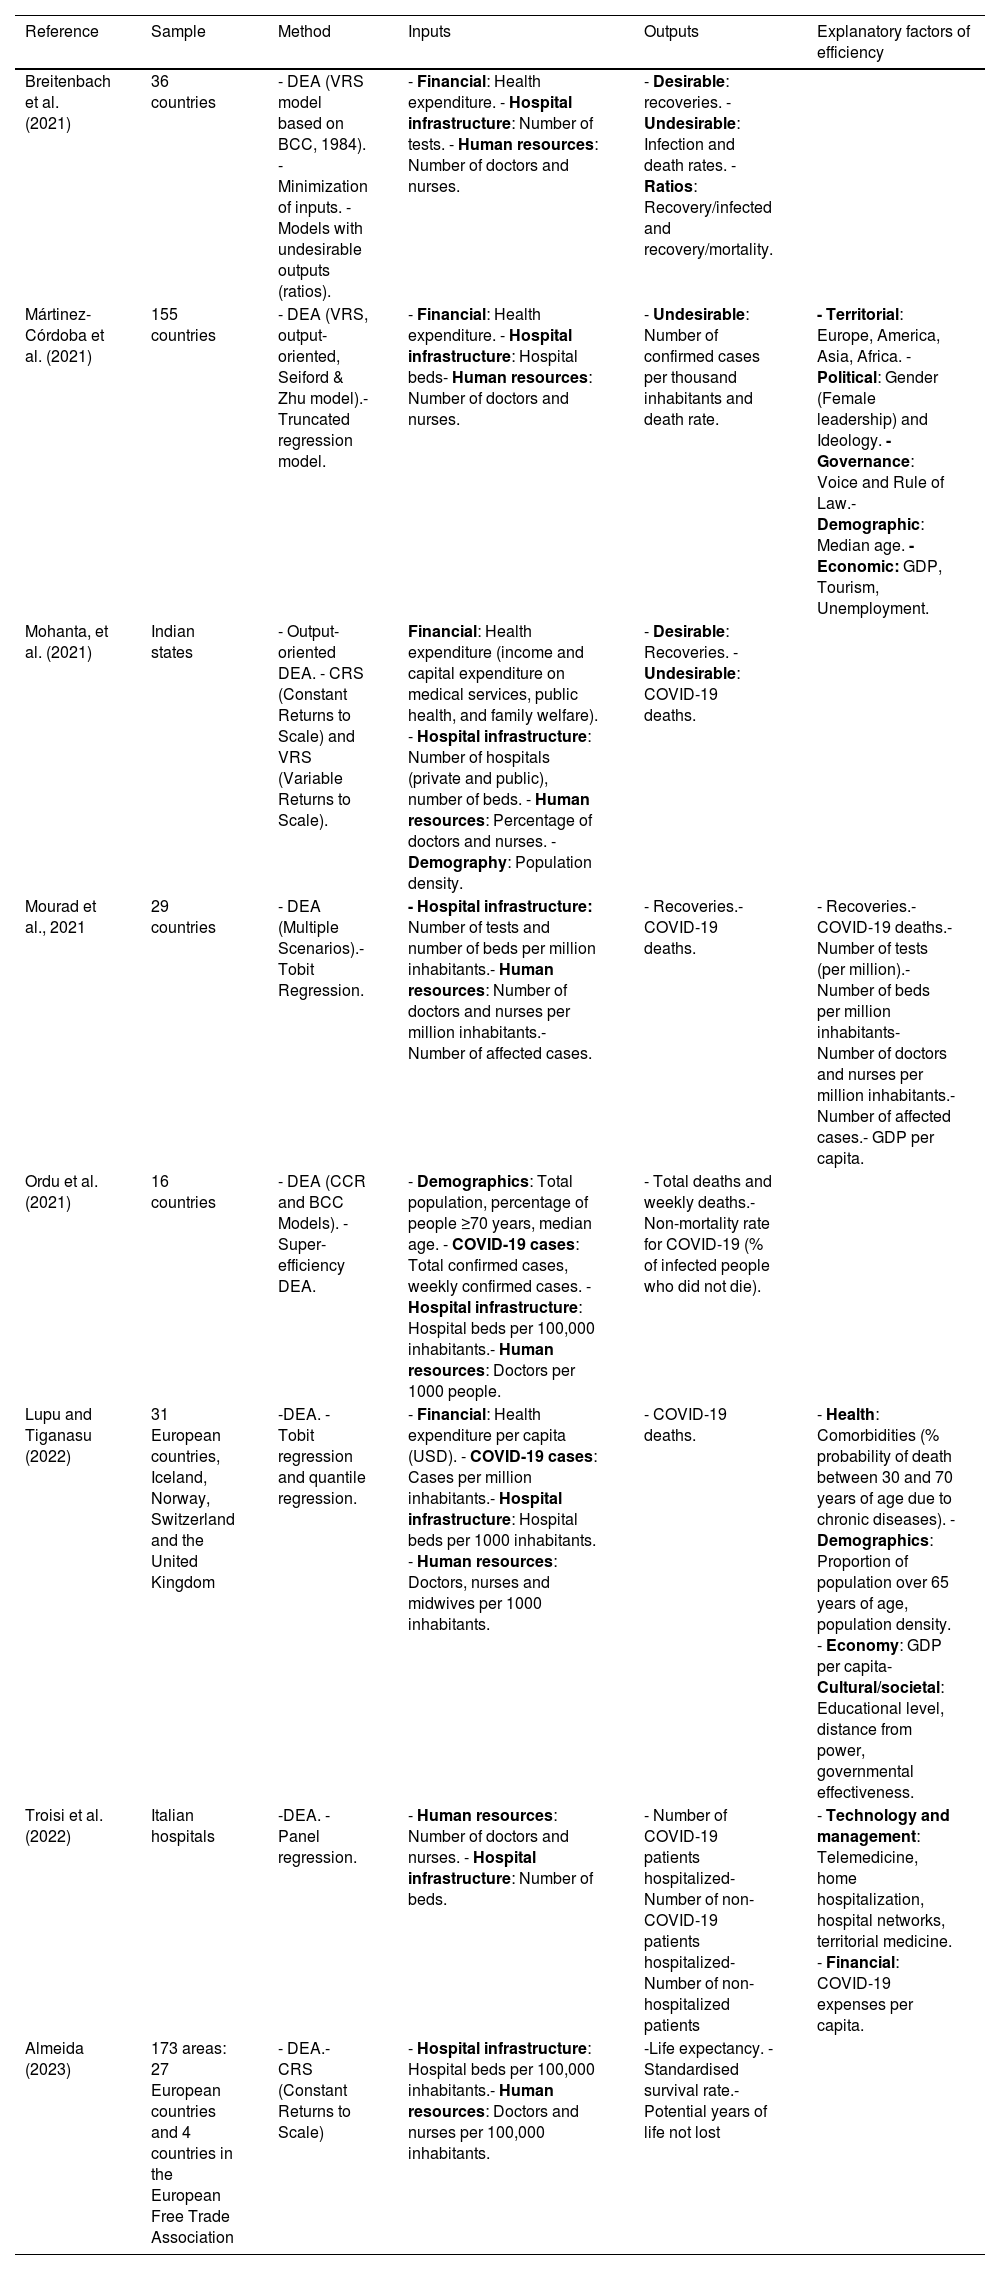
Concurrently, hospitals had to optimise scarce resources amid the deepest economic contraction in a century (World Bank, 2022), highlighting efficiency as a strategic priority (Rays, 2021). In this context, numerous studies have employed the non-parametric Data Envelopment Analysis (DEA) technique to assess the technical efficiency of public health services in managing the COVID-19 pandemic, primarily at the macroeconomic level (i.e., across countries or regions). The inputs considered typically include human resources (physicians and nurses), hospital infrastructure (number of beds), and health expenditure; the outputs comprise health indicators such as the number of recoveries and the mortality rate (see Table A.1 in the Appendix).
A key aspect in the literature concerns the modelling of undesirable outputs of the pandemic, such as infection and mortality rates. Previous studies such as Martínez-Córdoba et al. (2021) incorporate undesirable outputs following the approach of Seiford and Zhu (2002), considering infections and deaths as indicators of inefficiency. However, Breitenbach et al. (2021), in their DEA model, employed the ratio methodology proposed by You and Yan (2011) to simultaneously address the maximisation of desirable outputs (recoveries) and the minimisation of undesirable ones (deaths and infections) in managing COVID-19.
The literature highlights two key findings. First, efficiency in COVID-19 management was higher in later phases—such as the relaxation period (June–October 2020) and the second wave (October–December 2020)—compared to the first wave (January–June 2020). Second, developed countries, despite having more advanced health systems, exhibited lower efficiency compared to developing countries (Breitenbach et al., 2021; Martínez-Córdoba et al., 2021; Ordu et al., 2021).
In analysing healthcare management in terms of efficiency, exogenous factors that may influence service delivery should be considered (Cordero et al., 2011). For example, government legitimacy is essential to maintain the political capacity to implement public health measures. In times of crisis, citizens look to their governments for credible information to guide individual behaviour (Hartley & Jarvis, 2020; Moreno, 2026). Issues such as inadequate health system management, the lack of a participatory process involving all stakeholders, insufficient funding, or the lack of political action can compromise the success of the health system response (Chukwu & Nnogo, 2022).
Demographic structure also represents a significant challenge, as an ageing population faces more health problems and higher mortality rates during a health crisis (Lupu & Tiganasu, 2022). While partisan differences did not significantly impact the early months of the pandemic, the lack of early governmental responses complicated outcomes, as rapid and flexible measures to contain the virus proved more effective than delayed and more rigid ones (Plümper & Neumayer, 2020).
Theoretical backgroundThe following analysis of efficiency in COVID-19 management is grounded on established conceptual frameworks, from which the study hypotheses are derived:
H1. Efficiency in COVID-19 management is enhanced by organisational learning processes.
During the global COVID-19 pandemic, effective organisational change was crucial to delivering optimal patient care, ensuring staff safety, and mitigating disease spread (Lyman et al., 2022). The theory of organisational learning (Argyris and Schön, 1997; Levitt & March, 1988) provides a useful framework to conceptualise this change. Organisational learning is defined as a positive change in an organisation’s collective knowledge, cognition, and behaviour through experience, feedback, and adaptation to the environment to achieve desired outcomes (Alonazi, 2021). In this regard, Casalegno et al. (2023) emphasise that adaptive governance, inter-organisational coordination, and learning capacity distinguish resilient public services capable of rapidly mobilising resources and implementing coherent strategies during crises.
H2. Countries with higher rates of vaccination will achieve greater improvements in COVID-19 management efficiency.
Vaccines are innovative products (Bachmann & Frutos-Bencze, 2022). Studies confirm that during the COVID-19 pandemic, countries with efficient vaccine distribution achieved better health outcomes with fewer resources (Jabłońska et al., 2021; Breitenbach et al., 2021). Equitable global distribution can help suppress new variants, generate herd immunity, and ultimately end the pandemic (Sharma et al., 2021). As vaccines became available, governments sought to deploy them as quickly as possible (Smith et al., 2021), and the WHO facilitated global learning forums to optimise vaccine introduction (Walldorf et al., 2024).
In the early stages, supply issues were decisive, but demand factors became more important over time (Monrad et al., 2022). Higher education and income were positively associated with vaccine acceptance (Kordestani et al., 2023), as was a strong collective commitment to public health (Hierro et al., 2023). However, doubts about vaccination constituted a critical barrier, particularly in low-income countries (Moradpour et al., 2023). Among the main obstacles were safety concerns (Burke et al., 2021; Gao et al., 2023), lack of information (Kordestani et al., 2023), and political factors such as distrust of the government (Khubchandani et al., 2021; Latkin et al., 2021) and political polarisation (Baumgaertner et al., 2018; Latkin et al., 2021).
H3.Countries with higher governance quality will achieve greater efficiency in COVID-19 management.
Political economy models emphasise the role of institutional structures, governance capacity, and public trust in policy effectiveness (Acemoglu & Robinson, 2013; Greer et al., 2020). Factors such as democratic principles, political stability, trust, high public health expenditure, women's participation in the labour force, and economic equality are positively and significantly associated with the efficiency of government policies in addressing the COVID-19 pandemic (Delis et al., 2023). Accordingly, governments with greater legitimacy, transparency, and coordination mechanisms demonstrated a stronger capacity to implement NPIs, manage vaccination campaigns, and reduce systemic inefficiencies (Hartley & Jarvis, 2020; Chukwu & Nnogo, 2022).
In summary, the impact of the pandemic on society was complex, prolonged, and difficult to measure. Therefore, it is essential to continue expanding the existing literature and generating new contributions in this field (Shulla et al., 2021) with regard to governance and vaccination challenges (Goren et al., 2023; Hierro et al., 2023; Noto et al., 2023; Reinl et al., 2024).
To our knowledge, no previous studies have conducted a comprehensive, inter-temporal analysis of the efficiency of health systems during the first year of COVID-19 vaccination, integrating vaccination coverage, governance quality, and demographic structure. Such an investigation, combining dynamic and institutional approaches, would enable us not only to quantify changes in efficiency but also to identify its key determinants, thus obtaining a more comprehensive and up-to-date understanding of health system performance in the face of the pandemic.
MethodologyGlobal Malmquist-Luenberger indexAlthough many parametric and non-parametric techniques are available for this purpose, there is no perfect method for calculating efficiency; thus, researchers must choose the most appropriate one for the characteristics and objectives of their study (Fernández-Santos et al., 2025; Ibarrondo-Dávila et al., 2025; Narbón-Perpiñá et al., 2019). In the present case, our main objective is to track the evolution of efficiency levels over a given time interval; therefore, we must discard all techniques that do not provide inter-temporal measures.
To capture this evolution effectively, we measure changes in productivity, as the decomposition of productivity change reveals the corresponding change in efficiency. In this regard, the indicator par excellence is the Malquimst index (MI). Originally introduced by Caves et al. (1982) and subsequently developed by Färe et al. (1994), the MI has been widely used (Färe et al., 2004; Cui et al., 2014; Sufian and Kamarudin, 2015) to assess how productivity and hence efficiency fluctuate over different time periods.
For our study, a significant limitation of the original MI is that it does not adequately account for undesirable outputs. As indicated in Table 2, we distinguish between desirable and undesirable outputs, given that during the first year of vaccination, countries should strive to maximise the number of vaccinated individuals while minimising the number of cases and deaths.
The issue with the original MI arises from its reliance on Shephard’s output distance function (Shephard, 1970), which expands both desirable and undesirable outputs simultaneously, rendering it unsuitable for our goal of reducing undesirable outputs. To address this limitation, Chung et al. (1997) introduced the Malmquist-Luenberger index, which enables the expansion of desirable outputs while minimising undesirable ones. Instead of using Shephard’s output distance function, these authors employed the Directional Distance Function (hereinafter, DDF), thereby allowing for a more appropriate representation of technology in the presence of undesirable outputs.
However, the Malmquist-Luenberger index also has two critical limitations (Oh, 2010): it does not guarantee circularity and can lead to infeasibility issues when employing linear programming techniques (Pastor & Lovell, 2005). To address these shortcomings, Oh (2010) proposed the GML index, building on the Global Malmquist index established by Pastor and Lovell (2005) and overcoming the aforementioned drawbacks, which are also encountered in the original MI.
To define this index, we follow the formulation proposed by Oh (2010) and the work of Wang et al. (2022), who explain its development in detail.
First, we must define the production technology set, which in developing the GML index becomes known as the overall production technology set, which is expressed as follows:
where x refers to inputs, y to desirable outputs, and b to undesirable production. This global production technology set encompasses the different production frontiers that arise for each of the years considered; that is, the aim of defining this global production frontier is to obtain a single reference frontier for the entire period, constructed by integrating the various contemporaneous production frontiers.
The next step is to define the DDF used, necessary to calculate the GML index, which is expressed as follows:

The objective of this function is to achieve the maximum increase in desirable output (y) while achieving the maximum reduction in undesirable output (b). The direction vector g determines the direction of the outputs, such that desirable outputs increase and undesirable outputs decrease. In this case, the vector is defined as g=(y,b), following the approach of Chung et al. (1997).
Finally, once the production frontier is defined, together with the DDF used to measure efficiency, we can define the GML index, which is expressed as follows:

This can be broken down as follows:
where Efficiency Change (EC) reflects the change experienced in efficiency from one period to another, while BPC is defined as the best practice gap change. It measures how closely a contemporary frontier moves towards the global frontier; that is, this component reflects the technical change experienced between the two time periods. Thus, values greater than one in both components indicate progress, while values less than one reflect a deterioration of the measure under consideration.
Finally, it is necessary to determine the returns of the model. To do so, we adopt variable returns to scale to capture heterogeneity among countries (DMUs), which operate with very different sizes and resource endowments. Under this assumption, we allow each unit’s performance to depend on its relative size and do not assume constant returns for all DMUs. This mitigates scale biases and improves comparability between countries. Finally, R-Studio and the lpSolve package version 5.6.20 (Berkelaar & Csárdi, 2024) were used to obtain the GML index scores.
Regression modelThe regression model (1) below identifies the impact of a set of exogenous variables on the evolution of efficiency in managing the COVID-19 pandemic.
where δ^i is the EC for each country, α is the constant, βj are the coefficients, Dependency, GDP, Government and Governance are the exogenous variables, and εi is the error term.
There are different methods for estimating a regression model, with the characteristics of the dependent variable and the research context determining the most appropriate method. In our case, the EC is expressed as positive values, where 1 is the point between the DMUs (countries) that have improved or worsened compared to the previous point in time. Values above 1 indicate an improvement, while those below 1 reflect a deterioration. Negative values are not possible. Therefore, following previous estimates of similar levels of second-stage efficiency (Martínez-Córdoba et al., 2021), the regression model (1) is conditioned to an estimation by truncation—this being considered the best method to test the impact of exogenous variables (Simar & Wilson, 2011, 2020) on efficiency levels in the second stage.
R-Studio and the truncreg package were used to estimate model (1) for the Gaussian variables truncated by maximum likelihood. To verify the suitability of the model and its estimation, Table 1 shows the correlation coefficients between the inputs-outputs and the exogenous variables. The indicated significances do not represent a drawback for the analysis as they are not high (<0.6).
Coefficient of correlation among inputs-outputs and exogenous variables.
Significance: ***1%, **5%, *10%
Source: own elaboration
In most countries, the COVID-19 pandemic was managed by the executive power of the central government, assuming responsibilities that would have fallen to other government levels under normal circumstances (López et al., 2026), such as coordinating the purchase and supply of vaccines. Information regarding the pandemic varies according to the methodologies used to record infections, deaths, and vaccinations. Therefore, it is advisable to refer to sources from official international organisations, which offer valid, reliable, and comparable data that are suitable for assessing the efficiency of COVID-19 management.
In the present study, and in line with previous literature, the input variables represent the resources available to tackle the health crisis, whereas the output variables reflect its direct results. The inputs come from the World Bank’s World Development Indicators and include the total number of general practitioners and specialists, beds available in public and private hospitals, and nurses, midwives, and other associated personnel per thousand inhabitants, as well as the level of current health expenditure expressed as a percentage of GDP. The latter indicator is defined as the total health expenditure incurred in a country during a given period, regardless of the entity or institution that finances or manages it. This category includes all health goods and services consumed during the year and excludes capital investments for emergencies or outbreaks, such as infrastructure, equipment, information technology, or vaccine reserves.2 The input variables correspond to the years 2020 and 2021, as they reflect the capacity of healthcare resources and the expenditure incurred both in the year prior to the start of vaccination (2020) and during the first year of mass vaccination (2021).
The output variables were obtained from the official WHO database. They are classified into one desirable outcome and two undesirable ones. The desirable one is Vaccination (per thousand inhabitants): number of people who completed the primary COVID-19 vaccination schedule, divided by the total population and multiplied by 1,000. The undesirables ones are Confirmed cases (per thousand inhabitants): number of cumulative cases diagnosed mainly through laboratory testing, with possible variations because of national adaptations, divided by the total population and multiplied by 1,000 and Mortality rate (per thousand infections): total number of deaths from COVID-19 divided by the total number of confirmed cases and multiplied by 1,000 (Case Fatality Rate, CFR).3
The WHO considers a death from COVID-19 to result from a clinically compatible, confirmed, or probable disease, with no other clear cause of death or complete recovery before death. The output variables refer to January–February 2021 and February 2022, allowing for an assessment of the first-year vaccination effect. To ensure comparability between countries despite the uneven start of vaccination programmes, the analysis begins on the thirtieth day after the first dose, the estimated time frame for completing the primary series and generating immunity.
The exogenous variables were also obtained from official international databases. The dependency ratio is derived from the World Bank’s World Development Indicators and is defined as the ratio of people aged 0–14 and 65 or older to the population aged 15–64. GDP is derived from the International Monetary Fund’s World Economic Outlook (WEO) and corresponds to the average rate of change in real GDP projected for 2023–2026, calculated at constant prices.
The government variable was obtained from the Democracy Index compiled by the Economist Intelligence Unit, which classifies countries into authoritarian, hybrid, flawed, and full democracies, coded from 1 to 4. Finally, the governance (%) variable is derived from the Worldwide Governance Indicators (WGI) project. The WGI divides governance into six dimensions: voice and accountability, political stability and absence of violence, government effectiveness, regulatory quality, rule of law, and corruption control. Our analysis focuses on the government effectiveness dimension (Kaufmann et al., 2011), which reflects perceptions of the quality and independence of public services, the capacity of the administration, the quality of policy formulation and implementation, and the credibility of government commitment. The values are expressed in percentiles (0–100), with higher figures representing a better assessment of government performance.
Excluding GDP, for which we use the International Monetary Fund (IMF) projections published in April 2022 for 2023–2026, the exogenous variables correspond to 2021. Table 2 presents the descriptive statistics for the inputs, outputs, and exogenous variables.
Descriptive statistics of the inputs, outputs, efficiency change and exogenous variables.
| Variable (unit) | Min. | Mean | Median | Max. | S.d. |
|---|---|---|---|---|---|
| Inputs | |||||
| Physicians (per thousand inhabitants) a | 0.036 | 16.616 | 10.739 | 70.784 | 18.636 |
| Hospital beds (per thousand inhabitants) a | 0.100 | 2.834 | 2.210 | 12.980 | 2.290 |
| Nurses (per thousand inhabitants) a | 0.124 | 39.476 | 26.306 | 183.493 | 41.554 |
| Health expenditure (%) a | 1.798 | 6.406 | 6.228 | 16.767 | 2.480 |
| Good output | |||||
| Vaccine (per thousand inhabitants) b | 2.835 | 459.233 | 486.357 | 922.059 | 261.291 |
| Bad outputs | |||||
| Cases confirmed (per thousand inhabitants) b | 0.023 | 61.334 | 25.627 | 427.425 | 84.566 |
| Death rate (per thousand infections) b | 0.488 | 19.522 | 16.051 | 196.908 | 18.597 |
| Dependent variable | |||||
| Efficiency change | 0.784 | 1.223 | 1.112 | 1.941 | 0.280 |
| Exogenous variables | |||||
| Dependency (%) a | 26.476 | 58.746 | 54.914 | 109.503 | 15.139 |
| GDP (%) c | 1.000 | 56.074 | 58.356 | 100.000 | 17.522 |
| Government d | 1.000 | 2.352 | 3.000 | 4.000 | 1.024 |
| Governance (%) e | 0.481 | 49.902 | 50.721 | 100.000 | 28.554 |
The initial reference population comprised 193 UN member states. These countries offer the broadest political and geographical coverage for comparative analysis and are officially recognised in the international statistical system, regularly reporting data to multilateral organisations.
The sample was refined by applying a criterion of complete availability of information on the input variables, which led to the exclusion of 31 countries. For the output and exogenous variables, full coverage was verified in the remaining 162 countries. Finally, to rule out inconsistencies or omissions, the database was validated using descriptive statistics, confirming the suitability of the final set for econometric analysis.
Results and discussionThe evolution of the efficiency of COVID-19 management was calculated using the GML index, considering as inputs the number of doctors, nurses and beds per thousand inhabitants, together with health expenditure as a percentage of GDP. Outputs included vaccines administered (desirable output) and the number of confirmed cases and COVID-19 mortality (undesirable outputs).
Table A.2 in the Appendix presents the values obtained for the evolution of efficiency in managing COVID-19 for all countries in the sample during the first year of vaccination. The results show an overall improvement in efficiency: 113 of the 162 countries analysed (69.8%) scored above 1 in terms of EC, indicating better performance compared to the start of the pandemic. Only 26 countries (16.0%) scored below 1, reflecting a decline, while levels in the other countries remained fairly constant.
These results, in line with the findings from previous literature (Troisi et al., 2022; Lupu & Tiganasu, 2022), validate H1, which posits an increase in efficiency because of organisational learning processes. The positive trajectory observed is in line with the organisational learning theory (Argyris and Schön, 1997; Casalegno et al., 2023), which posits that iterative adaptation improves institutional capacity to provide more effective responses during crises (Lyman et al., 2022; Casalegno et al., 2023).
Fig. 1 shows the evolution of efficiency in managing COVID-19 during the first year of vaccination. Countries are represented on a colour scale: red indicates those whose efficiency decreased, while shades of green reflect improvements, with increasing intensity as efficiency increases. Moldova (0.78), Cameroon (0.82), and Cape Verde (0.83) were the worst performers, showing a reduction in efficiency. In contrast, Vietnam (1.90), China (1.92), and Barbados (1.94) stood out as the countries with the highest efficiency gains.

The lowest-performing countries were mainly in Africa, a continent initially expected to be severely affected given its limited resources and higher vulnerability to infectious diseases (Lone & Ahmad, 2020). However, during the first wave, several studies highlighted the efficiency of African government responses (Martínez-Córdoba et al., 2021; Stiegler & Bouchard, 2020). Over time, some governments relaxed restrictions because of their high economic and social costs (Lone & Ahmad, 2020), which contributed to a decline in efficiency.
Fig. 2 presents a map of the 162 countries in the sample classified according to the income level defined by the World Bank based on the gross national income per capita for the previous year. There are four income categories: low, lower middle, upper middle, and high. This classification is essential for contextualising the efficiency changes, as it reflects the financial and human resources that each economy was able to mobilise during the vaccination campaign.

Fig. 2 shows that most high and upper middle-income countries—and therefore those with presumably greater structural capacity to achieve high vaccination rates—are located in North America, Europe, Oceania, and parts of Asia. In contrast, the low-income countries are mainly located in sub-Saharan Africa and, to a lesser extent, in South Asia. Lower middle-income countries are more heterogeneously distributed, with a presence in Africa, Asia, and Latin America.
A comparison between Figs. 1 and 2 reveals that most high-income countries recorded substantial improvements in efficiency, while setbacks were concentrated in sub-Saharan Africa, parts of the Middle East, and Eastern Europe, areas with lower structural resilience and greater resource constraints. However, several middle-income economies—such as China, Vietnam, Nicaragua, and Fiji—outperformed some advanced economies, including the United States and oil-exporting countries, in terms of efficiency. This pattern is consistent with studies indicating that, in certain contexts, developing countries managed the pandemic more efficiently (Ordu et al., 2021; Martínez-Córdoba et al., 2021), confirming that fiscal capacity is necessary but not sufficient for effective management, underscoring the role of governance and adaptation (H3).
Fig. 3, a graphical representation of the variable Vaccine (citizens with first complete vaccination per 1,000 inhabitants, regardless of subsequent boosters) reveals a significant difference between African countries and the rest of the world because of the small number of vaccines available in these countries, largely due to difficulties in accessing them. This stems from both global distribution issues and logistical or financial constraints (Songane, 2018; Lawal et al., 2022). Inequitable access to vaccines is a major barrier for these countries (Monrad et al., 2022). In response, vaccination strategies should prioritise delivery to areas with limited supplies and low coverage (McIntyre et al., 2022). Despite efforts to achieve equitable distribution and production for homogeneous vaccination (the WHO’s COVAX programme), we find that countries with the lowest vaccination rates also perform poorly in terms of efficiency.

In contrast, those countries that presented a marked improvement in efficiency, such as Australia (1.70), Canada (1.72), and China (1.92), also achieved high vaccination rates, suggesting that vaccination played a key role in managing the pandemic during its first year. In other words, countries with high vaccination rates managed the pandemic more efficiently, supporting H2. Therefore, effective governance facilitates vaccination uptake by enhancing public trust and policy implementation (Chen, 2022; Hierro et al., 2023), thereby indirectly contributing to efficiency improvements.
Subsequently, we wished to determine the impact of exogenous factors that could enhance the understanding and implementation of public policies aimed at minimising the impact of the pandemic. To this end and to test the stability of our findings, we re-estimated the truncated-regression equation in four sequential specifications: first, the dependency variable alone (Model 1), second, the economic variable (Model 2), third, the political variables (Model 3), and finally, all the variables (Full Model) (see Table 3).
Regression results.
Significance: ***1%, **5%, *10%; coefficient and (t-value)
Source: own elaboration
The robustness of the Full Model is demonstrated both in the stability of the variable coefficients and in its progressively improving fit. As shown in Table 3, the log-likelihood rises from –12.5 (Model 1) to 12.99 (Full Model), and the χ² likelihood-ratio tests reject the restricted models at the 1% level, confirming the explanatory gain contributed by each set of covariates, thereby bolstering the conclusions drawn.
Model 1 shows that a 10-percentage point increase in the Dependency variable reduces efficiency by 0.0643 units. In other words, in countries with higher Dependency ratios, the efficiency performance decreased over the period analysed. This finding is in line with previous literature (Martínez-Córdoba et al., 2021; Lupu & Tinagasu, 2022), as vulnerable populations such as older adults and those with certain medical conditions are disproportionately affected by COVID-19 and require targeted interventions to protect them (Kuy et al., 2020). These groups require significant healthcare resources, and their increased risk of severe disease and mortality places additional strain on healthcare systems (Porcel-Gálvez et al., 2020). Consequently, countries with large dependent populations had to diversify their efforts during the pandemic to cover all groups, which had a negative impact on their management efficiency.
The results of Model 2 show that, from an economic (GDP) perspective, the countries with the highest estimated growth in the coming years (2023–2026) had lower levels of efficient development; specifically, a 10-percentage point increase in the GDP variable reduced efficiency by 0.024 units. This inverse relationship can be understood by considering the stringency of the measures implemented to curb the spread of COVID-19. Various studies found that more stringent and timely government responses that led to better compliance with social distancing, slower virus growth, and lower mortality improved pandemic management (Hale et al., 2020; Hussain, 2020). Mezencev & Klement (2022) further support the effectiveness of containment measures, reporting an inverse correlation between policy stringency and overall disease occurrence.
However, enforcing stricter measures to protect public health often imposes significant economic costs, underscoring the trade-off between health and wealth (Cross et al., 2020). Therefore, countries that prioritised economic recovery or maintained higher levels of economic activity appeared to invest fewer resources in rigorous public health interventions, negatively affecting their overall efficiency. Conversely, those willing to incur economic setbacks in favour of stronger containment measures achieved better pandemic management performance.
In the political sphere, Model 3 analyses two institutional variables: Government and Governance. The Government coefficient is negative but statistically insignificant, suggesting that regime type does not have a clear or robust impact on pandemic management efficiency. In contrast, Governance is positively associated and highly significant, showing that a 10-percentage point increase in this variable produces an increase in efficiency of 0.0583 units, supporting H3. This indicates that better-quality governance—characterised by reliable public services, effective policy implementation, and strong institutional capacity—strongly correlates with improved pandemic management efficiency, in line with the studies by Hartley and Jarvis (2020) and Chukwu and Nnogo (2022).
A key component in this context is the public’s perception of service quality, which influences both evaluations of government performance and the successful adoption of policies. Several studies have shown that factors such as tangibles, reliability, responsiveness, assurance, and empathy affect citizens’ satisfaction with public services (Bahri et al., 2020; Munzemba & Araújo, 2021), while trust in government and perceived service quality correlate positively with policy support and revenue allocation (Hoffmann et al., 2022). Although trust in government has been declining worldwide (Kim, 2010; Popovski, 2010), research shows that good governance practices—particularly, voice and accountability—are strongly associated with higher levels of trust (Spiteri & Briguglio, 2018). Effective public service delivery and welfare programmes also reinforce this trust (Mishra & Attri, 2020). These findings align with broader evidence underscoring governance as a pivotal element in crisis response during the COVID-19 pandemic.
Effective governance is marked by agile, adaptive, and transformative approaches (Assefa et al., 2022), alongside collaborative, multi-level, and evidence-based decision-making (Herbert & Marquette, 2021). In fact, countries with strong governance indicators—such as accountability, political stability, and the rule of law—generally managed the pandemic more successfully (Kusumasari et al., 2023). Therefore, we can confirm that a participatory process involving all stakeholders and the political will to implement actions are aspects of governance that can determine the success or failure of a health system (Chukwu & Nnogo, 2022). Consequently, the significant positive coefficient for Governance in our model underscores how robust governance structures and practices are essential to achieving higher efficiency in managing a global health crisis.
In the Full Model, the GDP variable ceases to be significant when the remaining explanatory factors are considered simultaneously, suggesting that medium- to long-term economic growth expectations do not determine management efficiency once other key variables are controlled for. In contrast, both Dependency and Governance remain statistically significant, underscoring their importance in the evolution of efficiency. In this sense, a lower proportion of dependent population and a positive perception of public services—indicative of higher levels of trust and institutional effectiveness—are associated with better performance during the first year of vaccination.
Finally, no changes in measure efficiency associated with the Government, reinforcing the idea that, rather than the political regime, the demographic structure and the quality of governance play a decisive role in a country’s capacity to respond effectively to a health crisis such as the COVID-19 pandemic. These results highlight the importance of strengthening institutions, improving public service provision, and supporting vulnerable populations to enhance efficiency in managing future health crises.
Robustness Check
To assess the robustness of our efficiency estimates, we recalculated the GML index after winsorising all input and output variables at the 2.5th and 97.5th percentiles. This trimming limits the influence of extreme observations without altering the central tendency of the data.
Next, the scores obtained in both specifications were compared using the Wilcoxon signed-rank test for paired samples. The test failed to reject the null hypothesis of equal medians (p > 0.10), indicating that the differences were not statistically significant. Consequently, our efficiency rankings and subsequent regression results are robust to outliers, reinforcing the validity of the findings.
In the truncated regression, we expanded the Full Model by incorporating dummy variables that classified countries according to the income levels defined by the World Bank (low, lower middle, and upper middle), taking the high-income group as the reference category. Figs. 1 and 2 suggest that no clear relationship exists between income level and variation in efficiency, and this is reinforced by the additional specification performed. Table 4 presents the coefficients thus estimated.
Regression results with income levels.
Significance: ***1%, **5%, *10%; coefficient and (t-value)
Source: own elaboration
The coefficients associated with income levels are small and statistically insignificant, whereas key variables such as Governance, with a positive sign, and Dependency, with a negative sign, retain their magnitude and significance. This indicates that once institutional and demographic factors are controlled for, per capita income does not have an independent effect on the evolution of efficiency, which reinforces the validity and stability of the main conclusions.
Conclusions and policy recommendationsResearch conclusionsThe responses of governments and international organisations to the health, economic, and social crises caused by COVID-19 demonstrate its severe impact on all aspects of life. Increased public expenditure on the many public policies aimed at mitigating the impact of this disease has prompted the present assessment of management efficiency during the pandemic. The public sector undertook management of the crisis without the benefit of previous knowledge and, in many cases, had to take action on an experimental basis. Our study highlights the critical role of vaccination in improving the efficiency of COVID-19 management during the first year of immunisation campaigns.
Vaccination and the experience gained in managing the pandemic enabled the situation to be brought under control and the restrictions imposed to be relaxed. In fact, statistical surveillance is now considered less important. Thus, it is essential to evaluate the management carried out before these sources of information disappear. Taking advantage of the current situation and available data, we calculated the evolution of pandemic management efficiency during the first year of vaccination. Our analysis using the GML index shows that 70% of the countries analysed improved their efficiency, with higher performance in those with higher vaccination coverage. This shows that vaccination played an important role in efficient management during the pandemic.
These results underscore the importance of universal access to vaccines, in line with SDG 3 (Good Health and Well-being), by showing that equitable immunisation directly contributes to stronger and more resilient health systems. Additionally, our results indicate that strong governance, rather than the type of political regime, is a key factor in enhancing efficiency. Thus, countries with better governance indicators, such as effective public service delivery and policy implementation, applying the principles of SDG 16 (Peace, Justice and Strong Institutions) managed the pandemic more efficiently
In contrast, countries with high dependency ratios and optimistic economic growth forecasts tended to exhibit lower efficiency levels, probably due to competing policy priorities, which reflects the need for inclusive and responsive public institutions. In summary, the study results confirm the need for homogeneous and universal vaccination in all countries to manage this highly contagious disease more efficiently. Furthermore, a globally coordinated, equitable vaccination effort would also strengthen institutional capacities, a central aspect of the 2030 Agenda. Finally, these results can help policymakers analyse their management performance and better understand the factors and measures that contribute to efficient management.
Implications and policy recommendationsCOVID-19 not only affected healthcare but also disrupted lives, undermined economies and provoked political change. Accordingly, the present research highlights the need to seek global solutions to global problems, avoiding short-term, temporary remedies.
This study complements the work of Martínez-Córdoba et al. (2021), who described how efficiency evolved during the first year of vaccination. Infections spread rapidly in Western countries and were slow to reach the African continent, which initially resulted in very positive levels of efficiency. However, after the first year of vaccination, the most efficient management took place in Western countries.
The findings have the following implications:
- -
There is a need for an equitable global vaccination plan that provides homogeneous immunity against COVID-19, considering the positive effects of efficient management. This should not be limited to COVID-19 but should serve as a learning experience to be applied to future risk situations by implementing homogeneous, global, and solidarity-based responses. Ensuring widespread and homogeneous vaccination coverage is essential for improving pandemic management efficiency and minimising disparities between regions. Governments should recognise the trade-offs between short-term economic recovery and long-term health system resilience.
- -
The political and administrative organisation of countries is an important aspect of efficient pandemic management. Democracy, the rule of law, and citizen participation are some aspects that enhance efficient management in complex circumstances by involving stakeholders in decision-making. Effective governance, including transparent decision-making and public trust in health policies, is crucial for efficient crisis response.
- -
Although health care is not a public service in all countries, in a pandemic situation, governments must deal with the adverse circumstances that it creates. Countries with ageing populations or high dependency ratios require tailored public health strategies to enhance efficiency. The economic and social consequences of the COVID-19 pandemic mean that governments must be able to manage a similar crisis efficiently to reduce its negative impact.
Our study underscores the importance of data-driven policy decisions in global health crises. By learning from the COVID-19 experience, policymakers can design more effective and equitable strategies for managing future pandemics. The lack of information on severity of infection, days in hospital, sequelae, people who recover, diagnostic tests performed, and other data that would allow a much more complete analysis is a limitation of our research. Despite the robustness of our findings, variability in reporting methodologies, the discontinuation of detailed COVID-19 surveillance, and the lack of indicators such as hospitalisation severity or post-infection recovery rates restrict the scope of this analysis.
In addition, the lack of a consistent methodology across countries makes comparisons difficult, and the cessation of detailed COVID-19 surveillance limits future research. Bearing these limitations in mind, new studies could focus on formulating indicators to assess management at critical moments, such as those experienced with COVID-19, or on an in-depth analysis of the management carried out during the pandemic in a country (case study) or group of countries, if the available information allows. Future research should also focus on developing standardised efficiency metrics and on conducting in-depth case studies to enhance our understanding of pandemic management strategies.
CRediT authorship contribution statementMartínez Córdoba Pedro José: Software, Project administration, Investigation. Márquez Arenas Lorena: Writing – original draft, Validation, Supervision. Povedano Fernández Pablo: Validation, Software, Methodology. Rodríguez Gómez Sara: Writing – review & editing, Supervision, Data curation. Zafra Gómez José Luis: Funding acquisition, Formal analysis, Conceptualization.
The authors declare that they have no known competing financial interests or personal relationships that could have appeared to influence the work reported in this paper.
This research was funded by Ministerio de Ciencia e Innovacion, grant number PID2021-128713OB-I00 y PID2024-161667OA.I00, MCIN/AEI/10.13039/501100011033/ y por FEDER una Manera de Hacer Europa and by the Spanish Ministry of Science, Innovation andUniversities through an FPU Grant (FPU21/02463) and FPU Grant (FPU21/04275).
Main variables in the study of the efficiency of the health system during the COVID-19 pandemic.
| Reference | Sample | Method | Inputs | Outputs | Explanatory factors of efficiency |
|---|---|---|---|---|---|
| Breitenbach et al. (2021) | 36 countries | - DEA (VRS model based on BCC, 1984). - Minimization of inputs. - Models with undesirable outputs (ratios). | - Financial: Health expenditure. - Hospital infrastructure: Number of tests. - Human resources: Number of doctors and nurses. | - Desirable: recoveries. - Undesirable: Infection and death rates. - Ratios: Recovery/infected and recovery/mortality. | |
| Mártinez-Córdoba et al. (2021) | 155 countries | - DEA (VRS, output-oriented, Seiford & Zhu model).- Truncated regression model. | - Financial: Health expenditure. - Hospital infrastructure: Hospital beds- Human resources: Number of doctors and nurses. | - Undesirable: Number of confirmed cases per thousand inhabitants and death rate. | - Territorial: Europe, America, Asia, Africa. - Political: Gender (Female leadership) and Ideology. - Governance: Voice and Rule of Law.- Demographic: Median age. - Economic: GDP, Tourism, Unemployment. |
| Mohanta, et al. (2021) | Indian states | - Output-oriented DEA. - CRS (Constant Returns to Scale) and VRS (Variable Returns to Scale). | Financial: Health expenditure (income and capital expenditure on medical services, public health, and family welfare). - Hospital infrastructure: Number of hospitals (private and public), number of beds. - Human resources: Percentage of doctors and nurses. - Demography: Population density. | - Desirable: Recoveries. - Undesirable: COVID-19 deaths. | |
| Mourad et al., 2021 | 29 countries | - DEA (Multiple Scenarios).- Tobit Regression. | - Hospital infrastructure: Number of tests and number of beds per million inhabitants.- Human resources: Number of doctors and nurses per million inhabitants.- Number of affected cases. | - Recoveries.- COVID-19 deaths. | - Recoveries.- COVID-19 deaths.- Number of tests (per million).- Number of beds per million inhabitants- Number of doctors and nurses per million inhabitants.- Number of affected cases.- GDP per capita. |
| Ordu et al. (2021) | 16 countries | - DEA (CCR and BCC Models). - Super-efficiency DEA. | - Demographics: Total population, percentage of people ≥70 years, median age. - COVID-19 cases: Total confirmed cases, weekly confirmed cases. - Hospital infrastructure: Hospital beds per 100,000 inhabitants.- Human resources: Doctors per 1000 people. | - Total deaths and weekly deaths.- Non-mortality rate for COVID-19 (% of infected people who did not die). | |
| Lupu and Tiganasu (2022) | 31 European countries, Iceland, Norway, Switzerland and the United Kingdom | -DEA. - Tobit regression and quantile regression. | - Financial: Health expenditure per capita (USD). - COVID-19 cases: Cases per million inhabitants.- Hospital infrastructure: Hospital beds per 1000 inhabitants. - Human resources: Doctors, nurses and midwives per 1000 inhabitants. | - COVID-19 deaths. | - Health: Comorbidities (% probability of death between 30 and 70 years of age due to chronic diseases). - Demographics: Proportion of population over 65 years of age, population density. - Economy: GDP per capita- Cultural/societal: Educational level, distance from power, governmental effectiveness. |
| Troisi et al. (2022) | Italian hospitals | -DEA. - Panel regression. | - Human resources: Number of doctors and nurses. - Hospital infrastructure: Number of beds. | - Number of COVID-19 patients hospitalized- Number of non-COVID-19 patients hospitalized- Number of non-hospitalized patients | - Technology and management: Telemedicine, home hospitalization, hospital networks, territorial medicine. - Financial: COVID-19 expenses per capita. |
| Almeida (2023) | 173 areas: 27 European countries and 4 countries in the European Free Trade Association | - DEA.- CRS (Constant Returns to Scale) | - Hospital infrastructure: Hospital beds per 100,000 inhabitants.- Human resources: Doctors and nurses per 100,000 inhabitants. | -Life expectancy. -Standardised survival rate.- Potential years of life not lost |
Source: own elaboration
Efficiency change by country.
Source: own elaboration
Infections outside China multiplied 13-fold, and the virus reached 114 countries, accumulating over 118,000 cases and 4,291 deaths (World Health Organization, 2020).
A more detailed description of this indicator is available on the World Bank's official website: https://databank.worldbank.org/metadataglossary/health-nutrition-and-population-statistics/series/SH.XPD.CHEX.GD.ZS.
For a detailed and official definition of the criteria used by the WHO to estimate COVID-19 mortality, see: https://www.who.int/news-room/commentaries/detail/estimating-mortality-from-covid-19
articles