


This study assessed the psychometric properties of the SOC-13 scale in a sample of 448 Peruvian college students aged 18-29 years old. Internal consistency reliability was estimated; criterion validity and factor structure analysis were also analyzed. Cronbach's alpha for the full scale was .80. The dimensional structure of the SOC was evaluated by means of Multidimensional Scaling and Confirmatory Factor Analysis. The former assessed goodness of fit of two proposed structure models namely a one factor solution against a three factor solution. An acceptable model fit was found for the three-factor solution (RMSEA=0.06, CFI=.92). SOC Correlations with Mental and Physical Health were r=.59, p<.001 and r=.40, p<.001 respectively. The SOC-13 scale showed appropriate psychometric properties regarding internal consistency, criterion validity and factor structure when tested in this Peruvian sample. Limitations were due to strong homogeneity within the sample, age range and non-representative sample size for all Peruvian population. Future studies should focus on further analyzing the SOC-13 structure and the ability of all items to properly measure Sense of Coherence in Peruvian young adults.
El propósito del estudio fue evaluar las propiedades psicométricas de la escala SOC-13 en una muestra de 448 universitarios peruanos con edades entre 18-29 años. La confiabilidad se calculó con el coeficiente de alfa de cronbach, y se encontró un .80 para toda la escala. La estructura interna del instrumento se evaluó mediante análisis de escalamiento multidimensional y análisis factorial confirmatorio. El análisis factorial confirmatorio se estimó comparando el ajuste de dos modelos propuestos, uno uni-factorial frente a uno de primer orden con tres factores. Se encontró un buen ajuste para la solución de tres factores (RMSEA=0.06, CFI=.92). Correlaciones entre SOC y salud mental y física fueron r=.59, p<.001 y r=.40, p<.001 respectivamente. El SOC-13 mostró propiedades psicométricas adecuadas con respecto a confiabilidad, validez de criterio y estructura factorial en esta muestra. Limitaciones se debieron a la homogeneidad en la muestra, edad y poca representatividad de la población Peruana. Estudios posteriores deberían enfocarse en analizar la estructura factorial del SOC-13 y la habilidad de cada ítem para medir adecuadamente Sentido de Coherencia en jóvenes peruanos.
Many years have passed since the American- Israeli medical sociologist Aaron Antonovsky introduced his Salutogenetic model by using a river metaphor to explain health and illness in the life course (Antonovksy, 1988). This model appears to be logical and has been used in a variety of health related disciplines including psychology, sociology, psychiatry, medicine, epidemiology, nursing and community health (Horsburgh & Ferguson, 2011). As proven by systematic reviews throughout the years, many studies have used the main concept of the Salutogenesis model, Sense of Coherence (SOC) (Antonovsky, 1993; Eriksson & Lindstrom, 2005).
Antonovksy, (1988) defined Sense of coherence as follows:
A global orientation that expresses the extent to which one has a pervasive, enduring though dynamic feeling of confidence that: (a) the stimuli deriving from one's internal and external environments in the course of living are structured, predictable and explicable; (b) the resources are available to one to meet the demands posed by these stimuli; and (c) these demands are challenges, worthy of investment and engagement. (p. 19)
Therefore, as described before the SOC concept is composed of three important components (a) Comprehensibility, (b) Manageability and (c) Meaningfulness, which are related to each other. These three components are within the person's Sense of Coherence (Antonovksy, 1988).
Comprehensibility is the ability to classify the information from the atmosphere and give a cognitive meaning to stimulus, which derives out of internal and external sources. Manageability describes how capable and what resources these people have to cope with a difficult situation. Meaningfulness is the ability to give emotional meaning to the situation. This helps people to be motivated and consider highly stressful situations as interesting and challenging. The third component is expected to be the most important, because without a motivational component and meaning, the ability to predict and cope with the environment becomes temporary (Antonovsky, 1990). However, this does not apply to all cases; in patients with primary myocardial infarction, Comprehensibility is more important than Meaningfulness for a greater Sense of Coherence (Bergman, Malm, Ljungquist, Bertero & Karlsson, 2012). For a strong SOC to progress, General Resistance Resources (GRR) should develop. These are individual, group or environmental characteristics that can facilitate effective tension or stress management (Antonovsky, 1979).
Systematic reviews have shown that SOC has proved to be a protective factor for mental health and for the development of a positive subjective state of both physical and mental health. In addition, it has been associated to a better quality of life and improved well being in patients and non-patients (Eriksson, & Lindstrom, 2006a; Eriksson, & Lindstrom, 2006b; Flensborg-Madsen, Ventegodt & Merrick, 2005). Furthermore, there is no strong evidence that suggests that negative life events decrease SOC. However, people who suffer negative life events could initially have a lower SOC than those who did not experience a negative life event (Hochwalder & Forsell, 2011). In spite of this, other studies have also found out that SOC becomes stronger as people get older because they gather more experience and lean more ways to cope with different situations (Lindstrom & Eriksson, 2005).
As previously stated, an extensive examination of the SOC concept and its measurement has been done throughout the years. Antonovsky (1993) summarized the research on the Sense of Coherence scale until 1992 and reported data from 42 different studies. SOC-29 or SOC-13 scales were used in every one of those studies. In that review study, feasibility, reliability construct and criterion validity were summarized and analyzed. Up to that date, SOC scales had been used in 14 different languages and over 4000 participants had completed the SOC-13 scale. In these reviews, the author found different factor structures but concluded that the SOC scale is more appropriate as a one-dimensional scale (Antonovksy, 1988); Antonovsky, 1993; Frenz, Carey & Jorgensen, 1993).
Afterwards, Eriksson & Lindstrom (2005) continued Antonovsky's work by systematically reviewing the SOC scale and analyzed studies from 1992 to 2003. The SOC questionnaire has been used in 127 studies, 33 languages and 32 countries with at least 15 versions of it. These authors settled that the Sense of Coherence scale seems to be a reliable and cross culturally appropriate instrument that measures how people can cope with stressful situations. Nevertheless, many different factor structures have been proposed in other studies, mainly testing a one-factor structure against a three-factor structure showing different results among different cultural contexts.
Nowadays, due to the confirmed validity and reliability of the SOC scale other techniques are starting to be used to measure and further understand Sense of Coherence. Griffiths, Ryan & Foster (2011) used a qualitative approach and found that SOC can also be measured using pictures with specific situations and with this technique it is possible to gather information about people's reflections on how they cope with everyday problems.
Even though SOC has been studied and used in multiple countries so far and to our knowledge SOC-13 has not been used in Peru. However, other measurements of SOC have been used in this context. For example, Arevalo's (2007) work is the only published paper in English using the SOC scale in Peru. In addition, Dejo's (2005) study is up to date the only published paper in Spanish using a SOC scale in this country. Both of these studies used the SOC-29 scale. Therefore, it is important to adapt a shorter and easier to use scale to measure this concept. Hence, the main objective of this research is to analyze the psychometric properties of the SOC-13 and examine its validity and reliability in a Peruvian sample.
MethodsParticipantsA sample of 448 of undergraduate students participated for this study. 262 of the participants were men (58%) and 186 (42%) were women. Their age ranged between 18-29 years old. The mean age was 21.3 years old (SD=1.95). Participants studied different undergraduate programs such as: Law, Engineering, Psychology, Architecture, Education, Business Administration and Philosophy. All of them were between the third and sixth year of studies. The survey took place in a private university from Lima, Peru. Even though the sample size was big enough to be representative of the institution the participants were not chosen randomly. Written informed consent was given to each participant.
InstrumentsThe Sense of Coherence Scale (SOC-29) was translated into Spanish for a doctoral research project with women in extreme poverty (Arevalo, 2007). Afterwards, this translation was used as model to translate the SOC-13 version. The SOC-13 scale has three components: Comprehensibility (items 2, 6, 8, 9, 11), Manageability (items 3, 5, 10, 13) and Meaningfulness (items 1, 4, 7, 12). This scale is rated on a 7-point likert scale, a total score can also be used and the coding for items 1, 2, 3, 7 and 10 should be reversed. SOC scores range from 13 to 91 (Antonovksy, 1988). The mean alpha of the SOC-13 scale was .82 (range=.74 - .81). Antonovsky (1993) concluded that content, construct and criterion validity were adequate. Eriksson and Lindstrom (2005) found that the SOC-13 scale had a Cronbach's Alpha that ranged from .70 to .92.
The SF-36 scale comprises 36 items in 8 scales organized into 2 big components, Physical Health and Mental Health. Higher scores indicate better physical and mental health (Ware, Snow, Kosinski & Gandek, 1993). Salazar and Bernabe (2012) validated the SF-36 scale for Peru and reached an internal consistency of .88. Furthremore, Confirmaotory factor analysis found an 8 first order and 2 order second order factor solution, χ2(551)=7207.5, p<0.001, CFI=.96 and RMSEA=.05. Standardized coefficients for the factor structure ranged between .71 and .90.
ProcedureInformed consent, the short form SOC scale, demographics form and SF-36 questionnaire were voluntarily completed during class time. The survey process took approximately 25 minutes. Instruments were administered anonymously and all questionnaires were maintained in a protected location.
Data AnalysesReliability, criterion validity and factor structure were used to analyze the psychometric properties of the scale. To test reliability, item total correlation and internal consistency of the SOC-13 were assessed. Cronbach's alpha coefficient was used on the entire scale and for each theoretical subscale. A minimum value of .70 is considered acceptable for this coefficient on the entire scale (George & Mallery, 2003). The SF-36 scale was used to test for criterion validity. Pearson correlations were used to examine SOC-13 scores and Mental and Physical components of the SF-36 scale. The same analysis was made between each subscale and total SOC score to examine validity within the scale. Cohen's criterions were used to interpret the correlations (Cohen, 1988). Later, to assess the internal structure of the instrument a one-factor confirmatory factor analysis (CFA) was performed and compared against a first order three-factor model. For this analysis the statistical software Mplus 6.12 with Maximum Likelihood Estimations was used. Furthermore, an ordinal Multi-Dimensional Scaling (MDS) analysis of 2 dimensions was performed to analyze itembehavior. For this analysis R studio version 0.97.551 and package smacof were used. SOC-13 reversed items were recoded prior to analysis.
ResultsDescriptive statisticsMean scores for total SOC were 59.75 with a SD=11.19. Mean scores from each item had a range from 3.63 to 5.52. Item 4 had the greatest mean score and item 2 had the lowest mean score of all items. Standard deviations (SD) scores ranged between 1.21 and 1.85. Item 7 showed the lowest SD and item 9 had the largest SD. Mean score for Comprehensibility subscale was 21.30 with a SD=5.21, each item had a mean range from 3.62 to 4.78. Standard deviations (SD) scores ranged between 1.46 and 1.85. Manageability subscale mean score was 18 and a SD=4.23. Each item had a mean range from 4.10 to 5.10. Standard deviations (SD) scores ranged between 1.47 and 1.66. Finally, Meaningfulness had a mean score of 20.4 and a SD=4.02. Each item had a mean range from 4.93 to 5.52. Standard deviations (SD) scores ranged between 1.21 and 1.71.
Internal consistencyReliability tests showed a Cronbach's alpha of .80 for the SOC-13 overall scale, which means that the scale has a good internal consistency. Comprehensibility subscale had a .63 reliability coefficient; meanwhile Manageability had a .59 and Meaningfulness .61. It is important to remember that internal consistency is partially dependent upon the number of items analyzed and may have diminishing returns (George & Mallery, 2003). Item-test correlations varied from .30 (item 2) to .61 (item 9).
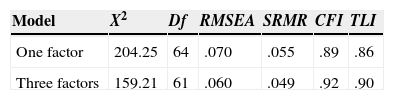
Factor structureCFA was estimated to compare the one factor solution against the three theoretical factors solution of Sense of Coherence. Both models showed a significant χ2 that could be attributed to the large sample size. Considering other fit indices, it is stated that the one factor model lacked congruence with the sample indicating a non-acceptable model fit and that the three factor model showed an acceptable fit with the sample. Model fit indices for both models are shown in Table 1.
The recommended cutoff point for standardized factor loadings in CFA is 0.40. Meaning that only factor loadings with an explained variance of 16% or higher should be interpreted (Stevens, 1992). Standardized factor loadings for both models showed the following results: in the one factor solution, standardized factor loadings were as follows: item 1=.35, item 2=.27, item 3=.37, item 4=.44, item 5=.36, item 6=.47, item 7=.40, item 8=.68, item 9=.70, item 10=61, item 11=.37, item 12=.66 and item 13=.61. Five problematic items were found (items 1, 2, 3, 5, 11) that did not meet the cutoff point .40. A model generating approach was used (Byrne, 2012) and therefore an error correlation was allowed between items 2 and 3 (r=.48, p=< .001).
In the three factor solution standardized factor loadings were as follows: in Comprehensibility, item 2=.29, item 6=.48, item 8=.69, item 9=.72 and item 11=.36. In Manageability factor loadings were as follows: item 3=.41, item 5=.38, item 10=.63 and item 13=.64. Finally, Meaningfulness, factor loadings were as follows: item 1=.38, item 4=.50, item 7=.50 and item 12=.77. Overall, items 1, 2, 5 and 11 did not meet the cutoff point .40.
Very strong and positive correlations between factors were found on this model. Manageability had a correlation with Comprehensibility of r=.95, p< 0.001 and with Meaningfulness of r=.74, p< 0.001. Meanwhile, Comprehensibility had a correlation with Meaningfulness of r=.79, p< 0.001.
To further interpret the results, an additional ordinal Multi-Dimensional Scaling (MDS) analysis with 2 dimensions was carried out. A transformed matrix of item correlations (Pearson coefficients) into dissimilarities was used. The results of the MDS approach show the Euclidean distances between items, and the location of each item in the low-dimensional space (2D). This graphical representation of the underlying structure of the SOC-13 items is shown (Figure 1). The general non-metric stress for the MDS solution (2D) was 0.34. Non-metric stress per point (SPP) shows that the items with higher stress per point (indicating least representation in the plot) were the same items that were found not to meet the cutoff point for factor loadings in the one factor CFA solution (items 1, 2, 3, 5, 11) and three factors CFA solutions (items 1, 2, 5, 11). These would imply additional and strong evidence for the low performance of these items. Item 4 had a stress point of .022, item 11 had a stress point of .019, item 1 had a stress point of .019, item 7 had a stress point of .018 and finally item 5 had a stress point of .015. In addition, the correlation between item 2 and 3 (as stated in the one factor model) is also made clear in the figure by showing this 2 items clustered together and separate from the rest. This figure also shows that all the Meaningful factor items are relatively clustered on the upper right section far apart from the items of the others factors. In the case of Comprehensibility and Manageability factors the division did not appear to be so clear. Only two items from each of these factors were clearly near and related to each other (Items 8 and 9 in Comprehensibility) and (Items 10 and 13 in Manageability).

CFA and MDS showed that a three factor solution was a better model fit for the Peruvian sample. Furthermore, these analyses also showed that a one factor solution was not an acceptable model fit. Therefore, for psychometric and theoretical reasons (Antonovsky, 1988; Antonovsky, 1993; Frenz, et al., 1993) it would be better to use a three factor solution when using the SOC-13 scale (copy of the instrument in additional supplemental materials). Nevertheless, it is important to consider that some items did not perform accurately in the Peruvian sample, and therefore further qualitative and item-content assessment is recommended.
Criterion validityAs for criterion validity SOC scores had a positive and significant (r=0.59, p<0.001) correlation with Mental Health component. This component shows a moderate but near to strong relationship. Moreover, Comprehensibility and Manageability also had a positive and moderate relationship with Mental Health component (r=0.54, p<0.001) and (r=0.52, p<0.001). Meaningfulness also had a positive relationship with this component but it was less strong than the ones previously mentioned (r=0.38, p<0.001).
Furthermore, SOC scores showed a positive and significant (r=.34, p<0.001) correlation with Physical Health component. Meanwhile, this component has a weak but near to moderate relationship (r=.40). Additionally, Comprehensibility and Manageability had also positive and weak relationship with the Physical Health component (r=0.33, p<0.001) and (r=0.31, p<0.001). On the other hand, Meaningfulness had also a positive but weak relationship with this component but much lower than the previously mentioned (r=0.18, p<0.001).
Moreover, there were positive and significant correlations with overall SOC scores and Comprehensibility (r=.89, p< 0.001), Manageability (r= .84, p< 0.001) and Meaningfulness (r=.74, p< 0.001). This shows that overall SOC scores have a strong relationship with Meaningfulness and very strong relationship with Comprehensibility and Manageability.
DiscussionThis is the first study assessing the performance of the SOC-13 scale among Peruvian young adults. SOC-13 showed adequate properties in terms of internal consistency construct validity and factor structure. These findings can only be applied to college students and not among other specific populations. In this case, it is relevant to have valid instruments to measure Sense of Coherence, because a strong SOC can be associated with the development of better health (Antonovsky, 1988). Furthermore, in students SOC has been found to be a significant predictor of better states of mental and physical health (Saravia, 2013). Some studies have shown that students tend to suffer from physical symptoms such as headaches and fatigue due to stress (Barraza, 2006; Boullosa, 2013; Mikklesen, 2009) and that they are really concerned with their ability to manage stressful situations (Reynolds, 2013), which impacts their health. Therefore, having a valid instrument of a construct that enhances better overall health could be relevant in order to have a precise measurement of a coping ability that helps students reduce their stress.
Reliability for the SOC-13 was higher than George and Mallery's (2003) recommended standard of .70. Similar results were found in other contexts and samples, such as elder Spanish and Italian population, middle age people from Netherlands, Brazilian women, Iranian college students and South African factory workers with a SOC-11 version. In these cases, reliability ranged between .71 and .80 (Bonnato, et al., 2009; Mahammadzadeh, Poursharifi & Alipour, 2010; Naaldenberg, Tobi, Van den Esker & Vaandrager, 2011; Sardu, et al., 2012; Van Schalkwyk & Rothmann, 2008; Virues-Ortega, et al., 2007). Comprehensibility, Manageability and Meaningfulness were lower than the standard (.70), these results were higher than the ones from Iranian College students (Mahammadzadeh, et al., 2010). This could indicate that lower internal consistency might be due to the number of items instead of an inadequate reliability of the subscales. The number of items in each subscale could have affected these results since small amount of items can diminish the internal consistency of the scale (George & Mallery, 2003). In general, SOC-13 scale has adequate reliability and is similar to other contexts and studies that worked with analogous and different samples.
In the factor structure analysis, a one factor global score solution designed by using the 13 items (Antonovsky, 1988) was established as first alternative. Regardless of the fact that this was the theoretical model proposed by Antonovsky (1988), these results did not show a good model fit. Another study using a Spanish version of the SOC-13 scale also reported an inadequate model of fit for the one factor solution (Virues-Ortega, Martinez-Martin, Del Barrio & Lozano, 2007). Assessing local misfit, specific items were found not to meet the pre-established cutoff point.
In a second step of the factor structure analysis, a three factor solution by using the theoretical scales (Antonovsky, 1988) was established as another possible alternative. These findings were similar to Larsson & Kallenberg, (1999) and Naaldenberg et al., (2011); however, items assigned for each factor in those studies proved to be different than the ones shown in the present study. Furthermore, the results of this study clearly showed that the theoretical three-factor solution does have a good model fit. Nonetheless, local misfit was still an issue, as some items did not meet the .40 cutoff point for acceptable factor loadings.
Overall, it is interesting that in the three factor structure items regarding not caring about the environment, being surprise by how people acted, being treated unfairly or under estimating situations (items 1, 2, 5, 11) were the ones that did not perform well in the model. All this situations resembles a lower SOC (Antonovsky, 1988). Educational settings are good environment to strength SOC and look at the world as predictable, manageable and meaningful (Antonovsky, 1979; Antonovsky, 1988). Future studies could have a qualitative approach and further study why this items did not fit well in the three factor model and why they do not contributed to measuring SOC in this sample.
Consequently, due to psychometric and theoretical reasons a three factor structure should be used to assess Sense of Coherence with the SOC-13 scale in Peruvian population. Findings partially confirm what Antonovsky (1993) stated; Sense of Coherence has three theoretical subscales, but the instrument is not structured in one global dimension and a score for each area is recommended. These findings are different to other studies (Amirkhan & Greaves, 2003; Frenz, et al., 1993; Gana, 2001; Hart, Hittner & Paras, 1991; Hittner, 2007; Klepp, Mastekaasa, Sorensen, Sandanger & Kleiner, 2007). Regardless of the similarity with Antonovsky's theoretical proposal, this does not mean that the SOC-13 scale is yet the best suitable scale to measure Sense of Coherence in this group. In spite of having an adequate model fit, there are some items that still have problems. These might be the result of an unclear separation of the three subscales and items, for example items 2 (Comprensibility) and 3 (Manegeability) were strongly related to each other. Also, there were strong correlations between each subscale. This hypothesis could resemble Larsson, & Kallenberg, (1999) findings which found that the comprehensibility component also had meaningfulness-related characteristics. Therefore, future studies should further address the psychometric properties of the SOC-13 and evaluate this scale in other contexts and samples. Furthermore, a possible assessment of each item could also help gather more information about which items are more problematic and propose a possible change in phrasing in order to better adapt them for young people.
Criterion validity showed important relationships between overall SOC scores, Comprehensibility, Manageability and Meaningfulness scores and Mental Health but not as strong with Physical Health. Results are consistent with a systematic review of previous studies, which indicates similar results on the relationship between SOC and Mental Health (Eriksson, & Lindstrom, 2005). Likewise, these findings are comparable to Flensborg-Madsen, et al. (2005) results. Sense of Coherence has a stronger association with Mental Health than Physical Health. A possible explanation is that the SOC-13 scale has the notion of life as predictable; if this notion were to be eliminated then a stronger relationship between SOC and Physical Health could be assessed (Flensborg-Madsen, et al., 2006). This study showed high and very high correlations between total SOC scores and Comprehensibility, Manageability and Meaningfulness. These findings proved to be similar to the sample of college students in Iran (Mahammadzadeh et al., 2010), which showed that despite of the differences in languages, SOC subscales are related to total scores in both cases.
This study had some limitations to take notice. A larger sample with greater cultural differences could have given more insights about Sense of Coherence in Lima. The sample was not chosen randomly and all participants were college students with minor differences in age. In future studies, a representative and randomly assigned group might help increase diversity and reduce biased results due to specific sample features. This might be useful for getting a further explanation about Sense of Coherence in Peruvian population. Likewise, test-retest analysis, discriminant analysis, a qualitative approach and further revision of each item of the scale may also give further information about the structure of the SOC-13. This could help further understand which items are more useful and which ones are not in this population. Additionally, future studies could follow the path of Lerdal et al. (2014) and evaluate the psychometric properties of this scale by using item response theory and Rasch analysis.
Finally, SOC-13 scale revealed to have adequate reliability, factor structure and criterion validity but some items still need further revision in a Peruvian sample. Therefore, a three-factor structure could be used and is recommended in order to measure Sense of Coherence. This conclusion was made due to theoretical reasons, resemblance to Antonovsky's proposal and the fact that this factor solution was the best achieved model fit. Regardless of these interesting results, limitations may have restricted further findings. Therefore, it is important to keep working on different aspects of SOC questionnaires using quantitative and qualitative approaches to increase knowledge about the SOC-13 scale in order to get a better instrument, which can measure Sense of Coherence more precisely in this and other Peruvian samples.