


In the last decades, Mexico has experienced important forest loss and degradation processes in both temperate and tropical forests (Mas et al., 2004; Velázquez et al, 2010). According to FAO (2010), deforestation rates in Mexico were 0.5% (354 000 ha/year) during the period 1990-2000, and 0.2% (155 000 ha/year) in 2005-2010. Wildfires, urbanization, excessive logging, the extension of areas dedicated to agriculture and livestock raising are the main causes of this phenomenon. The most important consequences of the loss of forest cover include the reduction in the environmental assets and services provided by ecosystems, global warming, alteration of biogeochemical and hydrological cycles, soil degradation and habitat loss (Velázquez et al., 2010).
During the last decades, significant efforts have been made to evaluate the rates of forest change in Mexico. These studies provide information about the changes that occurred during periods prior to the study. For example, the latest official report of the National Forestry Commission (Comisión Nacional Forestal, CONAFOR) about deforestation in Mexico is based on the land use and vegetation maps corresponding to Series IV and V, elaborated by the National Institute of Statistics and Geography (Instituto Nacional de Estadística y Geografía, INEGI) with images captured in 2007 and 2011, respectively. Although these studies provide valuable information to assess land use /cover change processes, the large time elapsed between the image acquisition and the detection of change areas make them unsuitable for taking immediate action regarding these processes of change. This requires relying on change detection systems based on a continuous or very frequent monitoring of changes.
Some near-real time deforestation detection systems have been developed by taking advantage of the very high temporal resolution of sensors such as MODIS (daily images). For example, the DETER system (Shimabukuro et al., 2011, 2012, Sistema de Detecção do Desmatamento na Amazônia Legal em Tempo Real,http://www.obt.inpe.br/deter/) enables the monitoring of deforestation in the Amazon. The system operates on a daily basis and delivers deforestation alert maps to the Brazilian Institute of Environment and Renewable Natural Resources (IBAMA) between one and five days after the date of acquisition of the MODIS image. However, the low spatial resolution of the sensor makes impossible to detect the smallest deforestation patches. Shimabukuro et al. (2006) report that the DETER system fails to detect deforestation areas of less than 15 ha, and identifies only one-third part of the deforested areas between 15 and 50 ha. In Mexico, where most deforested areas are small, this limitation is a major drawback. Detection systems of hot spots in near-real time, such as the Rapid Fire Detection Program of the National Commission for the Knowledge and Use of Biodiversity (CONABIO, 2016) could prove extremely useful to supplement a more robust system, for the detection of wildfires or even deforestation that includes data of higher spatial resolution (Cruz-López et al., 2011).
Until recently, the improvement in the temporal resolution of satellite images represented a loss of spatial resolution, with sensors that cover a very wide strip of land over a short revisiting time, but with images of a considerably lower spatial resolution. The recent creation of satellite constellations allows capturing both spatially and temporary high-resolution images. This technical note outlines the main characteristics of the Sentinel missions along with a simple application of the data derived from the Sentinel-2 satellite, and briefly discusses the potential and limitations of this type of data for forest monitoring in Mexico.
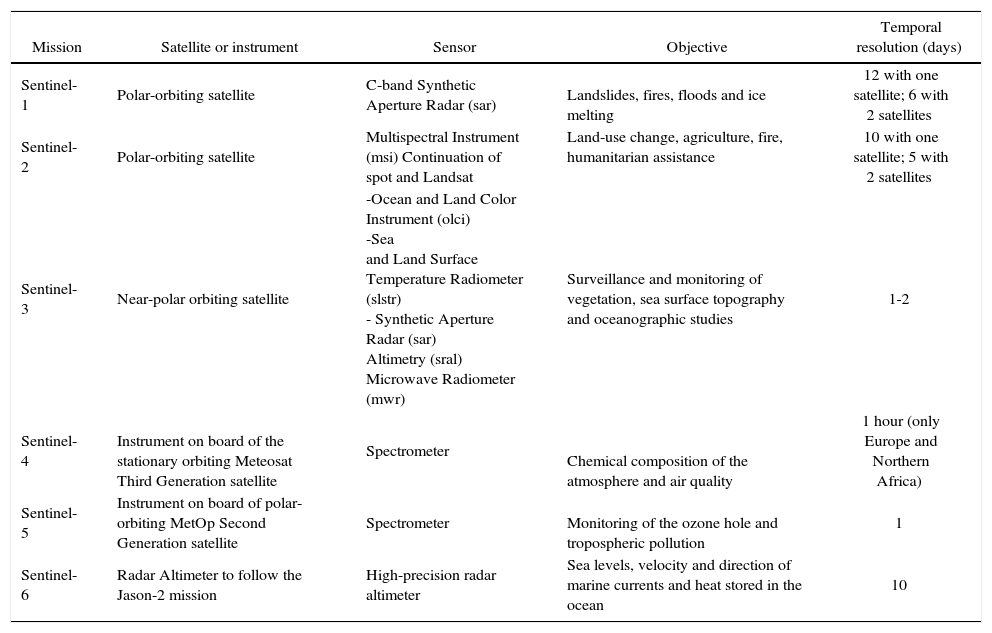
The sentinel missions of the Copernicus programThe European Space Agency (ESA) is currently developing six satellite missions known as Sentinel, which are intended to provide data about the Earth, the ocean and the atmosphere for environmental monitoring and surveillance of climate change for the European Copernicus program (previously known as GMES program, Global Monitoring for Environment and Security; Table 1).
Characteristics of the satellites of Sentinel missions.
| Mission | Satellite or instrument | Sensor | Objective | Temporal resolution (days) |
|---|---|---|---|---|
| Sentinel-1 | Polar-orbiting satellite | C-band Synthetic Aperture Radar (sar) | Landslides, fires, floods and ice melting | 12 with one satellite; 6 with 2 satellites |
| Sentinel-2 | Polar-orbiting satellite | Multispectral Instrument (msi) Continuation of spot and Landsat | Land-use change, agriculture, fire, humanitarian assistance | 10 with one satellite; 5 with 2 satellites |
| Sentinel-3 | Near-polar orbiting satellite | -Ocean and Land Color Instrument (olci) -Sea and Land Surface Temperature Radiometer (slstr) - Synthetic Aperture Radar (sar) Altimetry (sral) Microwave Radiometer (mwr) | Surveillance and monitoring of vegetation, sea surface topography and oceanographic studies | 1-2 |
| Sentinel-4 | Instrument on board of the stationary orbiting Meteosat Third Generation satellite | Spectrometer | Chemical composition of the atmosphere and air quality | 1 hour (only Europe and Northern Africa) |
| Sentinel-5 | Instrument on board of polar-orbiting MetOp Second Generation satellite | Spectrometer | Monitoring of the ozone hole and tropospheric pollution | 1 |
| Sentinel-6 | Radar Altimeter to follow the Jason-2 mission | High-precision radar altimeter | Sea levels, velocity and direction of marine currents and heat stored in the ocean | 10 |
Among the six missions, the Sentinel-IA, Sentinel-IB and Sentinel-2A satellites are already operating (Figure 1). Each of these missions -and those to be launched in the future- are intended to support the monitoring of particular phenomena (Table 1). Although the number of Sentinel data users is currently increasing, these images are poorly known by many sectors.

Sentinel-1 is a mission equipped with a Synthetic Aperture Radar (SAR) operating at C-band, able to acquire data during day and night under all weather conditions. It offers a short revisiting period with prompt products delivery, at different resolutions (up to 5 m) and coverage (up to 400km). Sentinel-1 operates in four acquisition modes named “Strip map”, “Interferometric Wide Swath”, “Extra Wide Swath” and “Wave Mode”. It provides a dual polarization capacity: horizontal (H) and vertical (V). In general, HH and HH-HV polarizations aim at monitoring the polar regions and sea ice, while VV-VV and VH polarizations encompass all other observation areas (ESA, 2013). With these modes and polarization modalities, Sentinel-1 implements a predefined and preprogramed observation scenario to provide data with preference to the European Union member states. It ensures the continuity of the ERS/Envisat missions, considering the requirements of the scientific community, international partners and cooperation activities.
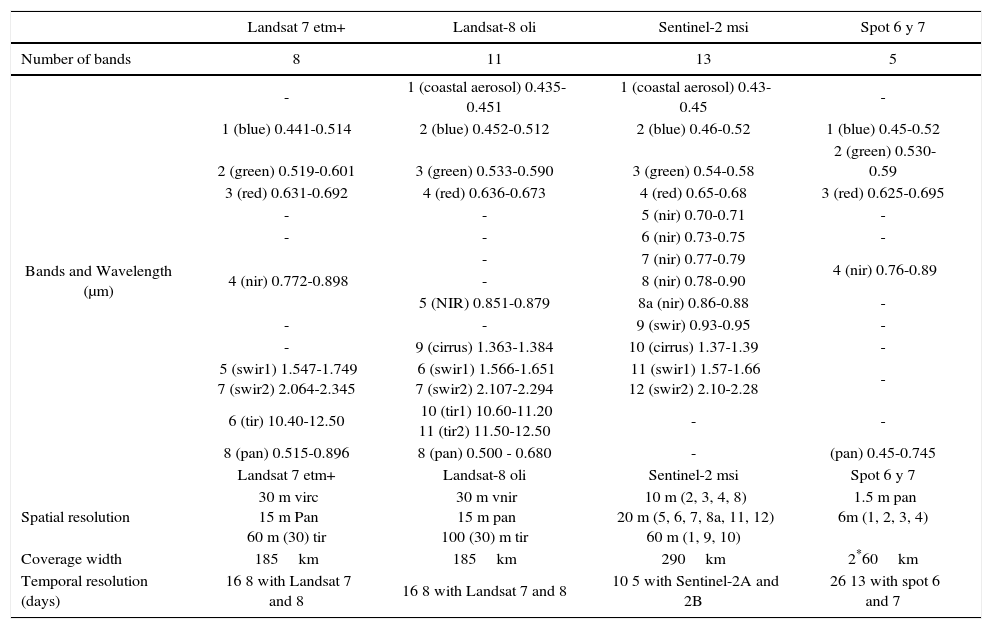
The Sentinel-2 mission is dedicated to environmental monitoring, land use / cover changes, agriculture and response to natural disasters. Its relevance lies in providing continuity to SPOT and Landsat missions, but also improving the spatial and temporal resolution of these missions. As shown in Table 2, the Sentinel-2 visible and near infrared bands are very similar to the bands of the two active Landsat satellites (7 and 8) and SPOT 6 and 7. The Sentinel-2 mission is more similar to Landsat than to SPOT, except for the spectral thermal band of Landsat.
Characteristics of Landsat 7 and 8, Sentinel-2 and spot 6 and 7 satellites (adapted from Duro Santos and Gonçalves, 2014).
| Landsat 7 etm+ | Landsat-8 oli | Sentinel-2 msi | Spot 6 y 7 | |
|---|---|---|---|---|
| Number of bands | 8 | 11 | 13 | 5 |
| Bands and Wavelength (μm) | - | 1 (coastal aerosol) 0.435-0.451 | 1 (coastal aerosol) 0.43-0.45 | - |
| 1 (blue) 0.441-0.514 | 2 (blue) 0.452-0.512 | 2 (blue) 0.46-0.52 | 1 (blue) 0.45-0.52 | |
| 2 (green) 0.519-0.601 | 3 (green) 0.533-0.590 | 3 (green) 0.54-0.58 | 2 (green) 0.530-0.59 | |
| 3 (red) 0.631-0.692 | 4 (red) 0.636-0.673 | 4 (red) 0.65-0.68 | 3 (red) 0.625-0.695 | |
| - | - | 5 (nir) 0.70-0.71 | - | |
| - | - | 6 (nir) 0.73-0.75 | - | |
| 4 (nir) 0.772-0.898 | - | 7 (nir) 0.77-0.79 | 4 (nir) 0.76-0.89 | |
| - | 8 (nir) 0.78-0.90 | |||
| 5 (NIR) 0.851-0.879 | 8a (nir) 0.86-0.88 | - | ||
| - | - | 9 (swir) 0.93-0.95 | - | |
| - | 9 (cirrus) 1.363-1.384 | 10 (cirrus) 1.37-1.39 | - | |
| 5 (swir1) 1.547-1.749 7 (swir2) 2.064-2.345 | 6 (swir1) 1.566-1.651 7 (swir2) 2.107-2.294 | 11 (swir1) 1.57-1.66 12 (swir2) 2.10-2.28 | - | |
| 6 (tir) 10.40-12.50 | 10 (tir1) 10.60-11.20 11 (tir2) 11.50-12.50 | - | - | |
| 8 (pan) 0.515-0.896 | 8 (pan) 0.500 - 0.680 | - | (pan) 0.45-0.745 | |
| Landsat 7 etm+ | Landsat-8 oli | Sentinel-2 msi | Spot 6 y 7 | |
| Spatial resolution | 30 m virc 15 m Pan 60 m (30) tir | 30 m vnir 15 m pan 100 (30) m tir | 10 m (2, 3, 4, 8) 20 m (5, 6, 7, 8a, 11, 12) 60 m (1, 9, 10) | 1.5 m pan 6m (1, 2, 3, 4) |
| Coverage width | 185km | 185km | 290km | 2*60km |
| Temporal resolution (days) | 16 8 with Landsat 7 and 8 | 16 8 with Landsat 7 and 8 | 10 5 with Sentinel-2A and 2B | 26 13 with spot 6 and 7 |
nir= near infrared, swir= short-wave ir, tir= thermal infrared, vnir= visible near-infrared, and pan = panchromatic.
With the integrated mission of SPOT 6 and SPOT 7, the imagery acquisition capacity has increased to the extent that any point of the Earth can be observed every day at high resolution. Actually, depending on the acquisition angles, the temporal resolution ranges between one day and thirteen days. The spatial resolution of multispectral bands of these satellites is 6 m, except for the panchromatic band. However, SPOT images are not freely accessible which represents a limitation on the use of such data.
Satellites Landsat 7 and Landsat 8 have a 16-day orbital cycle. The spatial resolution of multispectral and panchromatic bands is 30 m and 15 m, respectively. Therefore, Landsat missions are exceeded by Sentinel-2 in both temporal and spatial resolution. However, the historical archive of the Landsat scenes will continue being useful and may be supplemented with Sentinel images. Optical images derived from Sentinel-2 could revolutionize the studies of Earth's surface, since images with such high spatial, temporal and spectral resolutions have never been freely available.
The Sentinel-2 mission consists of a constellation of two identical satellites in the same orbit (Sentinel-2A and Sentinel-2B) to optimize terrestrial coverage, making possible a high temporal resolution. With a single satellite, the revisiting period is ten days at the equator, and with both satellites, it is five days; this period is reduced to 2-3 days at medium latitudes. The spatial resolution of Sentinel-2 is 10 m, 20 m and 60 m, depending on the spectral bands (Table 2). Under optimal operation, the Sentinel-2 mission provides a broad coverage, including continental land areas, coastal waters, islands and inland seas, assuring the total coverage of Latin America (ESA, 2015).
Sentinel-2 data are available for users at three processing levels:
- •
1B:radiometric correction at the top of the atmosphere (radiance values) in the sensor's geometry.
- •
1C: radiometric correction at the top of the atmosphere (relectance values) with carto-graphic geometry that includes elevation data (ortho-rectification) and masks of land, water bodies and clouds.
- •
2A: radiometric correction at the bottom of the atmosphere (reflectance values) with cartographic geometry that includes elevation data (ortho-rectification) and a basic classification of pixels (including classes for the different types of clouds; ESA, 2015).
One of the advantages of the Sentinel missions is the free availability of imagery through various platforms. Images can be obtained from the Copernicus scientific center website (https://scihub.copernicus.eu/), from the USGS EarthExplorer server (http://earthexplorer.usgs.gov/), by using scripts in python consoles, and from open-code plugins available for different Geographical Information Systems, such as QGIS (http://www.qgis.org/). The interest in using these plugins is that users are able to download subsets of interest (granules), and save processing time and data space. In addition, they enable users to perform automated processing of images while downloading them.
Quantifying a wildfire in near-real timeA series of wildfires occurred from 28 April to 3 May 2016 in Cerro de la Cruz, an important protected natural area adjacent to Uruapan city in the state of Michoacan. These wildfires gave rise to confusion and suspicion in the population because it is hypothesized that these were caused intentionally, possibly to facilitate land use change from forest to avocado orchards. CONAFOR reported a preliminary area of 250 ha of forest affected by fire.
A Sentinel-2 image taken on 5 May was made available to users the next day. Its immediate interpretation allowed to delimit the area affected by wildfire, which was evaluated in 460 ha (Figure 2). The interpretation of an image captured before the wildfire allowed determining that the fire affected approximately 370 ha of forested areas and 90 ha of herbaceous and shrub areas.
 and after (right) the wildire. he forest area of Cerro de la Cruz is marked in black and the area afected by ire in yellow. Composite 12-8-2 of the Sentinel-2 image, highlighting the vegetation cover in green; areas afected by wildire in black and urban infrastructure in white-purple.")
Cerro de la Cruz before (left) and after (right) the wildire. he forest area of Cerro de la Cruz is marked in black and the area afected by ire in yellow. Composite 12-8-2 of the Sentinel-2 image, highlighting the vegetation cover in green; areas afected by wildire in black and urban infrastructure in white-purple.
Images from the Sentinel missions have features that make them useful for monitoring deforestation. Particularly, the images are freely available for download soon after being acquired. Furthermore, the temporal and spatial resolution of images provide the ability to develop an automated deforestation monitoring system, including treatment through combinations of the different types of Sentinel images (for example, radar and optical imagery).
However, it is important highlight that developing automated systems can lead to errors due to the complexity of the landscape, as in the case of Mexico, and spectral confusion between the various types of land cover (Mas et al, 2016). In most cases, such systems produce maps of areas that could have possible changes. These processed images should be analyzed through visual interpretation and, in some cases, supplemented with field data to differentiate patches of deforestation from other types of change (phenological changes, for example). The detection model would have to be calibrated to balance between errors of omission and commission. Highly conservative systems might limit the number of commission errors (false alerts), but might omit true deforestation. By contrast, sensitive systems may detect most cases of deforestation with a large amount of false changes.
In this regard, a detection system based only on remote sensing data might yield unreliable results. Therefore, the collection of field data in near-real time is also essential to evaluate and supplement the information obtained through remote sensing. To this end, the use of citizen participation systems represents a great potential (IPGH, in press). For example, Pratihast et al. (2016) and DeVries et al. (2016) described a monitoring system of forests in near-real time based on the web and implemented in the Kafa biosphere reserve, in Ethiopia. The system employs four geographic information levels: 1) continuous acquisition of remote sensing data and community monitoring carried out using mobile devices; 2) near-real time detection of forest disturbance based on the analysis of satellite data time series; 3) presentation of forest disturbance data through a web application and social media, and 4) interaction between forest disturbance alerts and the community of users to improve field data collection. The data obtained by local experts include the characterization of changes, its geographical location and photographs obtained with mobile phones equipped with a GPS. The authors conclude that supplementing remote sensing data with information recorded by the community allowed a substantial improvement of a monitoring system based only on remote sensing data.
ConclusionsDue to their characteristics, the images captured by Sentinel satellites have a large capacity in monitoring dynamic phenomena of the Earth's surface, such as deforestation. The free availability of new sources of remote sensing data with high temporal, spectral and spatial resolution, as well as the emergence of new technologies such as mobile phones equipped with cameras and GPS, are changing the way of monitoring environmental processes, such as land use / cover change.
These new conditions offer the opportunity to advance from centralized delayed-response systems managed by specialists in government agencies or academic institutions, to more flexible systems (in near-real time) that are more democratic since they incorporate the knowledge from more sectors of society. Such systems are both promising and challenging, considering that they represent a source for collecting huge amounts of data. Therefore, the quality of the resulting information may be difficult to control. It is crucial that governments continue supporting free access to information obtained through new technologies. As a result, the number of users, potential applications and information available will grow considerably, allowing detailed consistent studies on the monitoring of environmental changes.