


The tropical dry forest is an ecosystem that is undergoing rapid changes. Although global driving forces behind these changes have been addressed at a local scale, spatio-temporal dynamics are still largely unknown. The main objective of this study was to identify the causes governing the dynamics of changes in land use and land cover in the tropical dry forest in two municipalities in Southern México. Satellite imagery and air photographs were used in a gis context to produce maps of land use and land cover for 1985, 1995 and 2006. A number of statistical methods (Markov chains, general lineal models and regression tree analysis) were applied to identify the proximate and the underlying causes of deforestation, agriculture being the most important one. When agriculture is mainly for self consumption, topographic factors determine its location. Increasing job opportunities in the tourism sector has resulted in the abandonment of agricultural land; consequently, the forest has recovered. Different studies have examined the dynamics of local deforestation and its driving forces in México; however, this study considered both spatial and temporal elements in order to identify the most important underlying driving forces of deforestation and its dynamics at local scale, and also compared two neighboring municipalities.
La selva baja caducifolia es un ecosistema que está presentando grandes cambios. A pesar que a nivel global se han estudiado las fuerzas conductoras del cambio de uso de suelo, a escala local las dinámicas espacio-temporales son ampliamente desconocidas. El objetivo principal de este estudio fue identificar las fuerzas conductoras de los cambios de uso y coberturas del suelo en la selva baja caducifolia en dos municipios al Sur de México. Para alcanzar dicho objetivo fueron utilizadas imágenes satelitales y fotografías aéreas dentro de un SIG, para producir los mapas de uso y de coberturas del suelo para los años 1985, 1995 y 2006. Diferentes métodos estadísticos (cadenas de Markov, modelos lineales generalizados y análisis por regresión de árbol) fueron empleados para identificar las causas próximas y subyacentes de la deforestación, donde resalta la agricultura como la más importante de ellas. Las actividades agrícolas, principalmente la de autoconsumo están delimitadas espacialmente por las características topográficas del terreno. El incremento de las oportunidades de trabajo vinculadas con el sector turístico han resultado en el abandono de las actividades agropecuarias, favoreciendo al regeneración y recuperación del bosque. En México diferentes estudios han examinado las dinámicas locales de la deforestación y las fuerzas conductoras, sin embargo, este estudio considera tanto la escala espacial como la temporal fueron claves para identificar las causas subyacentes más importantes de la deforestación, la dinámicas a escala local y la comparación entre dos municipios vecinos.
Changes in land cover, including high deforestation rates, are considered to be the main drivers leading to environmental degradation, land fragmentation and loss of biodiversity at a global scale (Lambin et al., 2001). Global deforestation in the tropics is a consequence of changes in land cover at local and regional scales, due to socio-economic, demographic and biophysical factors that explain the spatial land-use patterns in this ecosystem (Pan et al., 2004; Lambin y Mayfroidt, 2011). Spatial differences in the patterns of land use emerge because not all uses are equally profitable; soil quality, access and distance induce revenue losses and differ in each case (Bakker y Veldkamp 2012).Therefore, local-scale analyses are needed to identify the proximate causes and drivers of changes in land use and land cover, and of deforestation (Bonilla-Moheno et al, 2012; Pan et al., 2004). In this context, localscale studies on land-use and land-cover changes utilize detailed information about productive and/ or family units to identify, analyze and/or explain in detail the causes of land-use and land-cover changes, as observed in municipalities.
Lambin et al. (2003) suggest that the drivers of land-use and land-cover change in general, and deforestation in particular, can be divided into proximate and underlying causes. The proximate causes directly affect the vegetation cover; examples include the introduction of agriculture and pastures (Lambin et al., 2003). The underlying causes work at a different scale and influence one or more proximate causes; these include socio-economic, political, technological, natural and cultural factors (Bürgi et al., 2004). Methods for analyzing the dynamics of land-use and land cover change estimate deforestation rates and tendencies, and determine the causes of those changes (Lambin et al., 2003). Although some studies have attempted to explain these dynamics through biophysical variables (Hietel et al., 2005), others have focused on social, political and economic factors (Evangelista et al, 2010; Velasco-Murguía et al, 2014), and some others have integrated spatial and temporal drivers in order to understand land-use and cover change at a local scale (Geoghegan et al., 2004; Chowdhury & Turner 2006; Schoreder & Castillo 2013).
The tropical dry forest (TDF) is the dominant vegetation type among tropical forests (42% of total tropical forest area) (Portillo-Quintero et al, 2010), also being the forest type most severely affected by human-induced environmental degradation (Janzen, 1986). The main threat to TDF is its rapid conversion into agricultural land and cattle ranches (Houghton et al., 1991; Janzen, 1986). In México, the TDF deforestation rate reached 1.9% per year during 1977-1992, mainly in the south of the country (Porter-Bolland et al., 2007). On the other hand, different studies have investigated the dynamics of TDF deforestation and the changes in land use and land cover associated with it, mainly at a regional scale even though the local scale is crucial to explain land-change issues (Pan et al., 2004). Moreover, although the local deforestation approach does not seem novel, understanding the underlying causes of land use and land cover change in different regions and at various scales provides critical information for public policy and land management.
Research at a local scale has tended to merely quantify the rates of change (Killeen et al, 2004), and mentions to local issues do not consider in detail the socio-environmental processes involved (Mather, 2006);Although it is recognized that different deforestation rates are explained by the various social, economic and political contexts, the deforestation of TDF in the Mexican Pacific region has not been examined in detail. Currently, the State of Oaxaca, in Southern México, comprises 4.2% (461,196 ha) of TDF in México, with 37% of the state covered by this vegetation type, that is the most widely distributed ecosystem (Palacio et al., 2000). To understand the mechanisms underlying the changes in land use and land cover, deforestation should be analyzed locally (Pan et al., 2004). The analysis of local deforestation should ideally focus on the tropical dry forest ecosystem and its uses, landscape dynamics (all land-use and landcover changes), and local demographic, cultural, social, economical and political characteristics that drive deforestation (McCowell et al., 2004). In México, most of the issues related to land appropriation occur at a local scale, where competition for access to land and capital is particularly intense (Merino, 2002). There is clearly a need for studies that identify the most important elements and forces that drive deforestation at a local scale in order to promote and improve public policies for preserving TDF. In light of the current knowledge, this paper starts by assuming that two neighboring municipalities should experience similar deforestation and land-use and land-cover trajectories provided that the socio-economic characteristics and conflicts, as well as the biophysical features, are similar. However, when the municipalities show different characteristics, the deforestation, land-use and land-cover dynamics will differ. Particularly, we selected two neighboring municipalities sharing a similar ecological context, but that recently have been subjected to different deforestation patterns; this scenario provides a valuable opportunity for analyzing and comparing the dynamics and driving forces underlying land-use and land-cover changes at a local scale. Thus, the critical question to be addressed is, what are the main factors that boost deforestationand changes in land use and land cover change?, and, how might different development plans have influenced their dynamics?. Thus, the objectives of this study were: (1) analyze the dynamics and spatial distribution of deforestation of TDF; and (2) identify the proximate causes of land-use and land cover-changes in two municipalities in Southern Oaxaca, México.
Material and methodsStudy siteThe study area comprises the municipalities of San Pedro Pochutla and Santa María Huatulco, located in the State of Oaxaca, southern México (Figure 1). In this state, farming and rainfed agriculture, including slash-and-burn practices, are common (INEGI, 2005). Since the 1970s, successive federal governments have withdrawn subsidies and reduced loans to farmers — the sector most affected by these measures (Deininger & Feder, 2002). The study area is characterized by high levels of marginalization and social conflicts, which contrast with its high cultural richness (Propin & Sánchez, 2001). Since the 1980s, the area has developed tourism activities based on large hotels and other associated services (Juárez, 2000). Towards the end of last century, the area experienced one of the highest increases in population size and urbanization, above the national averages (Juárez et al., 1998; INEGI, 1980 & 2010). In 1984, a tourist resort in Santa María Huatulco was planned aiming at the improvement of regional economic development and the preservation of natural resources. In fact, 21 163 ha were expropriated to launch this tourist development; in 1998, 12,275 ha out of these 21 163 ha were declared National Park (FONATUR, 2003). Moreover, the municipality of Santa María Huatulco has valuable natural resources that have led to the promotion of different economic activities, among which tourism has played a key role in urban development and demographic growth. Changes in the population had been dramatic. In 1980, the population of Santa María Huatulco wsa about 40% the population of San Pedro Pochutla; by 2010, this figure reached about 90%, with an annual rate of change (1980-2010) of nearly 6% for Santa María Huatulco and 3.1% for San Pedro Pochutla (INEGI, 1980 & 2010). In Santa María Huatulco, the tertiary sector of the economy ranks first in terms of PIB and employment, with about 65% of the population working for the tourism and 16% for the primary sector of the economy (INEGI, 2000, 2010). On the other hand, in San Pedro Pochutla 48% the economically active population is involved in the tertiary sector, and 27% in the primary sector of the economy. Although agriculture is an important economic activity, in terms of people involved in those activities, most of the irrigated agriculture is located in Santa María Huatulco, with a minor representation in San Pedro Pochutla, an area where shifting cultivation is the dominant agricultural activity.

The altitude ranges from 0 to 1300 m asl, and the local climate is sub-humid and warm, with a dry season of seven to eight months (García, 2004). The total annual precipitation ranges between 600 and 1 000 mm, and the annual mean temperature is 26-30 °C (García, 2004). The predominant soil type is regosol with a lithic phase. The main vegetation cover includes TDF, characterized by trees 8 to 15 m high, most being deciduous for at least 5-8 months of the year (Bullock & Magallanes, 1990). TDF shows different degradation processes as well as mature forest. The period of time considered in this study (1985-2006) was established based on the availability of high-quality data, including aerial photographs, satellite imagery and official demographic and economic information. This period was divided into two: a) 1985 to 1995, and b) 1996 to 2006. This division allows a comparison of changes before and after the construction of the tourist resort and the recent economic development in the study area.
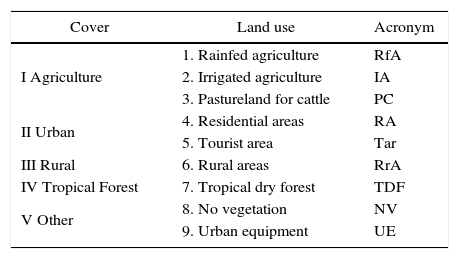
Deforestation rates and land-use and land-cover changesTo analyze land-use and land-cover changes, five land-cover and nine land-use classes were considered (Table 1). Land-use classes include: a) rainfed agriculture, which is largely based on a slash-and- burn practice to produce maize for self consumption; b) irrigated agriculture, which depends on the use of pesticides and fertilizers, papaya and sesame being the most important crops; c) pastureland for cattle raising, which is produced for local and national consumption; d) residential areas, that is, urban settlements with all the infrastructure needed to meet the basic needs of inhabitants (sewage systems, potable running water, and paved roads); e) rural areas, where this infrastructure may be totally or partially absent; f) tourist areas, including hotels and additional tourist infrastructure; g) tropical dry forest, which is the natural forest cover with patches of different degrees of degradation alternating with mature forest; h) “No vegetation or use” refers to unproductive and bare soil, and i) urban equipment include infrastructure such as dumps, a golf course, an airport and a university.
Land-use and land-cover classes in San Pedro Pochutla and Santa María Huatulco, Southern Oaxaca:five classes of land-covers divided into nine classes of land-uses were considered.
| Cover | Land use | Acronym |
|---|---|---|
| I Agriculture | 1. Rainfed agriculture | RfA |
| 2. Irrigated agriculture | IA | |
| 3. Pastureland for cattle | PC | |
| II Urban | 4. Residential areas | RA |
| 5. Tourist area | Tar | |
| III Rural | 6. Rural areas | RrA |
| IV Tropical Forest | 7. Tropical dry forest | TDF |
| V Other | 8. No vegetation | NV |
| 9. Urban equipment | UE |
Land-uses and land-covers were visually identified, delimited and classified by analyzing aerial photographs (color, texture and context criteria) (Shoshany, 2000 & 2002; Chuvieco, 2010). The land-use and land-cover classes were re-adjusted aided by the supervised classification of satellite imagery. The aerial photographs used were taken in 1985, 1995 and 2006. These were orthorectified and geo-referenced with the software ErMapper 7.0 to a final resolution of 2.5 m per pixel. The satellite imagery used was Landsat TM (April, 1990) and LandSat7 ETM+ (April, 2000). The supervised classification was based on 250 field points. All the information was processed in a Geographic Information System context (ArcGis 9.2), and for each year a vector layer was obtained. Mapping involved the manual adjustment of borders and re-assignment of the legend, following Bélanger and Grenier (2002). All the final vectorial layers were transformed into a raster format with a spatial resolution of 20x20 m per pixel.
The total area of each land-use and land-cover and the rates of change were calculated based on digital land-use maps. The equation used for the calculation of the rates of change is:
where A2 is the area in year 2, A1 is the area in year 1, and n is the number of years between year 1 and year 2 (FAO, 1995).
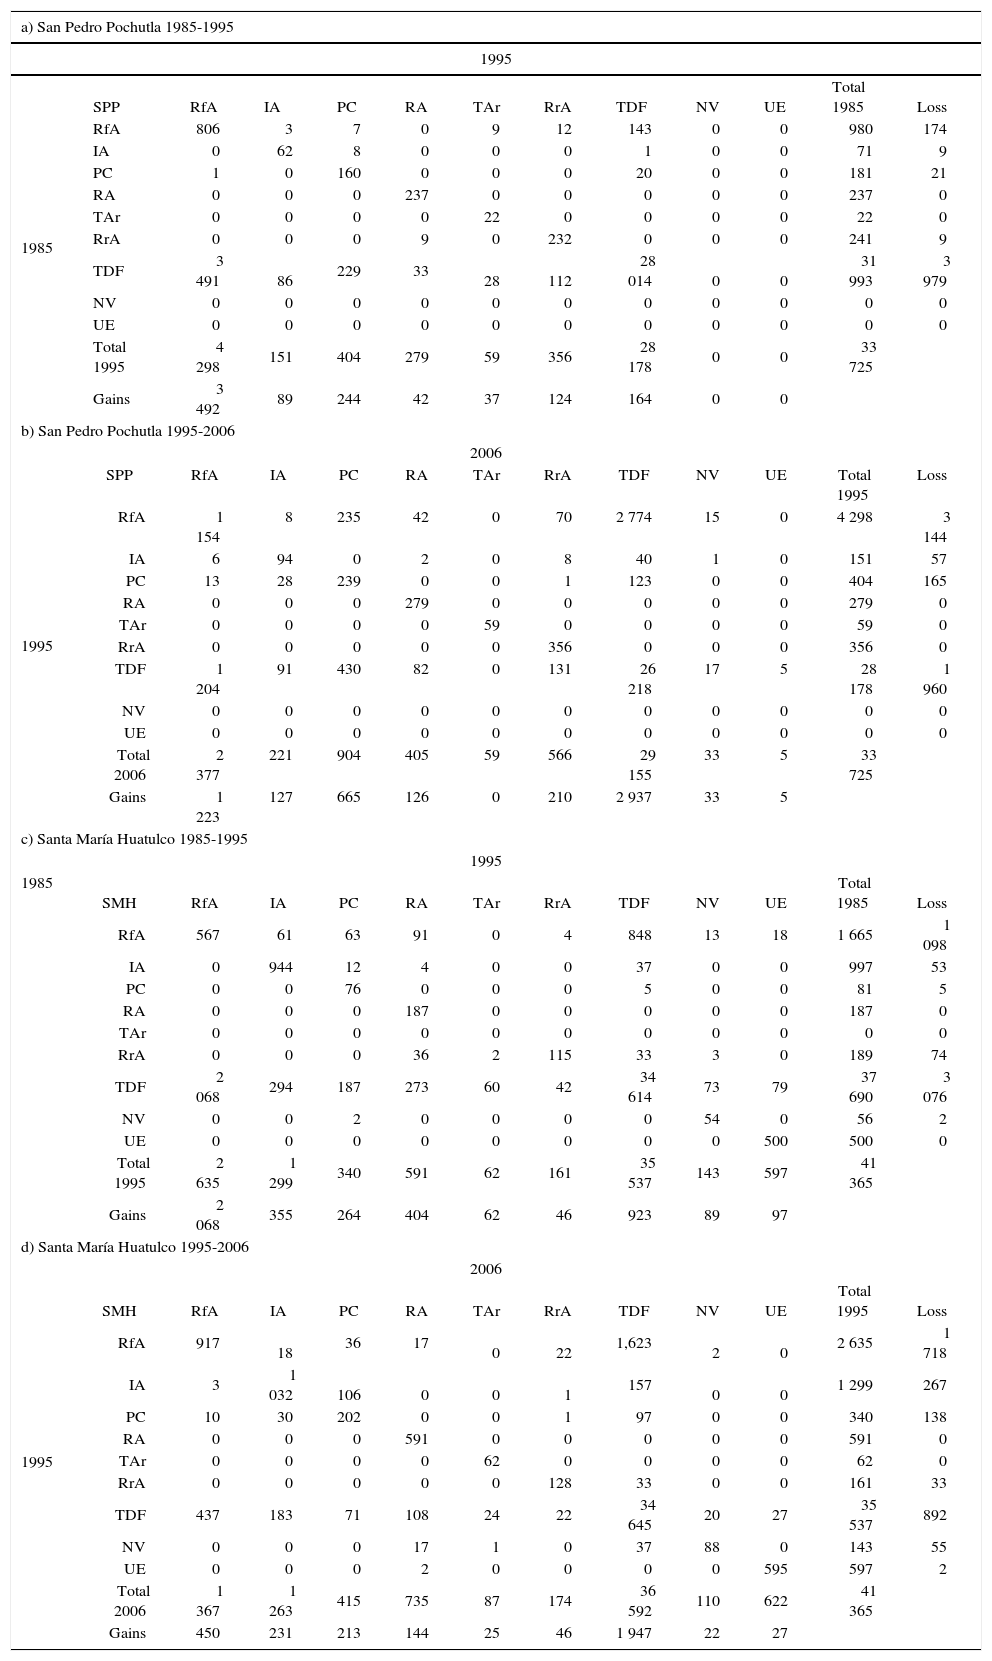
This study used a method developed by Pontius et.al. (2004) to analyze the transitions based on the post-classification analysis through an extended transition matrix. The method was designed to account for persistence in order to obtain the net change of each land-use type in the transition. Transition matrices were calculated based on post-classification across maps (Soares-Filho et al., 2002). Net change is the difference between gross gain and gross loss. Swap refers to changes that occur in a category while the quantity (ha) remains the same. In other words, swap is total change minus net change. Accounting for swap changes prevents the overestimation of change; this applies particularly to large categories (Pontius et al., 2004). Matrices were used to (1) identify types of changes, and (2) analyze the land-use and land-cover dynamics and patterns for the main types of changes.
Identification of deforestation driversDeforestation drivers were tested by different means. First, the spatial distribution of each land use and land cover was contrasted with different socio-environmental factors. Second, time series of forest changes were contrasted with different socioeconomic variables.
From a Digital Elevation Model (DEM) with a resolution of 20x20 m per pixel, different biophysical variables were constructed such as aspect, slope, altitude, terrain concavity and hydrological network, and distance to the coast and to the hydrological network. The socioeconomic variables were distance to the National Park, urban centers, tourist resorts, rural areas andpaved roads; in all cases, the output raster layers showed the same spatial resolution. To identify the drivers of deforestation and changes in land use and land cover, we characterized the distribution patterns in terms of the biophysical and socioeconomic factors that determine site quality and cost opportunity (i.e. access) within the two municipalities. To identify the driving forces behind the distribution of land use and land cover, a regression tree model was used. The dependent variables were the main proximate driving forces that affect the forested distribution, while the independent variables were the socioeconomic and biophysical variables. To conduct this analysis and given the computer-processing limitations, it was necessary to select five percent of the roughly 100 000 pixels covering the study area. These pixels were randomly selected. In order to have the best possible representation of the landscape and minimize the double counting of agricultural fields by pseudo-sampling, which could bias the output, a minimum distance of 80 m between the selected pixels was set. The distance was calculated based on the average size for RfA parcel plots recorded in the field (quarter of hectare).
To understand the processes governing the historical changes in land-use trends and future projections, different time series of total forested area per year were built for each year between 1985 and 2030 based on the Markov chain method (Kemeny & Snell, 1969). First, we developed the interpolation for 1985-1995, and subsequently calculated the annual values for 1995-2006. This was based on the transformation of each transition matrix into annual probability values. Then, changes in system proportions for the period t+l depend on the transition probabilities (aij) multiplied by the proportions of the status of the system in the previous period (t). Each aij value in the matrix is the probability that the state j passes to the state i in a time unit. The components of the own vectors (w1) are the stable proportions of the system status that are independent from the baseline conditions. This method accounts for bidirectional changes, e.g., change from conservation to deforestation for some areas and from deforestation to conservation in others. With this in mind, projections were derived for the period 2006-2030. The pessimistic scenario was built based on the 1985-1995 calibration period, and the positive scenario with the period 1995-2006. These scenarios were defined based on the total amount of forested area
To identify the underlying causes of the deforestation trends, it was necessary to build time series for the different predictor variables. Based on Lambin et al. (2003) and the variables used for building the CONAPO (Consejo Nacional de Población) marginalization index, different socioeconomic data were selected a priori and collected for each municipality. The data was organized in 5-year time points for 1960-2010, and interpolated on a yearly basis. With this procedure, a total time series for the period 1985-2006 was built. To reduce the uncertainty in annual interpolations, the variables selected should show clear trends and never random variations between the calibrated years. An additional requirement was that both the definition of these variables and the methods for data collection should remain unchanged over the period of study. The variables that fulfilled the previous requirements were: the total rural and urban population size; number of inhabitants with access to electricity, water and a sewage system; the number of indigenous people; mortality rate; number of economically active inhabitants by economic sector and total economically active population, as well as taxes collection (INEGI, 2010). The deforestation dynamics over the period 1985-2006 and its driving forces were analyzed using general linear models (GLM), where the dependent variable was the forested area calculated by Markovian processes, and the independent variables were the socioeconomic variables selected. To find the best model, the variables with the highest explanatory power (Pr|>|t) and a high R2 were identified in the first place. Afterwards, all the selected variables were integrated in the same model and then a step-wise selection was conducted to reach to the most parsimonious model.
All the statistical analyses were performed using the software R.2.5.1 (2007). To eliminate multi-collinearity across the variables evaluated, a pairwise comparison (Pearson) was performed. Variables were selected by eliminating one of the two when the coefficient ranged from -0.7 ≤ X or X ≥ 0.7, as suggested by Crawley (2013).
ResultsLand-use change dynamicsThe most influential human activities involved in land-use and land-cover changes in terms of the area affected were the expansion of rainfed agriculture (RfA), irrigated agriculture (IA) and pastureland for cattle raising (PC), and, to a lesser extent, rural areas (RrA), residential areas (RA), tourist area (Tar) and urban equipment (UE) (Table 2 and Figure 2). However, temporal and spatial patterns were different in both municipalities. In San Pedro Pochutla, TDF decreased from 31,992 ha in 1985 to 28,178 ha in 1995 (a 12% decrease during the period, approximately) at 1.26% per year, but by 2006 had partially recovered to 29,159 ha, an increase of 0.31% per year (1995-2006) (Table 2 and Figure 2). Furthermore, over the entire period, 1985-2006, the deforestation rate was 0.44% per year. In Santa María Huatulco, the forest area decreased from 37,690 ha in 1985 to 35,538 ha in 1995, at 0.59% per year (roughly 6% over the whole period); whereas in 2006 the area was 36,595 ha, with a recovery rate of 0.27% per year between 1995 and 2006. Over the entire period, 1985-2006, the deforestation rate was 0.14% per year (Table 2 and Figure 2).
Transitional matrixes for San Pedro Pochutla and Santa María Huatulco municipalities. he matrixes express the changes between land-use and land-cover in hectares for each period and municipality as well as the total area per year. he total losses and gains for each period and each municipality is reported too.
| a) San Pedro Pochutla 1985-1995 | ||||||||||||
|---|---|---|---|---|---|---|---|---|---|---|---|---|
| 1995 | ||||||||||||
| 1985 | SPP | RfA | IA | PC | RA | TAr | RrA | TDF | NV | UE | Total 1985 | Loss |
| RfA | 806 | 3 | 7 | 0 | 9 | 12 | 143 | 0 | 0 | 980 | 174 | |
| IA | 0 | 62 | 8 | 0 | 0 | 0 | 1 | 0 | 0 | 71 | 9 | |
| PC | 1 | 0 | 160 | 0 | 0 | 0 | 20 | 0 | 0 | 181 | 21 | |
| RA | 0 | 0 | 0 | 237 | 0 | 0 | 0 | 0 | 0 | 237 | 0 | |
| TAr | 0 | 0 | 0 | 0 | 22 | 0 | 0 | 0 | 0 | 22 | 0 | |
| RrA | 0 | 0 | 0 | 9 | 0 | 232 | 0 | 0 | 0 | 241 | 9 | |
| TDF | 3 491 | 86 | 229 | 33 | 28 | 112 | 28 014 | 0 | 0 | 31 993 | 3 979 | |
| NV | 0 | 0 | 0 | 0 | 0 | 0 | 0 | 0 | 0 | 0 | 0 | |
| UE | 0 | 0 | 0 | 0 | 0 | 0 | 0 | 0 | 0 | 0 | 0 | |
| Total 1995 | 4 298 | 151 | 404 | 279 | 59 | 356 | 28 178 | 0 | 0 | 33 725 | ||
| Gains | 3 492 | 89 | 244 | 42 | 37 | 124 | 164 | 0 | 0 | |||
| b) San Pedro Pochutla 1995-2006 | ||||||||||||
| 2006 | ||||||||||||
| 1995 | SPP | RfA | IA | PC | RA | TAr | RrA | TDF | NV | UE | Total 1995 | Loss |
| RfA | 1 154 | 8 | 235 | 42 | 0 | 70 | 2 774 | 15 | 0 | 4 298 | 3 144 | |
| IA | 6 | 94 | 0 | 2 | 0 | 8 | 40 | 1 | 0 | 151 | 57 | |
| PC | 13 | 28 | 239 | 0 | 0 | 1 | 123 | 0 | 0 | 404 | 165 | |
| RA | 0 | 0 | 0 | 279 | 0 | 0 | 0 | 0 | 0 | 279 | 0 | |
| TAr | 0 | 0 | 0 | 0 | 59 | 0 | 0 | 0 | 0 | 59 | 0 | |
| RrA | 0 | 0 | 0 | 0 | 0 | 356 | 0 | 0 | 0 | 356 | 0 | |
| TDF | 1 204 | 91 | 430 | 82 | 0 | 131 | 26 218 | 17 | 5 | 28 178 | 1 960 | |
| NV | 0 | 0 | 0 | 0 | 0 | 0 | 0 | 0 | 0 | 0 | 0 | |
| UE | 0 | 0 | 0 | 0 | 0 | 0 | 0 | 0 | 0 | 0 | 0 | |
| Total 2006 | 2 377 | 221 | 904 | 405 | 59 | 566 | 29 155 | 33 | 5 | 33 725 | ||
| Gains | 1 223 | 127 | 665 | 126 | 0 | 210 | 2 937 | 33 | 5 | |||
| c) Santa María Huatulco 1985-1995 | ||||||||||||
| 1995 | ||||||||||||
| 1985 | SMH | RfA | IA | PC | RA | TAr | RrA | TDF | NV | UE | Total 1985 | Loss |
| RfA | 567 | 61 | 63 | 91 | 0 | 4 | 848 | 13 | 18 | 1 665 | 1 098 | |
| IA | 0 | 944 | 12 | 4 | 0 | 0 | 37 | 0 | 0 | 997 | 53 | |
| PC | 0 | 0 | 76 | 0 | 0 | 0 | 5 | 0 | 0 | 81 | 5 | |
| RA | 0 | 0 | 0 | 187 | 0 | 0 | 0 | 0 | 0 | 187 | 0 | |
| TAr | 0 | 0 | 0 | 0 | 0 | 0 | 0 | 0 | 0 | 0 | 0 | |
| RrA | 0 | 0 | 0 | 36 | 2 | 115 | 33 | 3 | 0 | 189 | 74 | |
| TDF | 2 068 | 294 | 187 | 273 | 60 | 42 | 34 614 | 73 | 79 | 37 690 | 3 076 | |
| NV | 0 | 0 | 2 | 0 | 0 | 0 | 0 | 54 | 0 | 56 | 2 | |
| UE | 0 | 0 | 0 | 0 | 0 | 0 | 0 | 0 | 500 | 500 | 0 | |
| Total 1995 | 2 635 | 1 299 | 340 | 591 | 62 | 161 | 35 537 | 143 | 597 | 41 365 | ||
| Gains | 2 068 | 355 | 264 | 404 | 62 | 46 | 923 | 89 | 97 | |||
| d) Santa María Huatulco 1995-2006 | ||||||||||||
| 2006 | ||||||||||||
| 1995 | SMH | RfA | IA | PC | RA | TAr | RrA | TDF | NV | UE | Total 1995 | Loss |
| RfA | 917 | 18 | 36 | 17 | 0 | 22 | 1,623 | 2 | 0 | 2 635 | 1 718 | |
| IA | 3 | 1 032 | 106 | 0 | 0 | 1 | 157 | 0 | 0 | 1 299 | 267 | |
| PC | 10 | 30 | 202 | 0 | 0 | 1 | 97 | 0 | 0 | 340 | 138 | |
| RA | 0 | 0 | 0 | 591 | 0 | 0 | 0 | 0 | 0 | 591 | 0 | |
| TAr | 0 | 0 | 0 | 0 | 62 | 0 | 0 | 0 | 0 | 62 | 0 | |
| RrA | 0 | 0 | 0 | 0 | 0 | 128 | 33 | 0 | 0 | 161 | 33 | |
| TDF | 437 | 183 | 71 | 108 | 24 | 22 | 34 645 | 20 | 27 | 35 537 | 892 | |
| NV | 0 | 0 | 0 | 17 | 1 | 0 | 37 | 88 | 0 | 143 | 55 | |
| UE | 0 | 0 | 0 | 2 | 0 | 0 | 0 | 0 | 595 | 597 | 2 | |
| Total 2006 | 1 367 | 1 263 | 415 | 735 | 87 | 174 | 36 592 | 110 | 622 | 41 365 | ||
| Gains | 450 | 231 | 213 | 144 | 25 | 46 | 1 947 | 22 | 27 | |||
 of change for each period and municipality. The number in the right side of each bar corresponds to the percentage of tdf deforested that can be explained by agriculture activities. At the bottom of the graph is represented the deforestation rate for expressed as rate of change.")
Deforestation rates for both municipalities and periods and proximate driving forces. The bars represents total area (hectares) of change for each period and municipality. The number in the right side of each bar corresponds to the percentage of tdf deforested that can be explained by agriculture activities. At the bottom of the graph is represented the deforestation rate for expressed as rate of change.
In both periods and municipalities, land use and land cover increased mainly at the expense of natural forest, which experienced high deforestation rates (Table 2); in fact, agricultural activities account for over 85% of the deforestation (Figure 2). However, temporal and spatial trends showed some differences in both municipalities. For example, in San Pedro Pochutla agricultural activities were responsible for 95.7% of the change between 1985 and 1995, and for 88.0% of the change between 1995 and 2006. In Santa María Huatulco, the values were about 82.9% and 77.5% for the same periods (Figure 3). Nevertheless, the contribution of rainfed agriculture decreased, whereas the contribution of pastureland for cattle and irrigated agriculture increased. In San Pedro Pochutla, pastureland showed the greatest increase, whereas in Santa María Huatulco irrigated agriculture showed the greatest increase (Table 2).
 and pessimist (-) for both municipalities. All the information if referred to the year 2006. Units are expressed in hectares.")
In 1985-1995 in San Pedro Pochutla, RfA increased its area at the expense of forest clearance (10.4% of the area), whereas during 1995-2006 deforestation represented 3.6% of the total area (Table 2). PC increased in 0.7% as a result of forest clearance during 1985-1995, and clearance increased to 1.3% of the area in 1995-2006. IA and RrA showed and increase of ~0.3% in each period. TDF proved to be the most dynamic land cover, since all the land uses and land covers for both periods affected previously forested areas. However, RfA, IA and PC were the only land uses and land covers associated with TDF regeneration. The highest levels of forest regeneration were observed during 1995-2006 and were related with the shift from RfA to TDF in over 8% of landscape, followed by PC with 0.4% and finally, by IA with 0.1% (Table 2). This may coincide with the rapid growth of tourist infrastructure and the associated demand for labor force.
In Santa María Huatulco, RfA in 1985-1995 increased its area at the expense of forest clearance (5% of the area), and during 1995-2006 deforestation decreased to 1.1% of the total area (Table 2). IA and PC promoted forest clearance during 1985-1995 in 0.7% and 0.5% of the total area, respectively. In 1995-2006, IA and PC clearance dropped to 0.4% and 0.2%, respectively. RrA showed the highest increase in 1985-1995 (0.7%), decreasing afterwards to 0.3% between 1995-2006. RrA and UE showed a 0.1% increase in each period. In 1985-2006, RfA was replaced by TDF in 2.1% of the area, and by IA and RrA, each in 0.1%. During 1995-2006, RfA shifted to TDF in 3.9% of the area, IA did so in 0.4%, PC in 0.2%, and RrA and NV in 0.1% (Table 2).
The permanence of each land use and land cover in both periods and both municipalities differs significantly. In 1985-1995 in San Pedro Pochutla, RfA had the lowest permanence (82.2%), followed by IA (87.3%), TDF (87.6%) and PC (88.4%). For the period 1995-2006, permanence was lower than in previous period: RfA (26.8%), PC (59.2%) and IA (62.3%). TDF increased its permanence to 93%, and the rest of land uses and land covers rose to 100%. In 1985-1995 in Santa María Huatulco, RfA showed the lowest permanence (34.1%), followed by RrA (60.8%), TDF (91.8%), PC (93.8%), and IA (94.7%). In 19952006, permanence decreased for PC (59.4%) and IA (79.4%), while RfA obtained similar values to the previous period (35%) (Table 2).
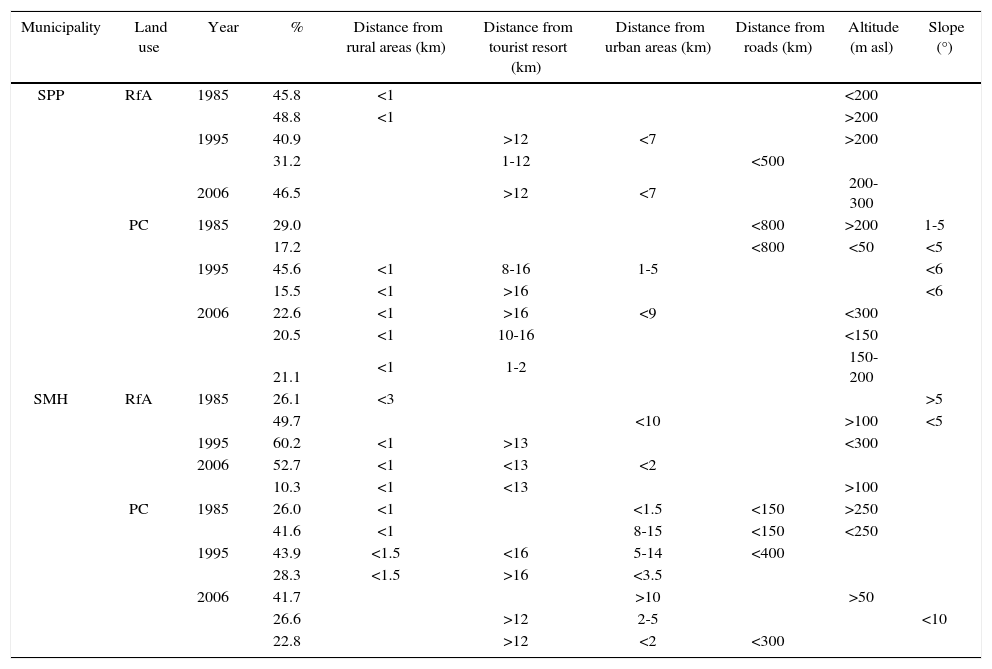
Factors governing deforestation and the spatial distribution of land use and land coversTopography (slope and altitude) is related to the distribution of land-use and land-cover, while the most important socioeconomic variables are the distances from roads, rural areas, urban centers and tourist resorts (Table 3). However, the effects of these variables on the distribution of deforestation vary over space and time. For example, 94.3% of the RfA in San Pedro Pochutla was near (< 1km) rural areas in 1985, and its distribution is also related to altitude; 40.9% of RfA was located in places far away (> 12km) from Tar, but near (< 7km) RA and places at higher altitudes (>200 m asl) in 1995, and 31.2% was located in places near (< 500 m) roads and away (1-12km) from Tar. In 2006, 46.5% of RfA was located in areas far away (> 12km) from Tar; near (< 7km) RA and at high altitudes (200-300 m asl). RfA showed its highest growth rate on medium slopes (10-30°) at high altitudes (> 400 m asl), and a lower growth rate in areas with steeper slopes (> 30°) and low altitudes (< 200 m asl).
Most important variables determining the distribution patterns for rainfed agriculture and pastureland for cattle in San Pedro Pochutla and Santa María Huatulco, Southern Oaxaca.
| Municipality | Land use | Year | % | Distance from rural areas (km) | Distance from tourist resort (km) | Distance from urban areas (km) | Distance from roads (km) | Altitude (m asl) | Slope (°) |
|---|---|---|---|---|---|---|---|---|---|
| SPP | RfA | 1985 | 45.8 | <1 | <200 | ||||
| 48.8 | <1 | >200 | |||||||
| 1995 | 40.9 | >12 | <7 | >200 | |||||
| 31.2 | 1-12 | <500 | |||||||
| 2006 | 46.5 | >12 | <7 | 200-300 | |||||
| PC | 1985 | 29.0 | <800 | >200 | 1-5 | ||||
| 17.2 | <800 | <50 | <5 | ||||||
| 1995 | 45.6 | <1 | 8-16 | 1-5 | <6 | ||||
| 15.5 | <1 | >16 | <6 | ||||||
| 2006 | 22.6 | <1 | >16 | <9 | <300 | ||||
| 20.5 | <1 | 10-16 | <150 | ||||||
| 21.1 | <1 | 1-2 | 150-200 | ||||||
| SMH | RfA | 1985 | 26.1 | <3 | >5 | ||||
| 49.7 | <10 | >100 | <5 | ||||||
| 1995 | 60.2 | <1 | >13 | <300 | |||||
| 2006 | 52.7 | <1 | <13 | <2 | |||||
| 10.3 | <1 | <13 | >100 | ||||||
| PC | 1985 | 26.0 | <1 | <1.5 | <150 | >250 | |||
| 41.6 | <1 | 8-15 | <150 | <250 | |||||
| 1995 | 43.9 | <1.5 | <16 | 5-14 | <400 | ||||
| 28.3 | <1.5 | >16 | <3.5 | ||||||
| 2006 | 41.7 | >10 | >50 | ||||||
| 26.6 | >12 | 2-5 | <10 | ||||||
| 22.8 | >12 | <2 | <300 |
In 1985 in Santa María Huatulco, 26.1% of RfA was found in areas near (< 3km) RrA and on medium slopes (> 5°), and 49.7% on gentle slopes (< 5°) at medium altitudes (> 100 m asl) and close (< 10km) to urban areas (Table 3). In 1995, 60.2%, and in 2006 63.0% of RfA was concentrated in areas far away from tourist resorts (> 13km) and close (< 1km) to RA. Its growth was observed on areas with medium slopes and medium altitudes, whereas areas with gentle slopes and low altitudes showed a lesser growth (Table 3). In 1985 in San Pedro Pochutla, PC was located mainly on flat land (1-5°) and close (< 150 m) to roads, whereas in 1995 and 2006 it was close (< 1km) to RrA and urban areas at medium altitudes far from tourist resorts (~250 m asl) (Table 3). In 1995 and 2006 in Santa María Huatulco, PC was close (< 150 m) to roads at medium-to-low altitudes (~250 m asl), at a medium distance (< 5km) from urban areas and far (> 12km) from tourist resorts. However, in 1985 and 1995 the closeness to rural areas was the main determinant of its location. In both municipalities, irrigated agriculture was established in flat areas (< 5°) at low altitudes (< 50 m asl). Regrowth of TDF occurred mainly at high altitudes (> 400 m asl) and on medium- to-steep slopes (> 30°) (Table 3). Distance to the limits of the National Park was not an important variable to explain land-use and land-cover allocation. However, no anthropogenic land cover was identified within its borders, suggesting that the National Park is playing an important role in forest conservation, contrary to the findings in studies focused on other national parks (Figueroa et al., 2011; Satish et al, 2014).
Current and future land-use and land-cover change projectionsImportant socioeconomic changes occurred in the last three decades, mainly related to the primary sector of the economy. By 1980, 67.1% of San Pedro Pochutla inhabitants and all the inhabitants of Santa María Huatulco depended on agricultural activities. However, only Santa María Huatulco showed a drastic reduction in this dependence, and today some 35% of the population still depend on agricultural activities, while minor changes have been observed in San Pedro Pochutla (~65%). These have driven important differences in deforestation processes and patterns. For example, forested area showed a positive correlation with two economical indices (economically active population, P<0.0001, and taxes collection, P=0.03), and a negative correlation with rural population density (P=0.002). These findings suggest that the higher the rural population, the higher deforestation, mainly as a result of the expansion of agricultural areas. However, this could be minimized through a better economic development promoting the intensification of land use and land cover and the migration of population activities into different sectors of the economy.
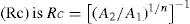
In terms of the magnitude of change, the greatest impact of anthropogenic land use and land cover on TDF is expected to occur in the near future. Markovian models suggest that under a pessimistic scenario, by 2030 both municipalities will increase their deforestation rates. In Santa María Huatulco, a forest deforestation of 11.9% of the municipality area is expected associated with PC, while in San Pedro Pochutla this figure would be 22.3%. RfA shows the highest increase amongst all land-use classes. RA shows a higher increase in Santa María Huatulco than in San Pedro Pochutla, and both municipalities show a significant rise in RrA (Table 4). On the other hand, the deforestation projected under the positive scenario shows a sharp decline. For example, in San Pedro Pochutla a deforestation of 1.6% of the municipality area is expected, and in the meantime, the forested area in Santa María Huatulco would show a slight increase, mainly as a result of a decrease in RfA, even below the figure recorded in 2006. However, regardless of the time period under analysis, San Pedro Pochutla would show a drastic forest reduction, while Santa María Huatulco not only would display the lowest vegetation loss, but forest regeneration would also be expected (Figure 3).
Markovian projection for the diferent periods and municipalities. Numbers express the proportion of each land-use and land-cover in percentage of the municipality area. he projections followed two diferent scenarios: positive (+) and pessimist (-) for both municipalities.
| 2006 | 2030 (-) | 2030 (+) | ||||
|---|---|---|---|---|---|---|
| SMH | SPP | SMH | SPP | SMH | SPP | |
| Rainfed agriculture | 3.3 | 7.0 | 6.5 | 26.9 | 2.3 | 5.8 |
| Irrigated agriculture | 3.1 | 0.7 | 5.4 | 1.0 | 3.0 | 1.0 |
| Pastureland for cattle | 1.0 | 2.7 | 2.9 | 3.0 | 1.1 | 3.4 |
| Residential areas | 1.8 | 1.2 | 5.0 | 1.3 | 2.5 | 1.9 |
| Tourist area | 0.2 | 0.2 | 0.0 | 1.1 | 0.3 | 0.2 |
| Rural areas | 0.4 | 1.7 | 0.3 | 2.6 | 0.4 | 2.9 |
| Tropical Dry Forest | 88.5 | 86.4 | 76.6 | 64.1 | 88.6 | 84.8 |
| No vegetation | 0.3 | 0.1 | 1.0 | 0.0 | 0.2 | 0.0 |
| Urban Equipment | 1.5 | 0.0 | 2.3 | 0.0 | 1.6 | 0.0 |
The differences in local land management and economic and social characteristics between the two municipalities may be related to different deforestation rates in the two periods analyzed. In 985-1995, the magnitude of deforestation in San Pedro Pochutla was higher than in Santa María Huatulco. However, in 1995-2006 the deforestation rates were negative in both municipalities and TDF slightly recovered (~0.3% annually) as a result of the reduction in agricultural activities. In San Pedro Pochutla, the rate was similar (t=4.841, 90% CI 0.176-0.509) to figures reported for other regions of México: 0.35% annually in 1980-2001 for Oaxaca (Velazquez et al., 2003), and 0.44% in 1988-2005 for La Montana, Campeche (Porter-Bolland et al., 2007). Again, in Santa María Huatulco the rate was about one third of the rate in San Pedro Pochutla, well below the Mexican average.
We found that RfA was the main proximate cause of deforestation, followed by pastureland for cattle raising and finally, with the lowest impact, irrigated agriculture (Table 2, Figure 2 and 3). At global and regional levels, the proximate causes of deforestation have been related mainly to the primary economic activities, and the decrease in tropical forest has been attributed to the establishment of agricultural activities, pastureland for cattle raising and wood extraction (Lambin et al., 2003; Izquierdo et al, 2011; Lambin & Mayfroidt, 2011; Tapia-Armijos et al., 2015). RfA tends to exhibit the highest growth rates in marginal zones (at higher altitudes on steep slopes). Similar dynamics have been reported in other tropical forest regions (Deininger & Minten, 1997; Lambin & Mayfroidt, 2011; Tapia-Armijos et al., 2015). In San Pedro Pochutla, economic activities led to the intensification of land use and land covers by introducing cattle grazing, which was associated with a reduction in rainfed agriculture. Similar results were also obtained by Lambin et al., (2003) and Ryan et al, (2012). In the period 1995-2006, in Santa María Huatulco, however, the population gradually abandoned rainfed agriculture due the job opportunities in the tourist sector, which allowed the forest to regenerate; similar findings were reported by Izquierdo et al. (2011) and by Lambin & Mayfroidt (2011). Therefore, this municipality has experienced high rates of urbanization and economic development. For example, between 1985 and 1995 its rural area shrank, and between 1995 and 2006 the growth rate of urban areas was ten-fold the growth rate rural areas. In contrast, in San Pedro Pochutla rural areas have doubled the growth rate of urban areas; in fact, rural areas showed an increase 15.3 times higher than in Santa María Huatulco. San Pedro Pochutla is still a rural municipality that has not changed markedly in social or economic terms, and where the local population still depend on agricultural activities.
The other proximate driver of TDF deforestation is likely to be the introduction of pastureland for cattle raising as a result of the ability of the rural population to afford the cost of this economic activity; similar results have been reported for another TDF in Ecuador (Tapia-Armijos et al., 2015). The main cause of the increase of cattle production in areas previously occupied by TDF is that local inhabitants consider livestock to be a living bank that is a buffer against poverty and minimizes the risk of food insecurity (Byers, 2000; Preston et al., 2003; Quiroga-Mendiola, 2004). Moreover, rainfed agriculture requires extensive care during the period of crop development, while grazing is cheaper and less labor-intensive, as is based on an extensive system that only requires intentional burning of pastureland, which regrows every two years. Although infrastructure development is a proximate cause of deforestation, the growth of tourism has had little impact on the disappearance of TDF in both municipalities. Godinez (2003) suggests that tourism develops slowly and does not require the clearing of large extensions of TDF. This may be explained by two facts; tourist infrastructure has not grown as expected and, in any case, most of the largest tourism developments are located on beaches, affecting TDF areas to a lesser extent.
For both municipalities, the most important factor affecting agricultural land dynamics and the local socioeconomic development was the establishment of the tourist resort as an alternative source of labor force. Several researchers have found that the introduction of economic activities unrelated to agriculture promote the internal migration of workers (Izquierdo et al, 2011; Lambin & Mayfroidt, 2011; Carandang et al, 2013). Moreover, Winters et al. (2002) suggested that in México people who live far from urban areas are less likely to be employed in non-agricultural activities. Thus, the maximum distance across which effects are evidenced is directly related to the capacity of the population living in rural areas to become employed in these new activities. The establishment of rainfed agriculture may also be the result of an opportunity cost where transportation costs are higher than the potential income; similar results were reported by Finan et al., (2005), suggesting that the population prefers to engage in agricultural activities instead of migrating to a non-agricultural job market. Hence, rainfed agriculture has decreased in zones close to tourist areas in San Pedro Pochutla, while in Santa María Huatulco temporal agriculture is far away from tourist centers. As a consequence, the spread of rainfed agriculture is inversely related to the proximity to urban areas and tourist centers, and directly related to the proximity to rural areas. Similar results have been found in other tropical regions (Nelson & Hellerstein, 1997; Lambin & Mayfroidt, 2011). These results suggest that with a stable national economy and well-developed local tourism, rainfed agriculture becomes less attractive and the total area involved in this activity becomes smaller; similar results were found in Philippines (Carandang et al, 2013). Finally, in this study, sociodemographic conditions explain the ability and opportunities to make decisions about land use, in which deforestation responded to capital opportunities to open up the frontier to give space to pastures for cattle raising (Durand & Lazos, 2004; Castillo et al., 2005; Ryan et al., 2012). In both municipalities the expansion of TDF was directly related to the size of the economically active population and taxes collection. Moreover, rural population growth was associated with a decrease in the total area occupied by TDF (De Janvry & Sadoulet, 2001; Pascual, 2005; Izquierdo et al, 2011). Obviously, the trend towards a recovery of TDF is based on a positive economic development; similar results were reported by Cattaneo and Nu (2005).
Deforestation scenarios suggest that rainfed agriculture and the introduction of grasslands have different future trends for each municipality (Table 4 and Figure 3). In San Pedro Pochutla, deforestation resulting from the above two activities shows an increasing trend. Practices such as slash-and- burn agriculture and fire management for maintaining grasslands will surely continue affecting TDF. In contrast, in Santa María Huatulco future deforestation is expected to decrease due to the neglect of rainfed agriculture and the development of irrigated agriculture and other alternative sources of income derived from tourism. Ultimately, the scenarios indicate that deforestation is inevitable currently and in the future, thus requiring a plan to reverse these trends in land use (Lambin & Mayfroidt, 2011). It is convenient to create alternative sources of income, reorganize agricultural activities and promote changes in public policies (Carandang et al., 2013). For example, subsidies granted by the government under PROCAMPO (Programa de Apoyo Directo al Campo) and PROGAN (Programa de Estímulos a la Producción Ganadera) should be adapted to the social, cultural, natural and technological contexts according to the specific conditions of each region and municipality, in order to reduce deforestation and soil erosion. Moreover, it seems appropriate to migrate from extensive to intensive agriculture, which would reduce the pressure on TDF while increasing productivity (Lambin & Mayfroidt, 2011). This should be linked to an appropriate technical assistance and economic policy program to turn current production systems into intensive and sustainablemodalities. In the future, it will be necessary to develop new scenarios of land use and land cover change integrating direct and underlying drivers, public policy and economic alternatives to allow better planning of productive activities and prevent further TDF loss in México.
ConclusionsThe development of a tourist center in Santa María Huatulco largely explains most of the observed differences in deforestation and land-use and land-cover dynamics between the two municipalities studied. Reducing deforestation is largely associated to the increase in non-farming jobs, a trend expected to continue in the coming years. Tourism can drive fundamental changes, mainly by increasing the number of non-agricultural job opportunities and by developing a new urban center. This underlying driving force has reduced the pressure on TDF and allowed its regeneration. However, the dynamics of land-use and land-cover change, particularly deforestation, have not been evenly distributed in space and time. An increase in cattle pasturing, mainly at the expense of TDF and as expansions of the frontiers of already cleared land, is often related to the low income offarmers, both in the study area and possibly across southern México (including the States of Chiapas, Oaxaca, Guerrero and Michoacán). Finally, it is important to highlight that job opportunities different from the primary sector of the economy will reduce the pressure on TDF. However, this has to be coupled with a reduction of rural population to promote forest recovery. Otherwise, if there is economic development but it is not coupled with proper population management, forested areas are expected to continue becoming smaller.
Funding for this research was provided by DGAPA-UNAM México, Grant IN 220106. We would like to thank Silvia Dingwall and Ann Grant for professional English editing.