


This paper shows a hyperspectral optical analysis of Zumpango Lake, relict of one of the lakes that formerly filled the Basin of Mexico. The spectral signatures are dominated by the presence of phytoplankton and submerged vegetation. Integrated spectral curves have a good statistical correlation with chlorophyll a concentration values. It indicates that submerged vegetation water, mainly hyacinth(Eichhornia spp) and duckweed (Lemna sp), and phytoplankton are homogeneously distributed in the water body, which confers its characteristics of eutrophication.
En este artículo se presenta un análisis óptico hiperespectral del Lago de Zumpango, el cual es un relicto de los lagos antiguos que anteriormente llenaban la Cuenca de México. las firmas espectrales están dominadas por la presencia de fitoplancton y por vegetación sumergida. Las curvas espectrales integradas presentan una buena correlación estadística con los valores de la concentración de clorofila a. Esto indica que la vegetación sumergida en el agua, principalmente lirio (Eichhornia spp) y lentejilla (Lemma spp), y el fitoplancton están distribuidos homogéneamente en el cuerpo de agua, lo cual le confiere características de eutrofización.
The Basin of Mexico is a highland surrounded by volcanic mountains. It is at the central-eastern part of the Trans-Mexican Volcanic Belt, located between 98°15’ and 99°30’ W, and 19°00’ and 20°15’ N. Altitude varies from 2240masl to the south to 2390masl to the north. This basin is endorheic, or hydrologically closed, and has an approximate area of 9600km2and includes parts of the Federal District, and the States of Mexico, Hidalgo, Tlaxcala and Puebla.
Its present morphological features were established during the quaternary period; tectonic and volcanic activities continue nowadays.
Formerly, there were lacustrine flatlands, occupying the lower part of the area. This basin contained five lakes: Zumpango, Xaltocan, and Texcoco of brackish water, to the north, and, to the south Xochimilco and Chalco of fresh water, at the western side and at a higher altitude than the other three (Gutiérrez de MacGregor, 1995; Lugo et al., 2001).
However, the morphology of the lacustrine flatland has changed as a result of anthropogenic modifications made since historical times. All the lakes have virtually disappeared, leaving just a few relicts. The most important relicts are Tecocomulco and Zumpango lakes and the Guadalupe dam, all at the northern side of the basin. In the southern part, there are no water bodies of a significant size, even though some relicts do remain in the form of channels of the ancient Xochimilco Lake.
There are a number of studies performed in Mexican lakes using remote sensing techniques (e. g. Chacón et al., 1992; Mendoza et al., 2007). In particular, in the Basin of Mexico, Prol-Ledesma et al. (2002) used satellite imagery to analyze the neighborhood of Lake of Chalco; De la Lanza and Gómez (2005) performed a change detection study in the vicinity of Tecocomulco Lake.
Nowadays, it is possible to accurately assess the trophic conditions of a water body by using hyperspectral remote sensors to measure in situ reflectance. To validate this information, fieldwork must calibrate remote sensing data by in situ measurement of photosynthetic pigment concentration in the water body such as chlorophyll a, b, c, and carotenoids (Glooschenko et al., 1974; Brivio et al., 2001; Aguirre et al., 2001). One of the main advantages of this kind of study is the possibility of using sophisticated mathematical functions to perform a deeper analysis than that used with broad band satellite data. Thus, the aim of this paper is to analyze the spectral response of Zumpango Lake by using a hyperspectral remote sensor.
Study areaZumpango Lake is in the north-eastern region of the State of Mexico located at 19°46’ N and 99°9’ W (Figure 1). Topographically, the lake is characterized by flatlands to the south, although the north-eastern end is rather hilly with altitudes varying between 1 245 and 1 650m asl.

The lake is part of the Moctezuma river hydro-logical basin (inegi, 1998). It is fed by runoff from the nearby mountain slopes that is not absorbed by, nor filtered through, the soil.
The lake has a maximum extension of 24km2and a depth between 1-3m, although both vary seasonally and annually as a function of precipitation. Yearly total precipitation averages 700mm, reaching a maximum in June. The climate is cold from November to March, with temperatures down to -2.3°C, and warm from April to October with temperatures up to 31°C; the annual mean is 15°C (inegi, 2005).
The lake also works as a controlling and storage basin with a capacity for 100millioncubic meters; over 60millioncubic meters of water per year regularly enter. Recently, Zumpango Lake has been undergoing a constant rescue operation (H. Ayuntamiento del Estado de México, 2003). In January 2003 the lake was promoted to “water sanctuary” and in order to keep this status there is frequent cleaning work, which consists mainly of smashing mats of aquatic hyacinth (Eichhornia sp) a very prolific and abundant species with a seasonal growth pattern (` et al., 2005). Hyacinth smashing causes a homogeneous greenish color of the water body.
Methods and materialFieldwork was carried out at Zumpango Lake on August 2006. Seven sampling points were selected. Six of them (1-5, 7) were distributed surrounding the lake for covering the input of water in it and the last one (6) was located at the deepest zone of the lake, close to the centre of the water body. Each sampling point was geo-referred with a gps (Garmin, Ltd) and optical measurements such as Secchi transparency and hyperspectral reflectance were also performed. Afterwards, hyperspectral data were analyzed through a derivative method. Water samples were collected at each sampling site at the surface and at 0.5mdepth for laboratory analysis of chlorophyll concentration using fluorometric methods.
Secchi transparency and extinction coefficient kTransparency was measured with a Secchi disk. It is a white, heavy disk, with a diameter of about 30 centimeters. The disk is submerged into the water body until it is no longer visible, as observed from the sunny side of the boat avoiding the shadow (Davies-Colley et al., 1993). This measurement allows for an acceptable estimated of the light extinction coefficient. Tyler (1968) found a 15% variation between measurements taken with this simple instrument and submerged photometers. Transparency measured with a Secchi disk is, basically, a function of light reflected by the disk surface, and hence it is affected by absorption characteristics of the water and the elements contained within it. The higher the dissolved or suspended organic matter concentration the lower the transparency, due to absorption and scattering processes (Preisendorfer, 1986). On the one hand, there is an exponential decrement due to yellow substance and, on the other hand, there is a reduction of the transparency due to the increment of scattered light by suspended particulate matter, as pointed out by Wetzel (1975). Calculation of the extinction coefficient (K) was theoretically proposed by Sverdrup et al. (1942), and empirically adjusted by Margalef (1983). The empirical relationship has been expressed as follows:
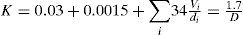
where 0.03 is the water extinction value at 540nm; 0.0015 is the extinction due to chlorophyll a inmgm-3; ∑i34Vidi is the extinction due to suspended particles and D is the depth observed with the Secchi disk.
Originally, Sverdrup et al. (1942) proposed a constant of 2.3, obeying the exponential characteristic of pure water absorption. However, Margalef’s adjustment takes into account the actual elements in the water volume. Thus, empirically, a constant of 1.7 is the value best adjusted to experimental data obtained in a number of different water bodies.
Hyperspectral measurementsReflectance data were recorded at each sampling point with a hyperspectral spectroradiometer (ger-1500). This radiometer is portable and gives fast hyperspectral scanning; it has a spectral range from 380nm to 1100nm. It has an objective lens with 8°field of view that allows for a precise focusing on the target. However, optical radiation measurements are carried out through an aperture with a field of view of only 1º. ger-1500 has a spectral precision of±2nm. The instrument also has an integrating card of 512K containing the ger-1500 operating program, correcting factors and memory slots for up to 400 readings. These measurements can be handled as output ascii files.
Reflectance was measured by the Bi-Directional Reflectance Factor (brf) method derived from the Bi-Directional Reflectance Distribution Function (bdrf) proposed by Swain and Davis (1978) and by Milton (1987). The brf method is based on the use of a perfect reflecting and diffusing surface as a reference. Thus, the reflectance factor is defined as the ratio between the reflected flux from a target under specific irradiance and observation conditions and the diffusing surface identically irradiated and observed. Perfect diffusion means that the surface isotropically reflects radiation; such surfaces are known as “lambertians”. Since natural targets are not perfectly diffusing surfaces, intensity of reflected flux depends on the outgoing flux angle. Perfect reflection means that the entire flux incident on the surface is reflected from it, and neither absorption nor transmitting processes are involved. Since in practice, there are no such panels or surfaces with these properties, a correction must be applied considering the spectral reflectance from the panel. Hence, brf is defined as follows:

where dLt is the target radiance, dLp is the reference radiance under the same specific illumination and observation conditions, and k is the panel correction factor. Incoming and outgoing radiation were sequentially measured three times and afterwards averaged. Outgoing radiation was measured by pointing the sensor at the sunny side of the boat in order to avoid its shadow, which can produce an error of up to 30% (Gordon, 1985). The sensor was positioned to obtain a nadir view of the water surface. This setting reduces unwanted radiances from the reflected light that is independent from the optical properties of water (Shifrin, 1988). Incoming radiation was measured by observing a halon reference panel (polytetrafluoretylene). It is a resistant and hydrophobic panel (i. e. washable and insensitive to humidity changes), so is suitable for fieldwork (Weidner and Hsia, 1981; Schutt et al., 1981).
Reflectance spectra were obtained by measuring water body radiance and then sequentially measuring the halon panel radiance. The ratio of the two measurements was applied as stated in equation 2 and multiplied by a correction factor of 0.99 according to the manufacturer’s manual. Reflectance spectra were corrected for water/sky glint by subtracting the reflectance measured at 750nm from each spectrum. It is assumed that at this wavelength water absorbs all the incoming radiation. Care must be taken at the blue end of the electromagnetic spectrum since imprecision due to scattering may occur.
Derivative analysisTo obtain fourth-order derivative spectral curves, a homemade algorithm was written in Matlab, which includes a 15-point convolution filter based on Savitzky and Golay’s coefficients (1964), expressed as follows:

with a normalization factor N=92378. Equation 3 was applied to the original reflectance curves measured in the field.
This type of filter is routinely used on conventional uv-vis-ir spectrophotometers.
Maxima found in the spectral derivatives correspond to reflectance peaks while minima are associated with absorption peaks (Aguirre et al., 2001).
Phytoplankton dataPhytoplankton samples were collected at the seven sampling points using plastic bottles at the surface and at the Secchi depth for later quantitative analysis. Samples were frozen for subsequent laboratory analysis. Concentrations of chlorophyll a (Chl a) at selected stations were obtained from a 200ml sample of surface water and were extracted with acetone at 90% and then filtered through 0.45µmglass-fiber filters (Whatman GF/F) ground and centrifuged. Fluorometric measurement of Chl a was performed by the method of Holm-Hansen et al. (1965) using a Sequoia-Turner Model 450 fluorometer (Sequoia-Turner Corporation, MountainView,ca,usa) with excitation filter at 440nm and emission filter at 665nm as described by Parsons et al. (1984). Standard Chl a calibration for determination was performed by the method described by unesco (1994). Chl a reagent (Wako Pure Co. Ltd., super grade) was dissolved in 90% acetone. The specific absorption coefficient is 87.67 for 90% acetone (Jeffrey and Humphrey, 1975; Porra et al., 1989). Using these precise Chl a concentrations, a factor (ti) of the equation for fluorometric Chl a determination was calculated for 90% acetone:
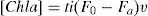
where [Chl a] is in µgl-1; Fo is the original fluorescence, Fa is the fluorescence after acidification, and v is the dilution factor from the volume of filtered and extracted solution. In this study, all Chl a determinations were performed in duplicate.
Trophic state indexIn order to relate [Chl a] to Secchi transparency a comparative analysis between the two variables was carried out. The trophic state can be defined as the total weight of living biological material (biomass) in a water body at a specific location and time. According to this definition, Carlson (1977) proposed a trophic state index (tsi) using algal biomass as the basis for trophic state classification. In this he included three variables: chlorophyll pigments, Secchi depth, and total phosphorus. The index reflects a continuum of “states.” Thus, the trophic continuum is divided into units based on a base-2 logarithmic transformation of Secchi depth. The range of the index is from approximately 0 to 100, although the index has theoretically no lower or upper bounds. The logarithmic transformation of the data normalizes the skewed data distribution, allowing the use of parametric statistics such as mean, standard deviation, parametric comparison tests.
The three index variables are interrelated by linear regression models, and should produce the same index value for a given combination of variable values. Thus, any of the three variables can theoretically be used to classify a water body. In this paper we only included Secchi disk transparency (SD) and Chlorophyll a concentration (Chl a) values, since total phosphorus analysis were not performed. For the purpose of classification, priority is given to chlorophyll, because this variable is the most accurate of the three at predicting algal biomass. The Trophic State Index (tsi) was calculated by using a couple of simplified equations:
Results and analysis

Reflectance curves are the resulting combination of spectral signatures from phytoplankton and aquatic vegetation, mainly at the green and infrared regions. The reflective responses of the seven sampling points in Zumpango Lake were alike, having a similar shape but a slightly different magnitude (Figure 2). Hence, derivative reflectance spectrum from each sampling site was analogous.

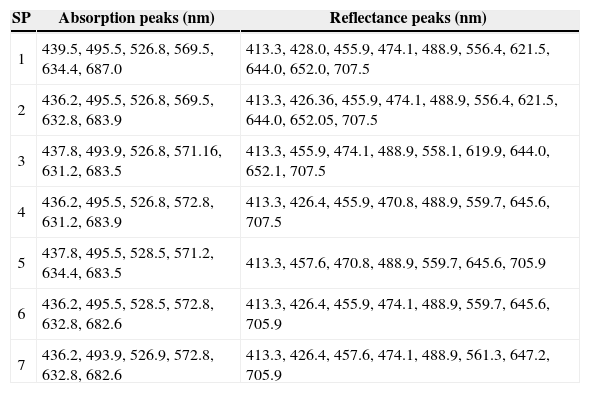
A representative derivative spectrum is shown in Figure 3. Here, both minima and maxima values are nearly found at the same position as seen in Table 1, which respectively summarize the absorption and reflectance peaks from each sampling point in Zumpango Lake.

Averaged absorption and reflectance peaks and integrated spectral curves from seven sampling points in Zumpango Lake
| SP | Absorption peaks (nm) | Reflectance peaks (nm) |
|---|---|---|
| 1 | 439.5, 495.5, 526.8, 569.5, 634.4, 687.0 | 413.3, 428.0, 455.9, 474.1, 488.9, 556.4, 621.5, 644.0, 652.0, 707.5 |
| 2 | 436.2, 495.5, 526.8, 569.5, 632.8, 683.9 | 413.3, 426.36, 455.9, 474.1, 488.9, 556.4, 621.5, 644.0, 652.05, 707.5 |
| 3 | 437.8, 493.9, 526.8, 571.16, 631.2, 683.5 | 413.3, 455.9, 474.1, 488.9, 558.1, 619.9, 644.0, 652.1, 707.5 |
| 4 | 436.2, 495.5, 526.8, 572.8, 631.2, 683.9 | 413.3, 426.4, 455.9, 470.8, 488.9, 559.7, 645.6, 707.5 |
| 5 | 437.8, 495.5, 528.5, 571.2, 634.4, 683.5 | 413.3, 457.6, 470.8, 488.9, 559.7, 645.6, 705.9 |
| 6 | 436.2, 495.5, 528.5, 572.8, 632.8, 682.6 | 413.3, 426.4, 455.9, 474.1, 488.9, 559.7, 645.6, 705.9 |
| 7 | 436.2, 493.9, 526.9, 572.8, 632.8, 682.6 | 413.3, 426.4, 457.6, 474.1, 488.9, 561.3, 647.2, 705.9 |
This spectral similarity could be interpreted as a consequence of the hyacinth dredging, homogeneously distributed in the water body. The evenly distribution of submerged vegetation is apparent in the landsat-tm satellite image taken in the summer of 2003 after the hyacinth milling process, which has frequently been performed on a regular basis since then (Figure 1).
The spectral signatures show typical characteristics of eutrophic waters, with absorption zones at the 400 -500nm (blue) and 600 – 700nm (red) intervals (Dekker et al., 1991). Likewise, there are reflectance regions at 550nm (green) and at 710nm (near infrared). The difference in reflectance magnitude can be associated with either a greater depth in the water body or with a lesser volumetric concentration of aquatic vegetation and phytoplankton.
Derivative analysis revealed six absorption peaks over a wide range of wavelengths. Three of these were of particular importance: a) in the interval 400-500nm there was a conspicuous average peak m=437.13 (s=1.19), corresponding to the blue absorption of chlorophyll; b) in the interval 600-700nm, there were other two relevant absorption peaks at the averaged position m=632.80 (s=1.21) due to water absorption which is in good agreement with peaks found by Pegau and Zaneveld (1993) and, finally, the peak at m=683.86 (s=1.38) that can be linked to chlorophyll a when the concentration of this pigment is over 3mgm-3 (Gitelson et al., 1993). Additionally, there was a shoulder around 644nm in the red region, which might be related to an inflexion region due, or related, to chlorophyll red absorption.
On the other hand, ten reflectance peaks were revealed by the derivative method, however only two can be associated to phytoplankton and/ or submerged vegetation. These included one in the green region at the averaged position m=558.76 (s=1.86), which corresponds to chlorophyll a reflectance, and one in the infrared region at the averaged location m=706.14 (s=1.21), caused by the high reflectance of vegetation at this portion of the electromagnetic spectrum.
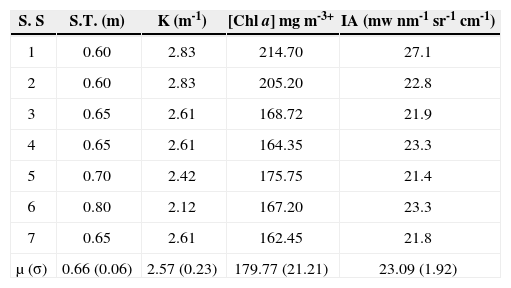
The mean value of the integrated energy is 23.09mwnm-1 sr-1cm-1 (s=1.92), being higher at sampling point 1 (27.1) and lower at the point 5 (21.4).
Chlorophyll a concentration, expressed as bio-mass, showed a similar and homogeneous spectral trend over the water body extrapolated from the sampling points. Table 2 shows chlorophyll a concentration values for each sampling site associated to the integrated spectral area. Sampling sites 1 and 2, located at the northern part of the lake, showed the highest Chl a values. This can be explained by the presence of agricultural fields and sewage discharges. Chlorophyll a mean value was of 179.77±21.21mgm-3, which is clearly indicative of eutrophic waters, and the correlation coefficient between chlorophyll concentration and spectral area was 0.69. Similar results for urban lakes have been reported elsewhere (e. g., Martínez and Jáuregui, 2000; Oliva et al., 2008).
Secchi transparency (S.T), Extinction Coefficient (K), Chlorophyll a concentration ([Chl a]), and integrated spectral curves (IA) for each sampling site
| S. S | S.T. (m) | K (m-1) | [Chl a]mgm-3+ | IA (mwnm-1 sr-1 cm-1) |
|---|---|---|---|---|
| 1 | 0.60 | 2.83 | 214.70 | 27.1 |
| 2 | 0.60 | 2.83 | 205.20 | 22.8 |
| 3 | 0.65 | 2.61 | 168.72 | 21.9 |
| 4 | 0.65 | 2.61 | 164.35 | 23.3 |
| 5 | 0.70 | 2.42 | 175.75 | 21.4 |
| 6 | 0.80 | 2.12 | 167.20 | 23.3 |
| 7 | 0.65 | 2.61 | 162.45 | 21.8 |
| µ(σ) | 0.66 (0.06) | 2.57 (0.23) | 179.77 (21.21) | 23.09 (1.92) |
Secchi transparency in the lake averaged 66 (0.06)cm, which corresponds to a mean extinction coefficient of K=2.57 (0.23)m-1 (Table 2); this value can be associated with turbid waters according to Jerlov’s classification (1976). Sampling site 6 had the maximum value of Secchi transparency, which can be explained by its depth and for being located away of the lake’s border influence.
Trophic State Index values for Chl a and Secchi disk transparency, revealed eutrophic and hyper-eutrophic conditions, respectively (Carlson, 1983). Thus, the tsi for Secchi disk transparency was 54.1 which corresponds to eutrophic waters and suggests anoxic hypolimnia, whilst tsi value for Chl a was 81.51, classified in the hyper-eutrophic waters interval, characterized by algal scum and few macrophytes (Carlson, 1983). Moreover and according to Carlson and Simpson (1996), since tsi(Chl)>tsi(SD), a possible explanation for this condition is the presence and dominance of large particles in the lake, which, in the case of Zumpango Lake is represented by the presence of the milled water hyacinth all over the site.
ConclusionsMeasured spectral curves clearly show the presence of phytoplankton and / or submerged higher plants, mainly water hyacinth (Eichhornia spp) and duckweed (Lemna sp). Zumpango Lake is a unique case among the remnant water bodies in the basin of Mexico because of its homogeneous spectral response. This characteristic is mainly due to a strong wind mixing, which distributes mechanically milled hyacinth.
Water coloration and depth affect the outgoing energy as measured through integrated spectral curves. A good statistical correlation was found between [Chl a] and integrated spectral areas; thus, it implies that a low percentage of light penetration and high chlorophyll a concentration are suitable indicators of eutrophication. Hyperspectral remote sensors offer the possibility of a detailed analysis of the spectral behavior. For a better characterization it is helpful to have ancillary information, allowing anthropogenic and natural influences on continental water bodies to be assessed.