


Scientific fields employ distinct citation practices. As such, bibliometric indicators based on citations need to be standardized to allow comparisons between fields. This paper examines more than six hundred journals in eight JCR categories. Results indicate that impact maturation rates vary considerably from one category to another. The time elapsed until the citation distribution reaches a maximum oscillates between two and five years; hence the opening and closing of the citation window is crucial to the impact factor. Some journals are penalized by the two-year impact factor and benefited by the five-year impact factor, and the reverse situation was also found. Nonetheless, there are impact factors of variable citation windows that produce closer measures of central tendency.
Los distintos campos científicos presentan prácticas de citación diferentes. Por ello, los indicadores bibliométricos basados en citas necesitan ser normalizados para permitir comparaciones entre campos. En este trabajo se analizan más de 600 revistas de ocho categorías JCR. Los resultados obtenidos indican que la velocidad de maduración del impacto varía considerablemente de una categoría a otra. El tiempo transcurrido hasta que la distribución de citas alcanza su máximo oscila entre 2 y 5 años, de ahí que el comienzo y finalización de la ventana de citación tengan un efecto determinante sobre el factor de impacto. Algunas revistas son penalizadas por el factor de impacto a 2 años y favorecidas por el de 5 años, y viceversa. Sin embargo, existen factores de impacto con ventanas variables de citación que producen, en términos generales, medidas de tendencia central más próximas.
For several decades now the field of bibliometrics has accepted the impact factor (if) as a valid indicator for evaluation of journals. In recent times, however, more and more arguments against the use of if as the sole criterion for making comparisons have been proffered (Waltman and Van Eck, 2013).
The two-year impact factor released by Thomson Reuters in Journal Citation Reports (JCR) is the average number of citations of each journal in the current year with regard to the citable items published in a journal in the two previous years. (Garfield, 1972). Since its formulation, IF has been subject to some criticism with regard to arbitrariness, such as in the definition of “citable items” and the focus on a two-year window, to name just two (Bensman, 2007; Moed et al., 2012). These criticisms have led to several adjustments to how if is calculated (Althouse et al., 2009; Bornmann and Daniel, 2008). In 2007, Thomson Reuters incorporated three indicators that employ a five-year citation window. These indicators are as follows: the five-year if itself, the eigenfactor score and the article influence score (Bergstrom, 2007). These additions notwithstanding, there are no significant differences between the ranking of journals using the two-year and five-year approaches (Leydesdorff, 2009), even while in many instances those using the five-year window attain higher impacts than those using the two-year modality (Rousseau, 2009).
These indicators are useful for comparing the impacts of journals in the same field; however, they are not as useful for making comparisons between fields. This problem arises from the institutional evaluation, since scientists in research centers have diverse educational antecedents (Leydesdorff and Bornmann, 2011; Van Raan et al., 2010; Wagner et al., 2011). Before comparing journals, these diverse publication and citation habits require standardization of bibliometric indicators based on citations.
There are statistical patterns that can provide if standardization. Garfield (1979) proposes the term “citation potential,” based on the average number of citations in order to adjust the systemic differences existing between scientific fields. For example, in the biomedical field, lists of fifty or more citations is quite common, while in mathematics less than twenty citations are most common (Dorta-González and Dorta-González, 2013a). These differences are owing to distinct citation cultures that significantly affect the if by conditioning the likelihood of citation. The citation average has been used frequently in the literature to adjust differences existing between fields (Leydesdorff and Bornmann, 2011; Moed, 2010; Zitt and Small, 2008). The average number of citations is not among the variables that can fully explain if variance (Dorta-González and Dorta-González, 2014). As such, the standardization process should take into account other sources of this variance, such as growth of the field, the citation to JCR journal ratio, the JCR citation to citation window ratio and the citing-document to cited documents ratio. Because of the significant differences in citation practices from field to field, bibliometric indicators must be developed to allow meaningful comparisons between fields (Waltman and Van Eck, 2013).
Traditionally, the standardization of the differences existing between fields has been based on some sort of journal classification system. This approach places each journal into one or more groups, and its if is calculated against that of the other publications in the group. Most efforts to classify journals focus on correlation between citation patterns, such as the JCR journal categories. In this case, for example, Egghe and Rousseau (2002) propose the aggregate impact factor that treats all of the journals within a category as a single meta-journal. The field to which many journals belong, however, is often difficult to determine with any precision; and some journals are assigned to two or more categories. Moreover, the defining the boundaries of scientific fields and specializations is a persistent bugbear for bibliometrics, since these borders are quite porous and often shift over time. As such, the use of fixed categories to classify a dynamic system can lead to errors, because such a classification relies on historical data, while science unfolds dynamically (Leydesdorff, 2012: 359).
A recent alternative proposal would standardize on the basis of source rather than on field. In this approach, standardization is a function of the citing journals. The quality of a journal is a complex, multidimensional concept that is difficult to state in a single indicator (Moed et al., 2012: 368). Because of this difficulty, many indicators have been put forth, such as the fractional recount impact factor (Leydesdorff and Bornmann, 2011), the audience factor (Zitt and Small, 2008), the source standardized impact factor (Moed, 2010), the topic standardized impact factor (Dorta-González et al., 2014), the Scimago group's sjr (González-Pereira, Guerrero-Bote and Moya-Anegón, 2009) and the central area index (Egghe, 2013; Dorta-González and Dorta-González, 2010, 2011), to name a few. While these indicators have their uses, none of them can genuinely reflect the differences against impact maturation times.
As previously mentioned, bibliometrics literature has examined these matters using if with fixed citation windows of between two to five years. To the best of our knowledge, there have been no studies published that analyze indicators on the basis of year of start and year of conclusion of these citation windows. This paper shall examine hoe if is affected by year of start and year of end of the citation windows. For this purpose, the impact factors of the fixed, two- and five-year windows shall be contrasted to others using variable windows.
This new methodology seeks to detect the differences between fields, adjusting the start year and the amplitude of the citation window to the citation maturation time in each field. To achieve this, an empirical comparison is made of five indicators for 600 journals across eight categories.
CITATION WINDOW AND IMPACT MATURATION TIMEA journal impact indicator is the gauge of the number of times that the papers published in a given census period cite the papers published within a previously set citation window. The impact maturation time of a journal is related to the time lapsed from publication of a volume of the same to the year in which its citation distribution reaches its maximum value.
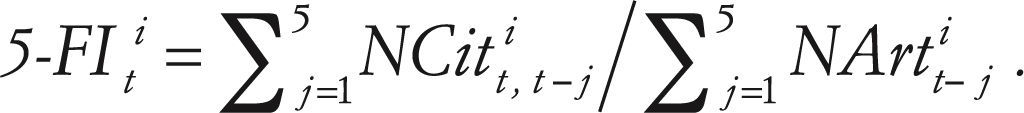
Two- and five-year citation windowsThe census period of the two-year if issued by Thomson Reuters is one year and it employs the previous two years as the citation window. As an average, this indicator is based on two elements: the numerator, which is the number of citations in the current year of items published in a journal in the two previous years; and the denominator, which is the number of “citable items” published in those same two years (Garfield, 1972). The items published include citable items, editorials, news, corrections, etc. Similarly, the five-year if covers a census period of one years and a citation window consisting of the five previous years. Where is NArtti the number of citable items in the year t of journal i, and NCitt,t−ji is the number of times in year t that the volumes of year t-j of journal i are cited. The n-year if for year t of the journal is attained as follows:

The two-and five-year if are calculated respectively as follows:
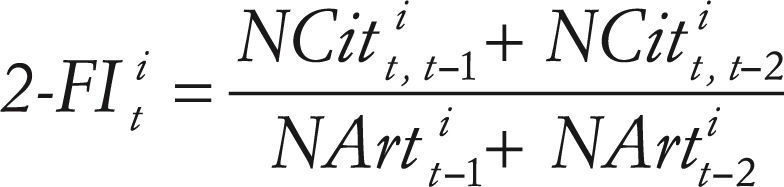
and
The citation potential is a source of variance in the if of n years. This potential depends on the scientific field and is determined by the frequency and speed with which the authors cite other works, as well as by the depths with which the field in question is covered by the data base examined. In this way, the citation potential is a gauge of the currency and popularity of the field (Moed et al., 2012). The most popular fields tend to attract many authors with shared interests. As such, these fields develop rapidly. The papers are published in a limited number of highly visible journals, and the authors tend to cite their colleagues’ most recent work. These fields often attain higher two-year if (Moed et al., 2012).
In this way, there is no optimal n value possible for all journals and fields. In some cases, the two-year window provides a very good gauge of impact, while in other cases three or more years are needed.
Three-year citation windowThe Elsevier Scopus impact indicator also uses a census period of one year, while employing the three previous years as the citation window. The numerator is the number of citations in the current year of the items published in the three previous years, and the denominator is the number of items that have passed peer review (papers, reviews and congress records) and have been published in that same period. This intermediate citation window, however, does not provide a solution to the problem, since in some cases the maximum citation distribution is reached before the end of the three-year period, while in other instances this maximum is attained later.
Complete citation windowIn addition to the variance within each year, the inter-annual variance can be reduced using all of the citations, that is, by employing the complete citation window instead of that with the last n years. This model, however, does not improve upon the model that employs the window of the previous n years (Leydesdorff and Bornmann, 2011: 228).
CITATION WINDOW WITH VARIABLE START YEAR AND AMPLITUDEAs previously stated, an impact indicator is a measure of the number of times that papers published in a given census period cite the papers published during a previously determined citation window. The optimal amplitude of the citation window, however, may vary over time and from field to field. Moreover, despite the decades-long use of fixed citation windows, there is no evidence in the literature to justify the preference of fixed over variable citation windows.
The problem of defining boundaries between fields and specializations is one that persists in bibliometrics, because any such delimiters tend to become porous because of the dynamism of scientific fields. For this reason, citation windows established on the basis of topical category are not recommendable.
Researchers in fields with rapidly maturing impacts tend to “consume” scientific output immediately, which is to say they spread and cite such output with alacrity. This occurs most notably; for example, in biomedicine and computer science. In contrast, the consumption of scientific output is less rapid in fields with slower impact maturation, such as mathematics and economy.
There is no single maturation time valid for all journals. The selection of a variable citation window, rather than a fixed window of two, three or five years, is done on the basis of empirical evidence that many fields do not reach their maximum values in two years, while in other fields this value is reached well before five years. As such, the use of a variable window represents an optimal compromise for those fields that are slower to reach maximum citation values, and without penalizing those fields whose impacts mature more rapidly.
Figure 1 shows the distribution of citations for four journals. Journals a and c belong to a rapid impact maturation field, while b and c belong to a slow impact maturation field. Since the number of citations is the numerator in the impact formula, when all of these journals have published the same number of papers in recent years, a shall have a greater impact than c, and b shall have a greater impact than d. Nonetheless, the question of which journals (a or b, c or d) have the greater impact persists.
.")
For year t of journal i, we define the if with a start window at j and end at k, as follows:
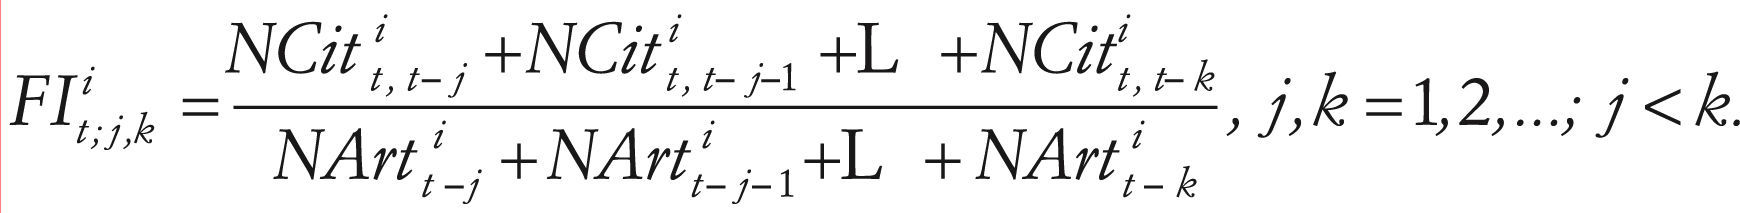
For the purpose of simplicity, we shall use the notation FIj,k, in the understanding that the journal and the year are fixed. For example FI3,4 represents the if with a window starting at three and ending in 4, i.e., accounting for citations of papers occurring between three and four years ago. Figure 1 shows several if with citations windows with different starts and ends, in which one can observe that the Thomson Reuters if at two and five years, respectively, of FI1,2 y FI1,5 coincide.
For year t of journal i, we define the impact maturation time as the number of years transpiring from t to the time the journal reaches maximum impact. Figure 1 shows how the impact maturation time of journals a and c is two years, while the impact maturation time of journals b and d is six years. The impact maturation speed is, therefore, much higher in journals a and c.
METHODS AND MATERIALSIn the empirical application under study we find that the citation window for the if produces closer data distributions, central tendencies and variabilities across several scientific fields. The bibliometric data used were gathered from the online version of Journal Citation Reports (JCR) of 2011, during the first week of November 2012. The JCR data base is managed by Thomson Reuters (Philadelphia, usa) and is hosted at: www.webofscience.com. In the JCR, the experts at Thomas Reuters assign journals to one or more categories in accord with the journals cited and citing journals. These categories are treated as scientific fields or specializations.
The comparative analysis performed in this study employs a randomly selected journal category from each of the eight clusters obtained by Dorta-González and Dorta-González (2013a, 2013b). This is done in order obtain journals with significantly diverse publication and citation habits. The research mentioned analyzes all of the thematic categories in the Science Citation Index Expanded and Social Science Citation Index. From among the eight clusters identified, six include a significant number of categories. Two of these are quite large, each with more than 25% of the categories that include physical and life sciences (mathematics, physics, chemistry and biomedicine). The next two clusters contain those areas of the social sciences that are less reliant on mathematics (education, sociology, languages and law). The final two clusters include life sciences with an important social component and those sciences generally more reliant on mathematics (psychology, economy and business).
This study examines a total of 618 journals, which in terms of numbers break down as follows: Astronomy & Astrophysics (56); Biology (85); Ecology (134); Engineering, Aerospace (27); History & Philosophy of Science (56); Mathematics, Interdisciplinary Applications (92); Medicine, Research & Experimental (112); Multidisciplinary Sciences (56).
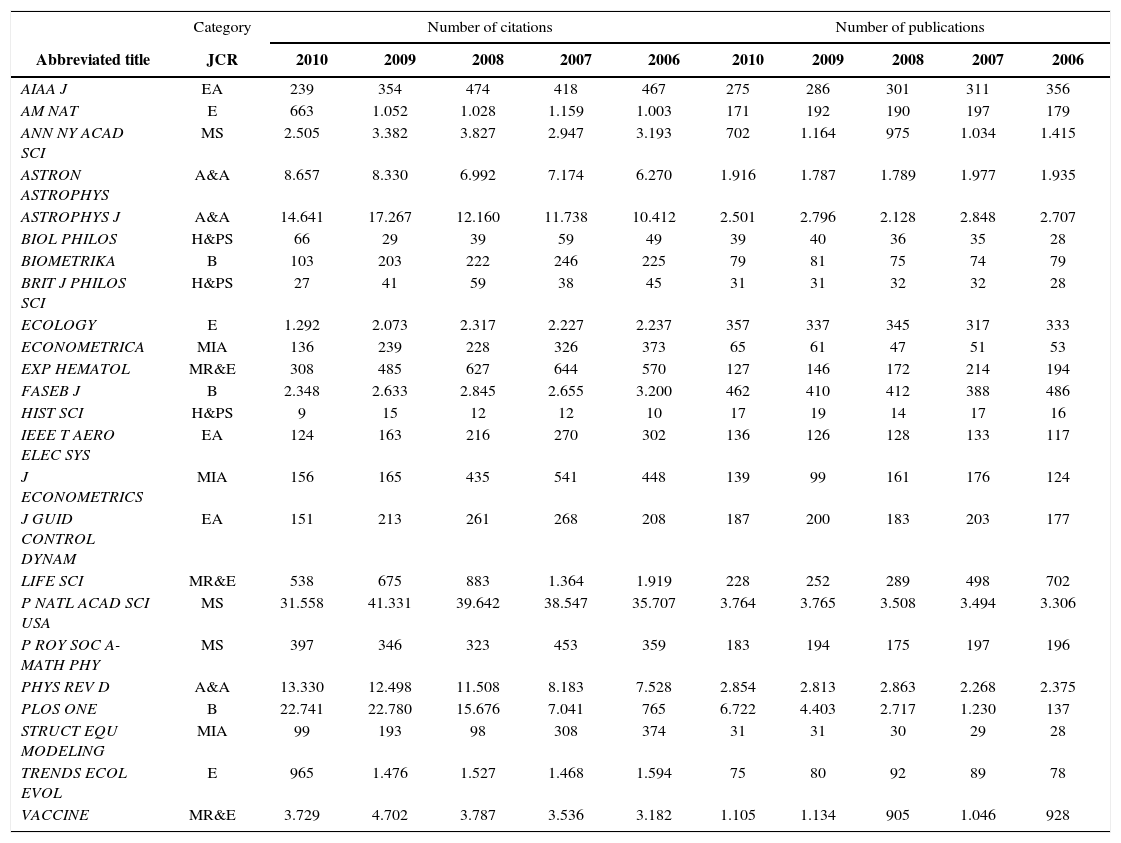
RESULTS AND DISCUSSIONTable 1 shows a sample of 24 journals randomly selected from the most widely cited journals in eight JCR categories. This table contains the citations in 2011 of items and in the period 2006-2010 and number of publications. One can easily observe the significant differences in number of publications and the citations occurring between journals and fields. This variance in the data directly affects the variability of the impact factors. Particularly, one can observe an exponential increase in the number of publication in PLOS ONE and linear reductions in ANN NY ACAD SCI and LIFE SCI.
Sample of 24 randomly selected journals from the most often cited JCR category.
| Category | Number of citations | Number of publications | |||||||||
|---|---|---|---|---|---|---|---|---|---|---|---|
| Abbreviated title | JCR | 2010 | 2009 | 2008 | 2007 | 2006 | 2010 | 2009 | 2008 | 2007 | 2006 |
| AIAA J | EA | 239 | 354 | 474 | 418 | 467 | 275 | 286 | 301 | 311 | 356 |
| AM NAT | E | 663 | 1.052 | 1.028 | 1.159 | 1.003 | 171 | 192 | 190 | 197 | 179 |
| ANN NY ACAD SCI | MS | 2.505 | 3.382 | 3.827 | 2.947 | 3.193 | 702 | 1.164 | 975 | 1.034 | 1.415 |
| ASTRON ASTROPHYS | A&A | 8.657 | 8.330 | 6.992 | 7.174 | 6.270 | 1.916 | 1.787 | 1.789 | 1.977 | 1.935 |
| ASTROPHYS J | A&A | 14.641 | 17.267 | 12.160 | 11.738 | 10.412 | 2.501 | 2.796 | 2.128 | 2.848 | 2.707 |
| BIOL PHILOS | H&PS | 66 | 29 | 39 | 59 | 49 | 39 | 40 | 36 | 35 | 28 |
| BIOMETRIKA | B | 103 | 203 | 222 | 246 | 225 | 79 | 81 | 75 | 74 | 79 |
| BRIT J PHILOS SCI | H&PS | 27 | 41 | 59 | 38 | 45 | 31 | 31 | 32 | 32 | 28 |
| ECOLOGY | E | 1.292 | 2.073 | 2.317 | 2.227 | 2.237 | 357 | 337 | 345 | 317 | 333 |
| ECONOMETRICA | MIA | 136 | 239 | 228 | 326 | 373 | 65 | 61 | 47 | 51 | 53 |
| EXP HEMATOL | MR&E | 308 | 485 | 627 | 644 | 570 | 127 | 146 | 172 | 214 | 194 |
| FASEB J | B | 2.348 | 2.633 | 2.845 | 2.655 | 3.200 | 462 | 410 | 412 | 388 | 486 |
| HIST SCI | H&PS | 9 | 15 | 12 | 12 | 10 | 17 | 19 | 14 | 17 | 16 |
| IEEE T AERO ELEC SYS | EA | 124 | 163 | 216 | 270 | 302 | 136 | 126 | 128 | 133 | 117 |
| J ECONOMETRICS | MIA | 156 | 165 | 435 | 541 | 448 | 139 | 99 | 161 | 176 | 124 |
| J GUID CONTROL DYNAM | EA | 151 | 213 | 261 | 268 | 208 | 187 | 200 | 183 | 203 | 177 |
| LIFE SCI | MR&E | 538 | 675 | 883 | 1.364 | 1.919 | 228 | 252 | 289 | 498 | 702 |
| P NATL ACAD SCI USA | MS | 31.558 | 41.331 | 39.642 | 38.547 | 35.707 | 3.764 | 3.765 | 3.508 | 3.494 | 3.306 |
| P ROY SOC A-MATH PHY | MS | 397 | 346 | 323 | 453 | 359 | 183 | 194 | 175 | 197 | 196 |
| PHYS REV D | A&A | 13.330 | 12.498 | 11.508 | 8.183 | 7.528 | 2.854 | 2.813 | 2.863 | 2.268 | 2.375 |
| PLOS ONE | B | 22.741 | 22.780 | 15.676 | 7.041 | 765 | 6.722 | 4.403 | 2.717 | 1.230 | 137 |
| STRUCT EQU MODELING | MIA | 99 | 193 | 98 | 308 | 374 | 31 | 31 | 30 | 29 | 28 |
| TRENDS ECOL EVOL | E | 965 | 1.476 | 1.527 | 1.468 | 1.594 | 75 | 80 | 92 | 89 | 78 |
| VACCINE | MR&E | 3.729 | 4.702 | 3.787 | 3.536 | 3.182 | 1.105 | 1.134 | 905 | 1.046 | 928 |
JCR Categories: A&A, Astronomy & Astrophysics; B, Biology; E, Ecology; EA, Engineering, Aerospace; H&PS, History & Philosophy of Science; MIA, Mathematics, Interdisciplinary Applications; MR&E, Medicine, Research & Experimental; MS, Multidisciplinary Sciences.
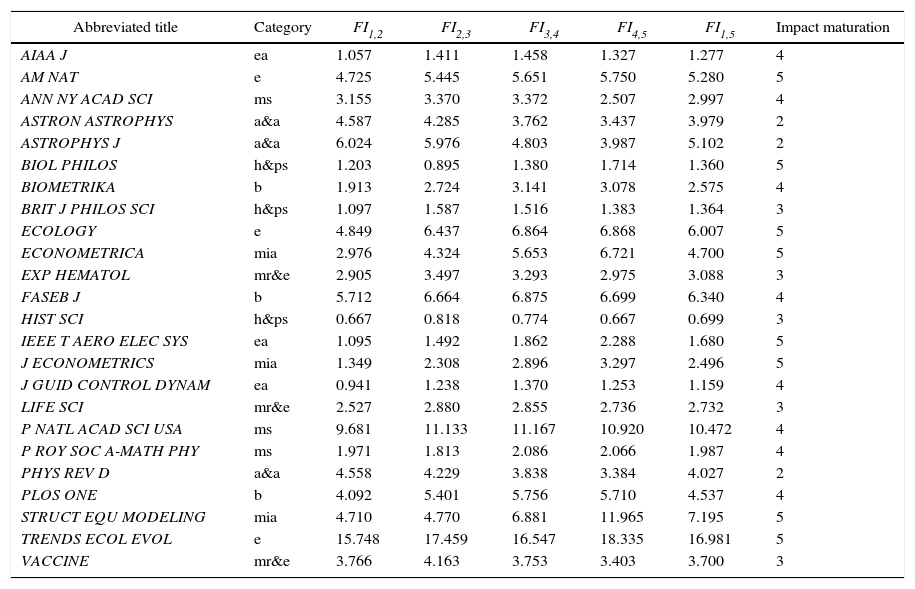
Table 2 shows some impact factors for the journals under study with variations of the years of start and end of the citation window. The impact maturation time varies considerably from one category to another. The number of years transpiring until the citation distribution attains its maximum oscillates between two and five years, and one can also observe the amplitude in the variation interval for each indicator. For example, FI1,2 varies between 0.667 and 15.748.
Effect of the citation window on impact factor.
| Abbreviated title | Category | FI1,2 | FI2,3 | FI3,4 | FI4,5 | FI1,5 | Impact maturation |
|---|---|---|---|---|---|---|---|
| AIAA J | ea | 1.057 | 1.411 | 1.458 | 1.327 | 1.277 | 4 |
| AM NAT | e | 4.725 | 5.445 | 5.651 | 5.750 | 5.280 | 5 |
| ANN NY ACAD SCI | ms | 3.155 | 3.370 | 3.372 | 2.507 | 2.997 | 4 |
| ASTRON ASTROPHYS | a&a | 4.587 | 4.285 | 3.762 | 3.437 | 3.979 | 2 |
| ASTROPHYS J | a&a | 6.024 | 5.976 | 4.803 | 3.987 | 5.102 | 2 |
| BIOL PHILOS | h&ps | 1.203 | 0.895 | 1.380 | 1.714 | 1.360 | 5 |
| BIOMETRIKA | b | 1.913 | 2.724 | 3.141 | 3.078 | 2.575 | 4 |
| BRIT J PHILOS SCI | h&ps | 1.097 | 1.587 | 1.516 | 1.383 | 1.364 | 3 |
| ECOLOGY | e | 4.849 | 6.437 | 6.864 | 6.868 | 6.007 | 5 |
| ECONOMETRICA | mia | 2.976 | 4.324 | 5.653 | 6.721 | 4.700 | 5 |
| EXP HEMATOL | mr&e | 2.905 | 3.497 | 3.293 | 2.975 | 3.088 | 3 |
| FASEB J | b | 5.712 | 6.664 | 6.875 | 6.699 | 6.340 | 4 |
| HIST SCI | h&ps | 0.667 | 0.818 | 0.774 | 0.667 | 0.699 | 3 |
| IEEE T AERO ELEC SYS | ea | 1.095 | 1.492 | 1.862 | 2.288 | 1.680 | 5 |
| J ECONOMETRICS | mia | 1.349 | 2.308 | 2.896 | 3.297 | 2.496 | 5 |
| J GUID CONTROL DYNAM | ea | 0.941 | 1.238 | 1.370 | 1.253 | 1.159 | 4 |
| LIFE SCI | mr&e | 2.527 | 2.880 | 2.855 | 2.736 | 2.732 | 3 |
| P NATL ACAD SCI USA | ms | 9.681 | 11.133 | 11.167 | 10.920 | 10.472 | 4 |
| P ROY SOC A-MATH PHY | ms | 1.971 | 1.813 | 2.086 | 2.066 | 1.987 | 4 |
| PHYS REV D | a&a | 4.558 | 4.229 | 3.838 | 3.384 | 4.027 | 2 |
| PLOS ONE | b | 4.092 | 5.401 | 5.756 | 5.710 | 4.537 | 4 |
| STRUCT EQU MODELING | mia | 4.710 | 4.770 | 6.881 | 11.965 | 7.195 | 5 |
| TRENDS ECOL EVOL | e | 15.748 | 17.459 | 16.547 | 18.335 | 16.981 | 5 |
| VACCINE | mr&e | 3.766 | 4.163 | 3.753 | 3.403 | 3.700 | 3 |
Impact maturation: Year in which citation distribution attains peak. JCR Categories: A&A, Astronomy & Astrophysics; B, Biology; E, Ecology; EA, Engineering, Aerospace; H&PS, History & Philosophy of Science; MIA, Mathematics, Interdisciplinary Applications; MR&E, Medicine, Research & Experimental; MS, Multidisciplinary Sciences.
Table 3 provides the Pearson correlation coefficient for all of the indicator pairs, considering windows of two years for both the journal categories and the aggregated data, in the sample of 618 journals across eight JCR categories. The general pattern observed in this table is a strong correlation, with most correlations above 0.90. One must be cautious; however, before drawing conclusions from these correlations. The different indicators have skewed distributions, with many journals exhibiting rather low values and only a small number of journals exhibiting high values. These skewed distributions often give rise to high Pearson correlations.
Pearson correlations for rankings with two-year citation window.
| JCR category | Number of journals | FI2,3 | FI3,4 | FI4,5 | |
|---|---|---|---|---|---|
| Astronomy & Astrophysics | 56 | FI1,2 | 0.96 | 0.93 | 0.92 |
| FI2,3 | 0.94 | 0.91 | |||
| FI3,4 | 0.88 | ||||
| Biology | 85 | FI1,2 | 0.98 | 0.93 | 0.94 |
| FI2,3 | 0.98 | 0.96 | |||
| FI3,4 | 0.98 | ||||
| Ecology | 134 | FI1,2 | 0.99 | 0.98 | 0.97 |
| FI2,3 | 0.98 | 0.95 | |||
| FI3,4 | 0.97 | ||||
| Engineering, Aerospace | 27 | FI1,2 | 0.95 | 0.83 | 0.83 |
| FI2,3 | 0.91 | 0.90 | |||
| FI3,4 | 0.98 | ||||
| History & Philosophy of Science | 56 | FI1,2 | 0.89 | 0.82 | 0.85 |
| FI2,3 | 0.93 | 0.83 | |||
| FI3,4 | 0.92 | ||||
| Mathematics, Interdisciplinary Applications | 92 | FI1,2 | 0.91 | 0.81 | 0.77 |
| FI2,3 | 0.92 | 0.82 | |||
| FI3,4 | 0.90 | ||||
| Medicine, Research & Experimental | 112 | FI1,2 | 0.90 | 0.80 | 0.76 |
| FI2,3 | 0.94 | 0.89 | |||
| FI3,4 | 0.96 | ||||
| Multidisciplinary Sciences | 56 | FI1,2 | 0.96 | 0.91 | 0.91 |
| FI2,3 | 0.97 | 0.94 | |||
| FI3,4 | 0.94 | ||||
| Total | 618 | FI1,2 | 0.97 | 0.93 | 0.91 |
| FI2,3 | 0.97 | 0.94 | |||
| FI3,4 | 0.96 |
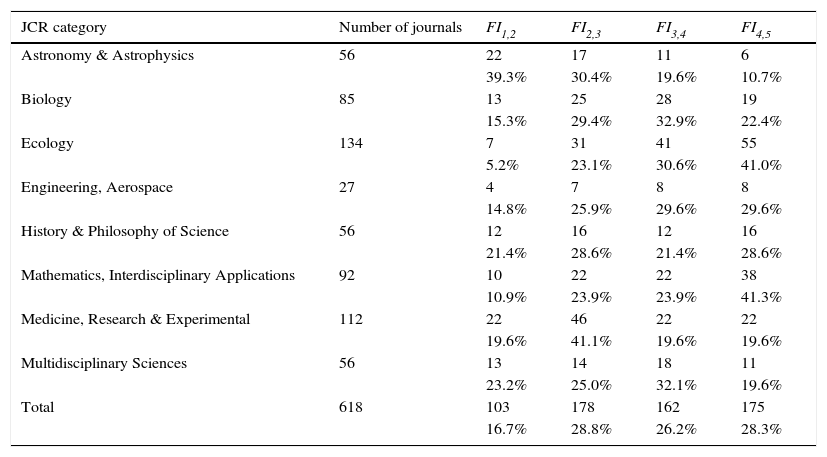
Table 4 shows the number of journals whose impact factors top out within the two-year citation window. It is interesting to note that there is no optimal impact maturation time for all fields. In some cases, a good gauge of impact is obtained in two years, but for others three years or more are needed. One can observe that the impact matures rapidly in Astronomy & Astrophysics (two years), followed by Medicine, Research & Experimental (three years). In Ecology, Mathematics and Interdisciplinary Applications impact matures much more slowly (five years). The remaining fields stand somewhere in between (four to five years).
Number of journals with impact maturation within the citation window.
| JCR category | Number of journals | FI1,2 | FI2,3 | FI3,4 | FI4,5 |
|---|---|---|---|---|---|
| Astronomy & Astrophysics | 56 | 22 | 17 | 11 | 6 |
| 39.3% | 30.4% | 19.6% | 10.7% | ||
| Biology | 85 | 13 | 25 | 28 | 19 |
| 15.3% | 29.4% | 32.9% | 22.4% | ||
| Ecology | 134 | 7 | 31 | 41 | 55 |
| 5.2% | 23.1% | 30.6% | 41.0% | ||
| Engineering, Aerospace | 27 | 4 | 7 | 8 | 8 |
| 14.8% | 25.9% | 29.6% | 29.6% | ||
| History & Philosophy of Science | 56 | 12 | 16 | 12 | 16 |
| 21.4% | 28.6% | 21.4% | 28.6% | ||
| Mathematics, Interdisciplinary Applications | 92 | 10 | 22 | 22 | 38 |
| 10.9% | 23.9% | 23.9% | 41.3% | ||
| Medicine, Research & Experimental | 112 | 22 | 46 | 22 | 22 |
| 19.6% | 41.1% | 19.6% | 19.6% | ||
| Multidisciplinary Sciences | 56 | 13 | 14 | 18 | 11 |
| 23.2% | 25.0% | 32.1% | 19.6% | ||
| Total | 618 | 103 | 178 | 162 | 175 |
| 16.7% | 28.8% | 26.2% | 28.3% |
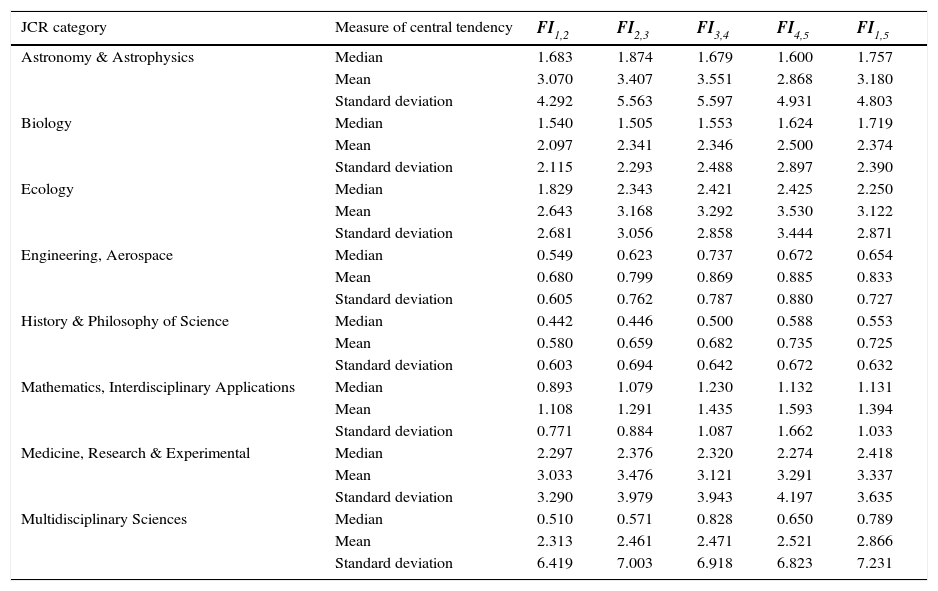
Finally, Table 5 shows the measures of central tendency and variability for the eight JCR categories under study. All indicators exhibit skewed distributions, with many journals having relatively low indicator values, and only a few with high values. This is why the medians of the distribution are well below the averages in all cases. One can observe large differences in the medians, means and standard deviations from category to category. In Multidisciplinary Sciences the means is four times the median and has a larger standard deviation. In general terms, it seems that FI3,4 produces medians closer to the means.
Central tendency and variability.
| JCR category | Measure of central tendency | FI1,2 | FI2,3 | FI3,4 | FI4,5 | FI1,5 |
|---|---|---|---|---|---|---|
| Astronomy & Astrophysics | Median | 1.683 | 1.874 | 1.679 | 1.600 | 1.757 |
| Mean | 3.070 | 3.407 | 3.551 | 2.868 | 3.180 | |
| Standard deviation | 4.292 | 5.563 | 5.597 | 4.931 | 4.803 | |
| Biology | Median | 1.540 | 1.505 | 1.553 | 1.624 | 1.719 |
| Mean | 2.097 | 2.341 | 2.346 | 2.500 | 2.374 | |
| Standard deviation | 2.115 | 2.293 | 2.488 | 2.897 | 2.390 | |
| Ecology | Median | 1.829 | 2.343 | 2.421 | 2.425 | 2.250 |
| Mean | 2.643 | 3.168 | 3.292 | 3.530 | 3.122 | |
| Standard deviation | 2.681 | 3.056 | 2.858 | 3.444 | 2.871 | |
| Engineering, Aerospace | Median | 0.549 | 0.623 | 0.737 | 0.672 | 0.654 |
| Mean | 0.680 | 0.799 | 0.869 | 0.885 | 0.833 | |
| Standard deviation | 0.605 | 0.762 | 0.787 | 0.880 | 0.727 | |
| History & Philosophy of Science | Median | 0.442 | 0.446 | 0.500 | 0.588 | 0.553 |
| Mean | 0.580 | 0.659 | 0.682 | 0.735 | 0.725 | |
| Standard deviation | 0.603 | 0.694 | 0.642 | 0.672 | 0.632 | |
| Mathematics, Interdisciplinary Applications | Median | 0.893 | 1.079 | 1.230 | 1.132 | 1.131 |
| Mean | 1.108 | 1.291 | 1.435 | 1.593 | 1.394 | |
| Standard deviation | 0.771 | 0.884 | 1.087 | 1.662 | 1.033 | |
| Medicine, Research & Experimental | Median | 2.297 | 2.376 | 2.320 | 2.274 | 2.418 |
| Mean | 3.033 | 3.476 | 3.121 | 3.291 | 3.337 | |
| Standard deviation | 3.290 | 3.979 | 3.943 | 4.197 | 3.635 | |
| Multidisciplinary Sciences | Median | 0.510 | 0.571 | 0.828 | 0.650 | 0.789 |
| Mean | 2.313 | 2.461 | 2.471 | 2.521 | 2.866 | |
| Standard deviation | 6.419 | 7.003 | 6.918 | 6.823 | 7.231 |
The results obtained indicate that the start and end years of the citation window exert a definitive effect on if. The journal categories studied herein are quite diverse. The years needed for the distribution of citations to top out oscillates between two and five years. As such, the impact maturation time varies considerably from one category to another. Some journals are penalized by the two-year if and favored by the five year if. The reverse is also observed. This is why one should be cautious when comparing the if of journals from different fields. There are variable window if that in general terms produce measures of central tendency that are relatively close.
With regard to the research question (Do fixed citation windows affect the impact maturation times of scientific journals?), results indicate that citation windows with fixed starts and ends and which have been used frequently in the literature do not reflect the various maturation rates of scientific journals. Moreover, this approach favors some and penalizes other. These facts recommend the adoption of some kind of variable start and end citation window that is better suited to the field of research under analysis.