


Depressive disorders have a high prevalence around the world. They present a great comorbidity with other disorders like anxiety, thereby making a differential diagnosis very difficult. The Basic Depression Questionnaire was designed to palliate this issue by isolating specific depression symptoms. Our aim is to study the reliability, factorial structure, and differential item functioning of this questionnaire. Method: The sample consisted of 1,397 adults without psychological problems (Mage=29.76, SD=11.25, 64.78% women) who completed the CBD. Results: We observed that none of the items presented differential functioning. A monofactorial structure was established. In this model a good fit was obtained by confirmatory factor analysis and a strict invariance by sex. The ordinal alpha was used to check the reliability and it fetched an index of .95. Conclusions: The Basic Depression Questionnaire has adequate psychometric properties. The absence of differential item functioning and the invariance by sex are guarantees of an adequate use to diagnose depression for men and women. So, its clinical use can help to differentiate between the specific diagnoses for depressive disorders and anxiety disorders.
Los trastornos depresivos tienen una elevada prevalencia a nivel mundial. Presentan una gran comorbilidad con otros trastornos como la ansiedad, lo que hace muy difícil su diagnóstico diferencial. El Cuestionario Básico de Depresión (CBD) fue diseñado para aislar los síntomas específicos de la depresión y así paliar este problema. El objetivo de este estudio es analizar la fiabilidad, la estructura factorial y el funcionamiento diferencial de los ítems del CBD. Método: La muestra estuvo compuesta de 1.397 adultos sin problemas psicológicos (64,78% mujeres, Medad=29,76, DT=11,25) a los que se le administró el CBD. Resultados:Se observó que ninguno de los ítems presentaba funcionamiento diferencial. Se obtuvo una estructura monofactorial. En dicho modelo se obtuvo un buen ajuste mediante análisis factorial confirmatorio y una invarianza estricta por sexo. Se usó el alfa ordinal para comprobar la fiabilidad, obteniendo un índice de 0,95. Conclusiones: El Cuestionario Básico de Depresión tiene adecuadas propiedades psicométricas. La ausencia de funcionamiento diferencial del ítem y la invarianza por sexo son garantías de un adecuado uso para diagnosticar depresión en hombres y mujeres. Por ello, su uso clínico puede ayudar al diagnóstico específico de trastornos depresivos frente a trastornos de ansiedad.
Depressive disorders refer to mental problems with the highest prevalence around the world, and its personal and social cost is very high. According to World Health Organization (WHO) statistics, 300 million people in the world (4.2% of the global population and 5.2% of the Spanish population) suffered depression in 2015 (World Health Organization WHO, 2017). In addition, the level of depression remained stable over time in several European samples (Schürmann & Margraf, 2018). Moreover, it is the main cause of disability as well as strongly related to suicides, especially in cases where residual symptomatology is present (Castellón Leal et al., 2016; Teismann et al., 2018).
According to symptomatology, low mood and anhedonia occupy the most important place in depressive disorders. Such disorders also include physical symptoms (e.g., fatigue, insomnia, weight gain), cognitive symptoms (e.g., loss of concentration, suicidal ideation, feelings of guilt) and motor syndromes (e.g., agitation or psychomotor retardation; American Psychiatric Association APA, 2013). For diagnosis, the duration of these symptoms must be present for a minimum of two weeks and at least one of them must be a depressive mood or loss of interest and must cause clinically significant discomfort (American Psychiatric Association APA, 2013). When evaluating depression, it is important to highlight the gender differences regarding symptomatology and prevalence (Londoño, Peñate, & González, 2016).
In terms of comorbidity, depression is highly related with negative emotions like anger and fear along with other psychological alterations—mainly anxiety disorders (Agudelo, Buela-Casal, & Spielberger, 2007). The tripartite model from Clark and Watson (1991), which has been set up on the basis of these assumptions, shows that some symptoms of depression, such as insomnia, poor concentration, tiredness, negative affectivity, and irritability, are common with the symptoms of anxiety disorders (Eysenck & Fajkowska, 2018). The principal difference is that there may be positive affect in case of anxiety, but not so in depression. Furthermore, there are psychosomatic elements, which are often confused with this disorder, as well as chronic disease symptoms (Spielberger, Carretero-Dios, De los Santos-Roig, & Buela-Casal, 2002a, 2002b).
In a psychometric analysis of the Response to Anxiety Questionnaire, Taylor, Grant, Frosio, Kraft, and White (2018) have identified comorbidity between anxiety and depression with symptoms like repetitive negative thinking, especially rumination and hopelessness. Additionally, in a global survey carried out in Europe and America (n=15,499), patients of depression are highly related (r=.65) with suffering later episodes of generalized anxiety disorder (de Jonge et al., 2017).
The presence of comorbidity between depression and anxiety can lead to difficulties while evaluating depressive disorders. Moreover, it is necessary to have valid and reliable diagnostic instruments in each specific context (Agudelo et al., 2007; Taylor, Grant, Frosio, Kraft, & White, 2018). There are a lot of instruments to evaluate depression with adequate psychometric properties both for adults (Senín-Calderón, Perona-Garcelán, Ruíz-Veguilla, & Rodríguez-Testal, 2016) as well as children (e.g., Pineda, Martín-Vivar, Sandín, & Piqueras, 2018). Although there are many scales to assess depression, they usually mix depressive symptoms with anxiety symptomatology or common symptoms, thus making the diagnosis difficult (Peñate, Bello, García, Rovella, & Del Pino-Sedeño, 2014).
The Basic Depression Questionnaire (Cuestionario Básico de Depresión, CBD; Peñate, 2001b) is one of the instruments created in Spain and designed to isolate all specific depression symptoms. This questionnaire stresses specific questions on this disease to avoid comorbidity problems with anxiety disorders. The instrument explores three depression areas—sadness, anhedonia, and low self-esteem—although it has a monofactorial structure (Peñate, 2001a, 2001c). It has shown discriminant validity between anxiety and depression both in adults (Peñate, Ibáñez, & González, 2001) and in adolescents (Peñate et al., 2014). In addition, it has the discriminative capacity between acute depression episodes and dysthymia (Peñate & Almeida, 2001). It also possesses a high sensibility to detect symptomatic reductions during psychological treatment (Peñate, Pitti, García, & Perestelo, 2005).
Despite the already mentioned good psychometric properties of CBD, there are no differential item functioning (DIF) and invariance analysis to see its performance in men and women. Furthermore, in spite of its usefulness, a few studies replicate the original analyses. For this, the present study aims to analyse the reliability, factorial structure, invariance, and differential item functioning of the Basic Depression Questionnaire in a large Spanish sample. It is expected that, as in the original study, good reliability indicators and a monofactorial structure will be obtained. We also hypothesize the non-existence of DIF and a strict invariance between men and women.
MethodParticipantsThe sample consists of 1,397 participants (492 men, 35.22%; 905 women, 64.78%) from different Spanish regions (Galicia, País Vasco, Cataluña, Madrid, Valencia and Andalucía). The ages range from 18 to 87 years (M=29.76, SD=11.25). Women have a mean age of 29.88 years (SD=11.17) and men of 29.57 years (SD=11.43).
InstrumentsThe Basic Depression Questionnaire (CBD; Peñate, 2001b). As already mentioned, this instrument is composed of 21 items that explore sadness, anhedonia, and low self-esteem. Each item has four response alternatives in accordance with the duration of the symptoms: (0) absence; (1) weeks; (2) months and (3) years (see Appendix 1). The CBD has good psychometric indicators in adult samples and its internal consistency is .89 (Peñate et al., 2001). According to the score, the categories would be: absence of depression (from 0 to 19); mild depression (from 20 to 29); moderate depression (from 30 to 39); and severe depression (40 or more).
ProcedureAfter the approval of the University of Granada's ethics committee, the questionnaire was brought to research work. This process was carried out by a researcher and it took place in areas with a high confluence of people, using incidental sample recruitment. The study was presented to the participants and informed consent was taken from them. Confidentiality and compliance with data protection laws were guaranteed. The average time of application took five to 10minutes; the evaluator left the questionnaire to the participants and stayed close to them to be able to answer any possible questions.
DesignAccording to the classification of Montero and León (2007), this study would be instrumental as it evaluates the reliability and validity of a questionnaire. We followed the methodological recommendations of Muñiz and Fonseca-Pedrero (2019).
Data analysisWe calculated the total mean score and the mean differences between the gender groups. Next, we analysed the DIF by sex. The presence of the DIF implies that the response to an item is influenced by group characteristics and not only by the level in the construct (Gómez-Benito, Sireci, Padilla, Hidalgo, & Benítez, 2018; Muñiz & Fonseca-Pedrero, 2019). There are several methods to evaluate the existence of the DIF in polytomous response items. We used a logistic regression performed in three phases: In the first model, we compared sex (dependent variable) with the total score; in the second, sex is compared with the total score and the item response; and last, sex is compared with the total score, item response, and the interaction between them (for more details, see Hidalgo, López-Martínez, Gómez-Benito, & Guilera, 2016). We considered a uniform DIF using the differences in R2 Nagelkerke Model 2 with respect to Model 1 (uniform DIF) and the Model 3 relative to Model 2 for a non-uniform DIF. According to Jodoin and Gierl (2001), a value less than .035 will indicate a negligible DIF.
The scale structure was verified by exploratory factor analysis with part of the sample and by confirmatory factor analysis with another. There were no differences by age (t[1,397]=0.76, p=.45) or by sex percentage (χ2[1]=0.18, p=.71). The extraction method was Weighted Least Squares (WLS) for exploratory factor analysis (Viladrich, Angulo-Brunet, & Doval, 2017). For this, the Barlett sphericity test and Kaiser-Meyer-Olkin (KMO) were performed. To establish the number of factors, the Very Simple Structure (VSS) method was used. A confirmatory factor analysis was then carried out with another part of the sample. First, the multivariate normality was verified with the Mardia test with the observation that the data was not normal—thus, the polychoric correlation matrix was used. The estimation method was Diagonally Weighted Least Squares Mean and Variance Adjusted. This is adequate when the data is not normally distributed (DWLSMV; Viladrich et al., 2017). We tested the CBD original models to establish its structure. These models were: (1) monofactorial model; (2) two-factor model; and (3) bi-factorial model allowing saturation of some items in both. The authors also proposed another tri-factorial model, which could not be estimated as the second and third factors only contained two items. The indexes used were the Chi-Squared Adjusted, Goodness of Fit Index (GFI), Adjusted Goodness of Fit Index (AGFI), Expected Cross-Validation Index (ECVI), Tucker Lewis Index (TLI), Comparative Fit Index (CFI), and the Root Mean Square Error Approximation (RMSEA).
After the confirmatory model estimation, an invariance analysis by sex was performed to check if equivalent results in men and women could be obtained. The following steps were evaluated: First, configural invariance would mean that there are no restrictions on the model; metric or weak invariance would indicate that the factorial weights were restricted; strong invariance would mean that intercepts were restricted; and strict invariance would show that the variances of errors were restricted. A decrease of no greater than .01 in the CFI regarding the previous model was taken as evidence of invariance (Cheung & Rensvold, 2002). Finally, we carried out the ordinal alpha for the reliability analysis (Viladrich et al., 2017).
The statistical programs R (Version 3.6.0; R Core Team, 2017) and the RStudio interface (Version 1.1.463; Rstudio Team, 2016) were used to carry out all the analyses described. The following R packages were used: psych (Revelle, 2018), lordif (Choi, Gibbons, & Crane, 2011), and lavaan (Rosseel, 2012).
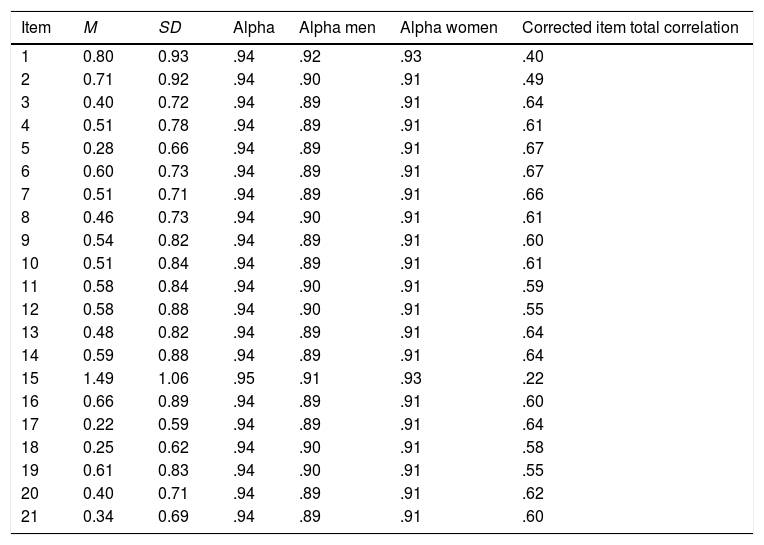
ResultsItem analysisAn analysis of the mean scores and standard deviation of the items was performed to detect extreme scores. None of the averages exceeded 1.49, with the lowest being 0.22 (theoretical range of 0 to 3). The standard deviations oscillated between 0.59 and 1.06. This indicates that the subjects did not have a response pattern with high frequencies in the central values or in the extremes (see Table 1).
Descriptive analysis and ordinal alfa for CBD items.
| Item | M | SD | Alpha | Alpha men | Alpha women | Corrected item total correlation |
|---|---|---|---|---|---|---|
| 1 | 0.80 | 0.93 | .94 | .92 | .93 | .40 |
| 2 | 0.71 | 0.92 | .94 | .90 | .91 | .49 |
| 3 | 0.40 | 0.72 | .94 | .89 | .91 | .64 |
| 4 | 0.51 | 0.78 | .94 | .89 | .91 | .61 |
| 5 | 0.28 | 0.66 | .94 | .89 | .91 | .67 |
| 6 | 0.60 | 0.73 | .94 | .89 | .91 | .67 |
| 7 | 0.51 | 0.71 | .94 | .89 | .91 | .66 |
| 8 | 0.46 | 0.73 | .94 | .90 | .91 | .61 |
| 9 | 0.54 | 0.82 | .94 | .89 | .91 | .60 |
| 10 | 0.51 | 0.84 | .94 | .89 | .91 | .61 |
| 11 | 0.58 | 0.84 | .94 | .90 | .91 | .59 |
| 12 | 0.58 | 0.88 | .94 | .90 | .91 | .55 |
| 13 | 0.48 | 0.82 | .94 | .89 | .91 | .64 |
| 14 | 0.59 | 0.88 | .94 | .89 | .91 | .64 |
| 15 | 1.49 | 1.06 | .95 | .91 | .93 | .22 |
| 16 | 0.66 | 0.89 | .94 | .89 | .91 | .60 |
| 17 | 0.22 | 0.59 | .94 | .89 | .91 | .64 |
| 18 | 0.25 | 0.62 | .94 | .90 | .91 | .58 |
| 19 | 0.61 | 0.83 | .94 | .90 | .91 | .55 |
| 20 | 0.40 | 0.71 | .94 | .89 | .91 | .62 |
| 21 | 0.34 | 0.69 | .94 | .89 | .91 | .60 |
Note. SD=Standard Deviation.
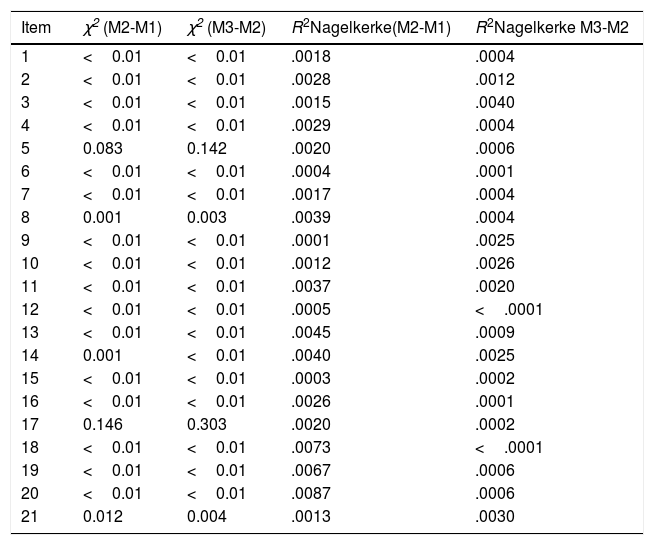
We calculated the total score of the questionnaire (M=11.38, SD=10.27), and we analysed the presence of outliers (using Z-scores), founding a total of 60 outliers (4% from the total sample). The mean for the men's group was 10.38 (SD=9.24) and for the women's group 12.01 (SD=10.78)—these differences are statistically significant but they don’t have any effect size (t[1,09]=2.91, p=.004, d=0.06). Furthermore, we checked if there was any DIF. None of the items showed uniform or non-uniform DIF (see Table 2).
Differential item functioning with logistic regression for CBD items.
| Item | χ2 (M2-M1) | χ2 (M3-M2) | R2Nagelkerke(M2-M1) | R2Nagelkerke M3-M2 |
|---|---|---|---|---|
| 1 | <0.01 | <0.01 | .0018 | .0004 |
| 2 | <0.01 | <0.01 | .0028 | .0012 |
| 3 | <0.01 | <0.01 | .0015 | .0040 |
| 4 | <0.01 | <0.01 | .0029 | .0004 |
| 5 | 0.083 | 0.142 | .0020 | .0006 |
| 6 | <0.01 | <0.01 | .0004 | .0001 |
| 7 | <0.01 | <0.01 | .0017 | .0004 |
| 8 | 0.001 | 0.003 | .0039 | .0004 |
| 9 | <0.01 | <0.01 | .0001 | .0025 |
| 10 | <0.01 | <0.01 | .0012 | .0026 |
| 11 | <0.01 | <0.01 | .0037 | .0020 |
| 12 | <0.01 | <0.01 | .0005 | <.0001 |
| 13 | <0.01 | <0.01 | .0045 | .0009 |
| 14 | 0.001 | <0.01 | .0040 | .0025 |
| 15 | <0.01 | <0.01 | .0003 | .0002 |
| 16 | <0.01 | <0.01 | .0026 | .0001 |
| 17 | 0.146 | 0.303 | .0020 | .0002 |
| 18 | <0.01 | <0.01 | .0073 | <.0001 |
| 19 | <0.01 | <0.01 | .0067 | .0006 |
| 20 | <0.01 | <0.01 | .0087 | .0006 |
| 21 | 0.012 | 0.004 | .0013 | .0030 |
Note. Models of logistic regression were adjusted. M1=model 1; M2=model 2; M3=model 3. In all of them the dependent variable was sex. In M1 the predictor variable was total score in the test, in M2, response to the item and total score and in M3, total score, response to the item and the interaction between them.
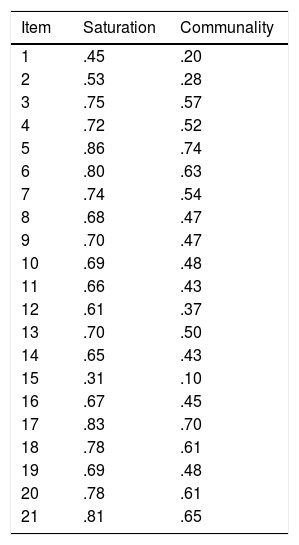
Once the proper functioning of the items has been established, we turned to their factorial reduction to see the underlying factor structure. Data showed enough adequacy to perform the factorial analysis (KMO=.92; Bartlett's sphericity test: p<.001). With VSS, the model achieved a maximum of .88 with 1 factor. The analysis was made by extracting a factor that explained 48.5% of the total variance. The saturation of each item is presented in Table 3, where we can observe that Items 1 and 15 present very low loads.
Saturation matrix and percentage of explained variance in exploratory factor analysis for CBD items.
| Item | Saturation | Communality |
|---|---|---|
| 1 | .45 | .20 |
| 2 | .53 | .28 |
| 3 | .75 | .57 |
| 4 | .72 | .52 |
| 5 | .86 | .74 |
| 6 | .80 | .63 |
| 7 | .74 | .54 |
| 8 | .68 | .47 |
| 9 | .70 | .47 |
| 10 | .69 | .48 |
| 11 | .66 | .43 |
| 12 | .61 | .37 |
| 13 | .70 | .50 |
| 14 | .65 | .43 |
| 15 | .31 | .10 |
| 16 | .67 | .45 |
| 17 | .83 | .70 |
| 18 | .78 | .61 |
| 19 | .69 | .48 |
| 20 | .78 | .61 |
| 21 | .81 | .65 |
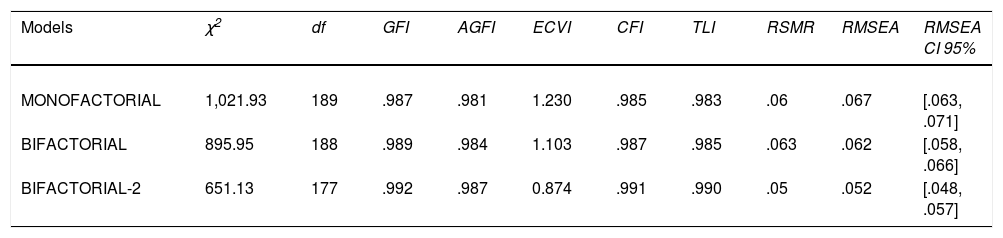
The confirmatory factor analysis was then carried out, adjusting the three models analysed in the creation of the CBD. As shown in Table 4, all models fit properly and the adjustment differences between them are very small. We checked differences between models using ANOVAs, and we found that Model 1 has a higher Chi-Squared respect to Model 2, being this 79.67. Model 1 has a Chi-Squared 275.24 points higher than Model 3. Next, progressive factorial invariance was performed separately for men and women. We appreciate a strict invariance (see Table 5).
Model's fit of CBD confirmatory factorial analysis.
| Models | χ2 | df | GFI | AGFI | ECVI | CFI | TLI | RSMR | RMSEA | RMSEA CI 95% |
|---|---|---|---|---|---|---|---|---|---|---|
| MONOFACTORIAL | 1,021.93 | 189 | .987 | .981 | 1.230 | .985 | .983 | .06 | .067 | [.063, .071] |
| BIFACTORIAL | 895.95 | 188 | .989 | .984 | 1.103 | .987 | .985 | .063 | .062 | [.058, .066] |
| BIFACTORIAL-2 | 651.13 | 177 | .992 | .987 | 0.874 | .991 | .990 | .05 | .052 | [.048, .057] |
Note. χ2=chi square; df=degrees of freedom (all χ2 are significant: p<.001); GFI=Goodness of Fit Index; AGFI=Adjusted Goodness of Fit Index; ECVI=Expected Cross-Validation Index; CFI=Comparative Fit Index; TLI=Tucker-Lewis Index; RSMR=Root Squared Mean of Residuals; RMSEA=Root Mean Square Error of Approximation; CI=confidence interval.
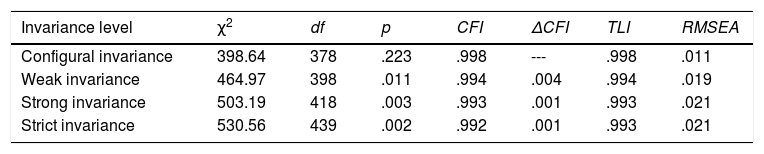
Invariance analysis for CBD monofactorial model.
| Invariance level | χ2 | df | p | CFI | ΔCFI | TLI | RMSEA |
|---|---|---|---|---|---|---|---|
| Configural invariance | 398.64 | 378 | .223 | .998 | --- | .998 | .011 |
| Weak invariance | 464.97 | 398 | .011 | .994 | .004 | .994 | .019 |
| Strong invariance | 503.19 | 418 | .003 | .993 | .001 | .993 | .021 |
| Strict invariance | 530.56 | 439 | .002 | .992 | .001 | .993 | .021 |
Note. χ2=chi square; df=degrees of freedom; CFI=Comparative Fit Index; TLI=Tucker-Lewis Index; RMSEA=Root Mean Square Error of Approximation. We used the monofactorial model, where all the items saturated in only one factor.
Once determined that the questionnaire was monofactorial, we analysed its internal consistency with the ordinal alpha for the total score (α=.94, CI95=.93-.94). As it can be seen in Table 1, only two out of the 21 items of the scale (1 and 15) improved the alpha if they were eliminated. We also calculated the alpha separated for men (α=.90, CI95=.88-.91) and women (α=.92, CI95=.91-.92).
DiscussionThe main objective of this work was to analyse the reliability and structure of the CBD. It has been showed that the questionnaire is adequately reliable and possesses a monofactorial structure. None of the items presents any differential functioning in terms of sex, and the structural invariance between men and women is strict. These results coincide with previous studies that confirmed the monofactoriality of this instrument and also expand the knowledge of the sex functioning of the questionnaire.
According to sex difference, in the World Mental Health Survey Initiative, 10 European countries participated and there were more women than men with this disorder. Women also reported more depressive symptoms than men (Boyd et al., 2015). This occurs also in adolescent women (Ho, Dai, Mak, & Liu, 2018). In addition, women suffer from specific grief conditions like post-partum depression (Ridaura, Penelo, & Raich, 2017). However, there are several items in which men and women can score differently, producing diagnostic differences—for example, Guillén-Riquelme and Buela Casal (2011), in an analysis of the State Trait Anxiety Inventory, found a higher propensity of men choosing the different options of ‘never’ on the item ‘I feel like crying’. For this reason, it is relevant to analyse the existence of possible biases presented by sex. There was no previous analysis pertaining to this topic. In our results, none of the items shows differential functioning. Therefore, there would be no problems of overdiagnosis or underdiagnosis in both sexes when using the CBD.
In the factorial analysis, it is observed that it is more favourable to extract a solution of one factor—this coincides with the approach of Peñate et al. (2001). Despite this, in this structure Items 1 and 15 present very low saturation loads in both adults and adolescent samples (Peñate et al., 2014). This monofactorial model supports the theory that there are three areas of depression that would covariate. These areas should be understood as a whole and not as separate elements. This knowledge is also a decisive element in the differential identification of depression as well as in the comparison with anxiety symptoms which supports the genuine nature of this questionnaire (Peñate et al., 2001). The recent classification ICD-11 has opted for a more dimensional classification not focusing so much on symptom categories, but valuing more global aspects of the disorders as well as their intensity and duration over time (Reed et al., 2019). This reinforces the use of questionnaires focused on the severity and duration of the symptoms, rather than questionnaires that include an exhaustive list of symptoms to ensure compliance or not. The CBD is a questionnaire that adapts to this diagnostic approach.
In the confirmatory analysis, the bifactorial model with crossed saturations was the one that presented a better fit. However, as all the models have adequate indices, we support the monofactorial structure. In addition, the invariance analysis was not carried out in previous psychometric studies of the CBD. The presence of strict invariance is an indicator that the questionnaire serves both men and women and does not present any bias. This is new evidence for the validity of the questionnaire for the depression diagnosis in terms of sex.
In terms of reliability, ordinal alpha values are adequate for all items—this too coincides with the approach of Peñate et al. (2005) with the exception of the items written in a positive way, 1 and 15, which if eliminated would make the alpha increase. These results coincide with those of the original study in which these items were also problematic (Peñate & Almeida, 2001). Therefore, we propose the elimination of these items for future sampling to improve the reliability and also the monofactorial structure. (Scales for both versions, one with 21 and other with 19 items can be found in Appendix 2).
In general, the majority of the instruments used to evaluate depression have shown favourable psychometric indicators (internal consistency, clinical and non-clinical samples, convergent and treatment validity). The work of Nezu, Ronan, Meadows, and McClure (2008) identifies 36 scales with good psychometric indicators. However, the drawback lies in finding the differential diagnosis (especially with some anxiety disorders) and the discriminant validity between different depressive disorders. The CBD emerges specifically to include specific symptoms of depression and therefore it is a determining questionnaire for the differential diagnosis between anxiety and depression (Peñate, 2001b). This represents an incremental validity over other questionnaires with categorical character. Moreover, this study has certain limitations. We have not used a clinical sample to analyse the discriminant validity and the present sample was recruited with incidental sampling. For further investigation, it would be interesting to compare the CBD with other questionnaires to analyse the convergent and divergent validity, and to use a representative sample. Despite this shortcoming, the CBD is presented here as a useful instrument when evaluating depression in the adult population of Spain, thereby ensuring a correct differentiation between anxiety and depression.
FundingThis research was supported in part by a grant from the Spanish Ministry of Science, Innovation and Universities; Grant/Award Number: FPU17/05262.
The following are the supplementary data to this article:
