


Edited by: Dr. Ana Rita Silva
(University of Coimbra, Coimbra, Portugal)
Dr. Elodie Bertrand
(Paris Cité University, Paris, France)
Dr. Maria Schubert
(Zurich University of Applied Sciences, Zurich, Switzerland)
Last update: October 2025
More infoAccording to the STAC-R model, scaffolding enhancement is achievable through various interventions. Indicating forms of compensatory scaffolding, the STAC-R model refers to phenomena described in other theoretical models, such as the enhanced fronto-parietal recruitment described in the CRUNCH hypothesis. The presented study investigated whether working memory training can induce compensatory scaffolding in older adults through increased prefrontal and parietal involvement (indicated by changes in theta and alpha power). The sample comprised 90 individuals, including 45 participants from the experimental (22 older and 23 young adults) and 45 from the passive control group (21 older and 24 young adults). The age range was 60–75 years for older adults and 20–35 years for young adults. We assessed the effects of a 12-session working memory training with the use of the adaptive n-back task on theta and alpha power measured in frontal midline and central-parietal areas by EEG in older and young adults during the n-back task performance at three difficulty levels. At the behavioral level, we found a positive, significant improvement in cognitive performance in young adults from experimental group. In contrast, the positive changes in older adults were too small to prove statistically significant. At the level of neuronal activity, we observed not a training effect but a retest effect. It was revealed primarily for theta oscillations in older adults and manifested by increased theta power with higher task demands and equalization of theta power of older and younger persons in the post-test. For alpha oscillations, the retest effect was negligible, and its only manifestation observed in older adults was a reduction in the dependence of alpha power on task difficulty. The study results indicate limited potential for improving WM performance in older adults compared to young adults. The presence of the retest learning effect, instead of the training effect, proved that familiarity with the task was crucial, rather than regular training of its performance. Changes observed in older adults in theta power can be considered positive, and these results are consistent with the CRUNCH hypothesis of a compensatory role for increased executive control involvement. In turn, changes in the alpha power in the same group should be considered rather maladaptive. Nevertheless, given the overall study findings, it can be concluded that although the behavioral effects of training are stronger in young adults, the changes in neuronal activity resulting from the retest learning effect are more marked in older adults.
The phenomenon of demographic aging observed in European countries and the United States results from the increasing proportion of older adults in the population and the extension of individual life expectancy (European Commission, Statistical Office of the European Union, 2020; United Nations Department of Economic & Social Affairs, Population Division, 2022; Vaupel et al., 2021). This demographic shift has prompted researchers to focus on factors that may significantly influence the quality of life during this prolonged period of old age. Such factors include preserved cognitive efficiency (Castro-Lionard et al., 2011; Hartley et al., 2018). At the same time, cognitive decline is a well-documented and widely recognized phenomenon, even in physiological aging (e.g., Harada et al., 2013; Salthouse, 2004; Tucker-Drob et al., 2019). This decline is associated with age-related alterations in brain volume and activity (e.g., Dennis & Cabeza, 2008; Grady, 2012; Hedden et al., 2016; Koen & Rugg, 2019; Raz et al., 2005). However, it is essential to acknowledge that the aging process can also be accompanied by beneficial adaptive mechanisms, allowing individuals to mitigate cognitive decline at both neural and cognitive levels (Barulli & Stern, 2013; Cabeza et al., 2018; Goh & Park, 2009; Greenwood, 2007; Stern et al., 2020). Moreover, cumulative findings show that various types of interventions, especially cognitive training (CT), can improve cognitive functioning in old age, primarily in persons without cognitive impairment and with mild cognitive impairment (Bonnechère et al., 2020; Chiu et al., 2017; Gómez-Soria et al., 2023; Hill et al., 2017; Wang et al., 2023; Yun & Ryu, 2022).
The scaffolding theory of aging and cognition as an overall theoretical framework for the study undertakenA comprehensive theoretical model that encompasses both decline and preservation phenomena in cognitive aging is the Scaffolding Theory of Aging and Cognition (STAC) and its revised version (STAC-R) by D. Park and P. Reuter-Lorenz (Park & Reuter-Lorenz, 2009; Reuter-Lorenz & Park, 2014, 2024). The STAC-R model elucidates the individual differences in cognitive functioning in old age, encompassing current cognitive status and its age-related changes, by looking at the current structure and functions of the brain and the compensatory scaffolding. These, in turn, have been shaped throughout an individual's life under the influences of biological aging and a broad spectrum of factors that can either enhance or impair neural resources (Park & Smith, 2022; Reuter-Lorenz & Park, 2014, 2024). Compensatory scaffolding generally refers to the supportive and compensatory neural mechanisms that preserve cognitive abilities in old age. Compensatory scaffolding involves phenomena in the aging brain that naturally arise in response to the new demands generated by the overall age-related decline. An example is the occurrence of brain activity patterns unobserved in earlier developmental periods. Moreover, according to the STAC-R model, scaffolding enhancement is achievable through various interventions, such as social and intellectual engagement, exercises, meditation, and CT (Reuter-Lorenz & Park, 2014, 2024).
The crunch hypothesis as describing one of the compensatory scaffolding forms postulated by the STAC-R modelDiscussing the compensatory scaffolding, the STAC-R model authors highlight the role of the prefrontal cortex (PFC) and enhanced fronto-parietal recruitment (Park & Reuter-Lorenz, 2009; Reuter-Lorenz & Park, 2014). At the same time, over-activation of PFC is the most commonly observed pattern of compensatory brain activity in older adults (Dennis & Cabeza, 2008; Cabeza & Dennis, 2012; Cabeza et al., 2018; Eyler et al., 2011; Kang et al., 2022; McDonough et al., 2022). The crucial role of PFC in adapting to the age-related decline in cognitive efficiency emphasizes the Compensation-Related Utilization of Neural Circuits Hypothesis (CRUNCH) hypothesis, proposed by Reuter-Lorenz and Cappell (2008). This model suggests that the PFC, particularly its executive control functions and top-down processing, may be adaptively engaged to meet the challenges posed by the environment and cognitive tasks, serving as a mechanism for adaptation to aging. Given that PFC demonstrates significant age-related losses accompanied by executive control deterioration (Zanto & Gazzaley, 2019), the authors suggest that when cognitive tasks are not very challenging, older adults may engage the prefrontal regions to compensate, allowing them to perform at a level similar to younger individuals. However, when faced with more demanding cognitive tasks that exceed their resources, older adults are more likely to show decreased brain activity and experience a decline in cognitive performance (Reuter-Lorenz & Cappell, 2008; Kang et al., 2022). Research also revealed compensatory effects, analogous to those shown for PFC, for the additional recruitment of parietal regions (Eyler et al., 2011). Therefore, the STAC-R model refers to enhanced fronto-parietal recruitment (Reuter-Loernz & Park, 2014). At the same time, it is important to note that not all studies have confirmed that the patterns of brain activity in older adults, as described above, are compensatory. Some studies found no link between these patterns and cognitive performance, while others suggested a connection with decreased performance (Eyler et al., 2011; Jamadar, 2020; Qin & Basak, 2020).
Effects of cognitive training in older adultsCognitive training (CT) encompasses diverse interventions characterized by implementing standardized tasks and structured activities to engage participants in targeted aspects of cognitive functioning. The core principle of CT is that practicing a task at a difficulty level suitable for the learner can enhance cognitive functions. These improvements can extend beyond the specific training context, a concept known as transfer (Alves et al., 2013; Bürki et al., 2014; Stine-Morow & Basak, 2011). CT can be considered effective in training/transfer effects when there is a significant improvement in a trained task (or task involving the same cognitive ability, training effect) or a non-trained task involving non-trained cognitive ability (transfer effect) in the post-test compared to the pre-test within the experimental group. This improvement must also be greater than observed in the passive control group, allowing us to distinguish the training effect from the retest learning effect. Additionally, if the improvement exceeds that of the active control group, it helps separate the training effect from the placebo effect (Borella et al., 2020; Stine-Morow & Basak, 2011). However, many methodological issues pose additional challenges to measuring the effectiveness of CT, such as measuring cognitive ability, not just task-specific performance, small sample sizes in CT studies, designing proper active control intervention, measuring long-term effects of CT, and others (von Bastian et al., 2020).
Many research results confirm that CT improves cognitive functioning in older adults. As indicated by available meta-analyses and systematic reviews (Bonnechère et al., 2020; Chiu et al., 2017; Lampit et al., 2014; Tetlow et al., 2017; Yun & Ryu, 2022), small to moderate effects are typically observed. However, not all indicators of cognitive functioning considered in particular studies show these effects. Moreover, Eschen's (2012) review suggests that CT can enhance the stability of cognitive functioning throughout adulthood. CT is primarily effective for older adults within the cognitive norm (Bonnechère et al., 2020; Chiu et al., 2017; Lampit et al., 2014; Yun & Ryu, 2022) and with mild cognitive impairment (Hill et al., 2017; Mewborn et al., 2017; Sherman et al., 2017; Wang et al., 2023; see Zając-Lamparska, 2019 for review). In contrast, CT yields very limited effects in individuals with dementia disorders (Bahar-Fuchs et al., 2013; Hill et al., 2017; Huntley et al., 2015; Wang et al., 2022).1
There is still less research on the neurological impacts of cognitive training compared to the behavioral aspects, but many results have been gathered. The findings, however, show both convergence and inconsistency, which is at least partly due to the varying methodological approaches adopted. The systematic review on the impact of computerized cognitive training (CCT) on neuroimaging outcomes conducted by Ten Brinke et al. (2017) highlights the heterogeneous character of the findings, possibly stemming from the considerable variability in study design. The observed heterogeneity includes the following findings: (a) CCT induced increases and decreases in brain structure and function in older adults; (b) these changes, which again included increases and decreases depending on the brain region, were correlated with cognitive performance. Another review of fMRI studies revealed that CT influences the engagement of the dorsolateral PFC in tasks that are both proximal and distal to the trained task paradigm. However, the effects of CT are once again mixed, resulting in either an increase or decrease in the recruitment of the dorsolateral PFC during trained task performance and when not engaged in these tasks (Motes, 2018). A relatively recent meta-analysis of fMRI and PET studies utilizing activation likelihood estimation (ALE) has yielded preliminary evidence of shared neuronal effects resulting from diverse forms of CT observed in PFC regions (Duda & Sweet, 2020). Based on the findings of this meta-analysis, CT led to increased activation in specific areas, including the middle frontal gyrus of the left hemisphere, precentral gyrus, and posterior parietal cortex (extending to the superior occipital gyrus). Additionally, decreased activation followed CT in two clusters: the middle frontal gyrus of the right hemisphere and the supramarginal gyrus (extending to the superior temporal gyrus). When it comes to WM training, Constantinidis & Klingberg (2016), in a review incorporating human imaging studies, neurophysiological recordings in non-human primates, and computational modeling studies, concluded that WM training augments the activity of prefrontal neurons and enhances the strength of connectivity within and between the prefrontal and parietal cortex. At the same time, the authors highlight that the increase in WM capacity due to CT may be linked to both an increase and a decrease in neuronal activity, as measured by the BOLD signal. An increase in activity could indicate heightened neuronal engagement, while a decrease could suggest improved neuronal efficiency. The meta-analysis of the fMRI studies, which compared brain activation changes following WM training with perceptual-motor learning, indicated that the primary characteristic of WM training was the consistent modulation of dorsolateral and ventrolateral prefrontal cortex (DLPFC/VLPFC) activity (Salmi et al., 2018).
The role of cognitive training in the context of the STAC-R modelThe STAC-R model postulates that CT can induce compensatory brain activity, or more broadly, compensatory scaffolding, in older adults. As per the STAC-R model, training has the potential to either develop or eliminate compensatory scaffolding. In cases where older adults show insufficient neural activation or deterioration, training can establish new scaffolding to support tasks performed inefficiently or not at all without it. Conversely, when older adults already rely on over-activation compared to young adults to execute a task, training can decrease this compensatory activation and enhance the performance of the primary networks (Park & Reuter-Lorenz, 2009). Surprisingly, there is a paucity of studies explicitly designed to investigate this possibility. A considerable number of studies on the effects of CT on brain activity have found that the training-induced changes are (or partially are) in line with compensatory scaffolding, even if the authors do not overtly articulate this and do not relate the results to the STAC-R model (for review see: Park & Smith, 2022; Zając-Lamparska, 2020). Most notably, the recurring emphasis on the particular role of the PFC and parietal cortex in CT effects consistently supports the assumptions of the compensatory enhancement of the fronto-parietal recruitment and the CRUNCH hypothesis. Finally, in some studies about the effects of CT on brain activity, researchers mention compensatory scaffolding when justifying their investigation or interpreting their findings (e.g., Heinzel et al., 2016, 2017). However, without considering important factors stemming from these theoretical models, such as differences in brain activity between older and young adults or those resulting from cognitive demands, conclusions about the potential impact of training on compensatory scaffolding may be less reliable and strong (Zając-Lamparska, 2020). A recent fMRI study, which considered both age and task difficulty, allowed for a comparison of the effect of training on older and young adults' brain activity during the performance of a task with different cognitive demands. It revealed that at baseline, older adults showed greater WM network activity than young adults, with activity declining at the highest WM loadings. After ten days of training with the delayed match-to-sample WM task, cognitive performance improved, and neural response increased at higher levels of task difficulty in both age groups. Significantly, the activation peak in older adults shifted toward higher WM loadings. These results are consistent with the STAC-R model's assumptions about the occurrence of compensatory scaffolding in older adults (in the form of higher activity already at lower cognitive demands) and the effect of training in removing compensatory scaffolding at lower but inducing it at higher cognitive demands (Iordan et al., 2020). However, this pattern of results was not repeated for the functional network reconfiguration after WM training. In this aspect, the response of young and older adults to the training differed. Specifically, young adults demonstrated an increased network segregation following training, denoting a shift towards more automated processing. In contrast, older adults tended to persist in, and perhaps reinforce, a more integrated and resource-intensive global workspace configuration (Iordan et al., 2021). This finding could indicate compensatory scaffolding, with an extended neuronal network engaged in the task. However, it could also be considered a form of dedifferentiation. It is difficult to conclude because correlations between changes in modularity and WM gains with training were not significant. The authors infer the age-related differences in the trajectories in functional network reorganization resulting from WM training (Iordan et al., 2021).
Aim of the current studyThe current study aimed to investigate whether WM training can, as predicted by the STAC-R model, induce compensatory scaffolding in older adults through increased prefrontal and parietal involvement, which is one of the compensatory scaffolding forms, described by the CRUNCH hypothesis.
The aim of the study is illustrated in Fig. 1, presenting it within the context of the simplified STAC-R model, including the place of the CRUNCH hypothesis in this model.
. Gray-filled text boxes and bold arrows illustrate the aim of the study.")
The aim of the study in the context of the simplified STAC-R model, including the place of the CRUNCH hypothesis in this model.
Note. The simplified STAC-R model is based on the full STAC-R model presented by Reuter-Lorenz and Park (2014, 2024). Gray-filled text boxes and bold arrows illustrate the aim of the study.
To fulfill the objective of our study, we compared the effects of WM training on theta and alpha power in older and young adults during the n-back task performance on three difficulty levels.
We selected the n-back task for both CT and measured the theta and alpha power associated with cognitive activity. The n-back task involves updating the content of WM (Jaeggi et al., 2010; Schmiedek et al., 2014). This task is one of the most popular experimental paradigms in the study of brain activity accompanying WM involvement (Miró-Padilla et al., 2019; Owen et al., 2005) and is commonly used in cognitive training (Jaeggi et al., 2008; Rodas et al., 2024; Soveri et al., 2017). In addition, both n-back task performance and WM in general show a decline with age (Bopp & Verhaeghen, 2020; Braver & West, 2008; Harada et al., 2013), fulfilling the assumption that a discrepancy between available neural resources and the task demands (supply-demand gap) is needed for the compensation phenomenon to occur (Cabeza et al., 2018).
We searched for evidence of the effect of training on the compensatory brain activity of older adults in changes in theta and alpha power measured electroencephalographically (EEG). Research on compensatory brain activity in older adults commonly relies on fMRI and PET. Surprisingly, there is a shortage of studies utilizing EEG despite its suitability for studying short-term phenomena like neural compensation (Cabeza et al., 2018; Zając-Lamparska, 2020). Since fMRI and PET findings cannot be directly expressed in EEG terms, an EEG-based approach requires analyzing the cognitive and neuronal mechanisms underlying the brain activity observed in neuroimaging and finding their counterparts in the EEG indicators. For this purpose, we incorporated the following inference model into our study (Fig. 2).

A framework to infer potential EEG markers of compensatory brain activity in older adults through cognitive and neurophysiological interpretation of PET and fMRI findings.
Note. We previously presented this inference framework in Zając-Lamparska et al., 2024a, 2024b.
In the case of the CRUNCH hypothesis, as indicators of the increased involvement of executive control postulated therein Reuter-Lorenz and Cappell, (2008), we considered an increase in theta power in the frontal-midline region (known as frontal midline theta, FMT) and central-parietal region, as well as a decrease in alpha power in the same areas. Increased cognitive control, top-down processing, and executive function engagement are indicated by increased theta rhythm (Roux & Uhlhaas, 2014; Sauseng et al., 2010). During cognitive task execution, elevated theta power correlates with improved performance, indicating that it supports memory retrieval, attentional focus, and executive functioning (Tan et al., 2024). Frontal midline theta (FMT) is particularly important. There is a consensus that FMT falls within the 4–8 Hz range and tends to be maximal around the Fz electrode (Hsieh et al., 2011). FMT is generally conceptualized as a marker of the need for cognitive control, including its initiating and executing (Cavanagh & Frank, 2014; Eisma et al., 2021; Eschmann et al., 2018). Research findings also suggest the link between FMT and planning and proactive control, response initiation, and inhibition (Cooper et al., 2019; Domic-Siede et al., 2021; Messel et al., 2021). Eisma et al. (2021) found that an increase in theta power was consistent across various control strategies. At the same time, it also differentiated between cognitive control mechanisms. Reactive and inhibitory control induced higher theta power than proactive control and response conflict. In turn, alpha band (8–12 Hz) is considered to be inversely correlate with cortical excitability (Wang et al., 2016). Decrease in alpha power in a particular region indicates improved information flow efficiency in that area and suggests that this region gets more actively involved during cognitive task execution (Gajewski & Falkenstein, 2014; Pesonen et al., 2007; Ward, 2003). On the other hand, increased alpha power in brain regions beyond those crucial for the performed task denotes active inhibition of information unrelated to the current cognitive involvement (Bonnefond & Jensen, 2012; Haegens et al., 2010; Tuladhar et al., 2007), what is known as “gating by inhibition” (Jensen & Mazaheri, 2010). As Gratton (2018) points out, both theta and alpha rhythms are associated with cognitive control but in a complementary manner. Alpha is linked to the maintenance of representations, while theta is associated with changes in representations. When attention needs to shift towards incoming information, theta power increases, while alpha power decreases (Clements et al., 2021).
In summary, we expected that as cognitive performance improves due to training, older adults will show an increase in theta power and a decrease in alpha power in the prefrontal and parietal regions as a manifestation of the enhanced involvement of cognitive control. On the other hand, in young adults, a pattern of change in theta and alpha power analogous to older adults is predicted for the more difficult versions of the task. In contrast, for the easy version, the opposite pattern (decrease in theta power, increase in alpha power) is anticipated as a manifestation of achieved proficiency and automation of task performance. In addition, we expect that after training, theta and alpha activity patterns in older adults will more closely resemble those observed in young adults than before training, especially at the lower level of task difficulty.
MethodParticipantsOur initial assumption was that the study would consist of three groups: experimental, active control, and passive control. Each group was to include 50 participants, 25 older and young adults each. The assumed sample size was based on prior works examining the effects of WM training on brain activity in older adults (Heinzel et al., 2016; Ten Brinke et al., 2017), and in older and young adults (Iordan, 2020). However, conducting the study during the COVID-19 pandemic caused us to encounter recruitment difficulties, especially among older adults. Therefore, we focused on recruiting enough participants for the experimental and passive control groups. We conducted our recruitment in stages. First, we randomly assigned individuals to either the experimental group or the passive control group. Once we reached a total of 20 older adults and 20 young adults in each of those groups, we then included the active control group in the random assignment process. Consequently, we do not complete a sufficiently large active control group.
The participants were volunteers who responded to online and public transport advertisements in Bydgoszcz, Poland. During an introductory meeting, we screened 299 individuals to establish inclusion criteria. The criteria were as follows: (1) Age matching the period of early adulthood (20–35 years old) or the first stage of late adulthood (60–75 years old); (2) Absence of mental illness and neurological disorders, including neurodegenerative diseases or severe head injuries, verified through structured interviews and the Mini International Neuropsychiatric Interview—M.I.N.I. 7.0.; (3) Normal or corrected-to-normal vision; (4) Intellectual norm confirmed by the Raven's Standard Progressive Matrices, SPM, in Polish standardization, performed without a time limit; (5) Absence of dementia symptoms, verified in older adults using the Polish version of the Mini-Mental State Examination (MMSE score ≥ 27); (6) Signing an informed consent to participate in the study after familiarizing with the research procedure, participation conditions, and receiving satisfactory answers to all questions. A total of 117 individuals met the inclusion criteria, comprising 54 older adults and 63 young adults. We divided the sample into the groups: experimental (n = 50, 25 older and 25 young adults), passive control (n = 47, 22 older and 25 young adults), and active control (n = 20, 7 older and 13 young adults).
During the subsequent study process, several participants dropped out of the sample. The reasons for the participants' dropout were (a) a non-completed study procedure and lack of post-test (one young adult from the active control group) and (b) insufficient number of good quality EEG recordings for the samples considered in the analysis, i.e., correct responses to the target (three older and two young adults from the experimental group, one older and one young adult from the passive control group, and two older adults and one young adult from the active control group). Consequently, 45 persons remained in the experimental group, 45 in the passive control group, and 16 in the active control group. The latter included only five older adults, so we decided not to include this group in the analyses.
The final sample comprised 90 individuals, divided into the experimental and passive control groups. The experimental group consisted of 22 older adults (19 women and three men; age: M = 66.318, SD = 3.695; years of education: M = 13.818, SD = 2.872; SPM raw score: M = 44.227, SD = 8.147; MMSE: M = 28.364, SD = 0.953) and 23 young adults (14 women and nine men; age: M = 26.826, SD = 5.211; years of education: M = 16.196, SD = 2.339; SPM raw score: M = 52.739, SD = 6.062), while the control group consisted of 21 older adults (16 women and five men; age: M = 66.905, SD = 4.482; years of education: M = 15.619, SD = 2.641; SPM raw score: M = 42.238, SD = 9.581; MMSE: M = 29.050, SD = 1.050) and 24 young adults (14 women and ten men; age: M = 25.208, SD = 4.709; years of education: M = 16.438, SD = 2.356; SPM raw score: M = 54.292, SD = 5.714).
Procedure and materialsThe study protocol and the informed consent form received approval from the Bioethics Committee of the Nicolaus Copernicus University in Toruń at the Ludwik Rydygier Collegium Medicum in Bydgoszcz (KB 90/2018). Before participating in the study, all individuals were briefed about its objective, confidentiality, and option to withdraw from the study. Each participant provided written informed consent in compliance with the Declaration of Helsinki. The research project was funded by the National Science Centre, Poland (grant no 2017/25/B/HS6/00,360). The study was registered on ClinicalTrials.gov with the Identifier NCT06235840 on 31 January 2024 after its completion.
A pretest-posttest study design was applied with an experimental group and a no-contact control group. The experimental factor was WM adaptive training using an n-back task. The training consisted of 12 sessions, each lasting approximately 45 min, scheduled over four weeks, with three sessions per week. In the pre-test and post-test, we measured the participants’ brain activity using EEG while performing the n-back task at three difficulty levels (1-back, 2-back, and 3-back). They also underwent a series of cognitive assessments, which we described in more detail in an article presenting the effects of WM training on behavioral measures (Zając-Lamparska et al., 2024c).
The n-back tasks utilized in this research for EEG measurement and training were created using the PsychoPy software. In both instances, the n-back task consisted of continuously presenting letters that appeared and disappeared one by one. During each presentation, the participant had to judge whether the present item displayed matched the item given in earlier "n" trials. A single block contained 20+n stimuli (where “n” represents the number from the "n-back" term) with seven targets and 13+n non-targets. The software randomized the presentation order of the stimuli for each task run, adhering to the specified number of targets and non-targets for each level. Each stimulus was presented for 500 ms, and the inter-stimulus interval (ISI) varied randomly between 1800 and 2500 ms.
In the pre-test and post-test, the sequence always began with the easiest level of the n-back task (1-back) and concluded with the most challenging one (3-back). Each difficulty level consisted of six blocks. The first block at each difficulty level served as a training block to help familiarize participants with the task rules. We excluded the results obtained in these first blocks from the statistical analyses. The n-back task accuracy in both the pre-test and post-test was measured using the sensitivity index (d′) based on signal detection theory (Meule, 2017). The formula for calculating d′ for yes/no tasks is d′ = z(H) – z(FA), where H and FA represent the Hits, and False Alarm rates and z(H) and z(FA) are the z-transformations, respectively (Stanislaw & Todorov, 1999). We used the Microsoft Excel formula d′ = NORMINV(hit-rate, 0, 1) - NORMINV(false-alarm-rate, 0, 1) to calculate d′. To account for extreme values before the z-transformation, we replaced rates of 0 with “0.5/n” and rates of 1 with “(n-0.5)/n”, where “n” is the total number of signal or noise trials, respectively (Macmillan & Kaplan, 1985).
The training consisted of 12 sessions, each containing 32 blocks. The first training session for all participants began with the easiest level, 1-back. The training was adaptive, meaning participants could move to higher or drop to lower difficulty levels every four blocks, according to the performance accuracy achieved. Increasing or decreasing the difficulty level was done by changing the “n” parameter by 1. The next training session began with the difficulty level at which the previous session ended.
EEG data acquisition and processingWe recorded the EEG signal using a 32-channel electroencephalograph (BioSemi Active Two System) with a sampling rate of 2048 Hz. Ag/AgCl pin-type active electrodes were used, with 29 electrodes placed on the scalp according to the international 10–20 system (left side: Fp1, AF3, F3, F7, FC1, FC5, C3, CP1, CP5, T7, P3, P7, PO3, and O1; right side: Fp2, AF4, F4, F8, FC2, FC6, C4, CP2, CP6, T8, P4, P8, PO4, and O2; midline: Fz, Cz, Pz, and Oz). We used the Common Mode Sense (CMS) active electrode and Driven Right Leg (DRL) passive electrode for grounding, with the reference electrode placed at Cz. We analyzed the EEG signal for correct responses to the target.
The EEG data preprocessing was performed with the use of EEGLab version 2202.0 (Delorme & Makeig, 2004). The data was downsampled to 256 Hz. Signals below 0.1 Hz and above 40 Hz were filtered out using a finite impulse response fil-ter (EEGLAB's built-in 425-point Hamming windowed sinc FIR filter with passband edges of 2 and 40 Hz with −6 dB cutoff frequencies 1 Hz and 41 Hz, transition band width 2 Hz), and the data were re-referenced with a common average reference. The Artifact Subspace Reconstruction (ASR) method was employed to remove short-time high-amplitude artifacts, as implemented in the Clean Raw Data EEGLab plug-in Plechawska-Wojcik et al. (2019). We included the initial reference when computing the average for re-referencing, ensuring the full rank of the data. After that, a series of techniques, including independent component analysis (ICA) decomposition “runica” dipolar source estimation (DIPFIT) with a boundary element head model (BEM) and multi-variate source classification, were utilized to identify the sources of brain oscillations based on an equivalent current dipole model, as implemented in ICLabel EEGLab plug-in Pion-Tonachini et al. (2019). The data was analyzed by classifying independent components based on their power spectrum distribution, time-frequency characteristics, and dipole localization. Non-brain sources such as eye blinking, lateral eye movement, muscle activity, and electrical noise were eliminated. The remaining signal was segmented. Each segment lasted 1.200 ms, with a baseline from −200 to 0 ms and an event period from 0 to 1.000 ms., where “0” denotes the appearance of a target letter in N-back task. These segments were averaged by individual subjects and experimental conditions (level of difficulty of the n-back task, age group, and research group) and then subjected to a fast Fourier transform (FFT). A power spectrum (the square root of the sum of the squared FFT results) was calculated, and then a decimal logarithm was computed. The procedure we applied to two frequency ranges: theta (4–7 Hz) and alpha (8–12 Hz).
Statistical analysesWe used a mixed model two-way analysis of variance (ANOVA) with two between-subjects factors, i.e., research group (experimental vs. control) and age group (young vs. older adults), and two within-subjects factors. i.e., measurement (pre-test vs. post-test) and the difficulty level of the n-back task (1-back, 2-back, and 3-back) to evaluate the effect of training on both behavioral and EEG outcomes. The parameters analyzed as dependent variables were: for behavioral data - the sensitivity index (d′), and EEG data – theta and alpha power averaged individually for electrodes located in two brain areas: frontal-midline (Fz, AF3, AF4, F3, F4, FC1, and FC2) and central-parietal (CP1, CP2, P3, P4, and Pz). In addition, we also performed ANOVAs for pre-test and post-test outcomes, with two between-subjects factors (research group and age group) and one within-subjects factor (n-back task difficulty). In the case of statistically significant results, we supplemented ANOVAs with post-hoc analysis using the Tukey-Kramer test.
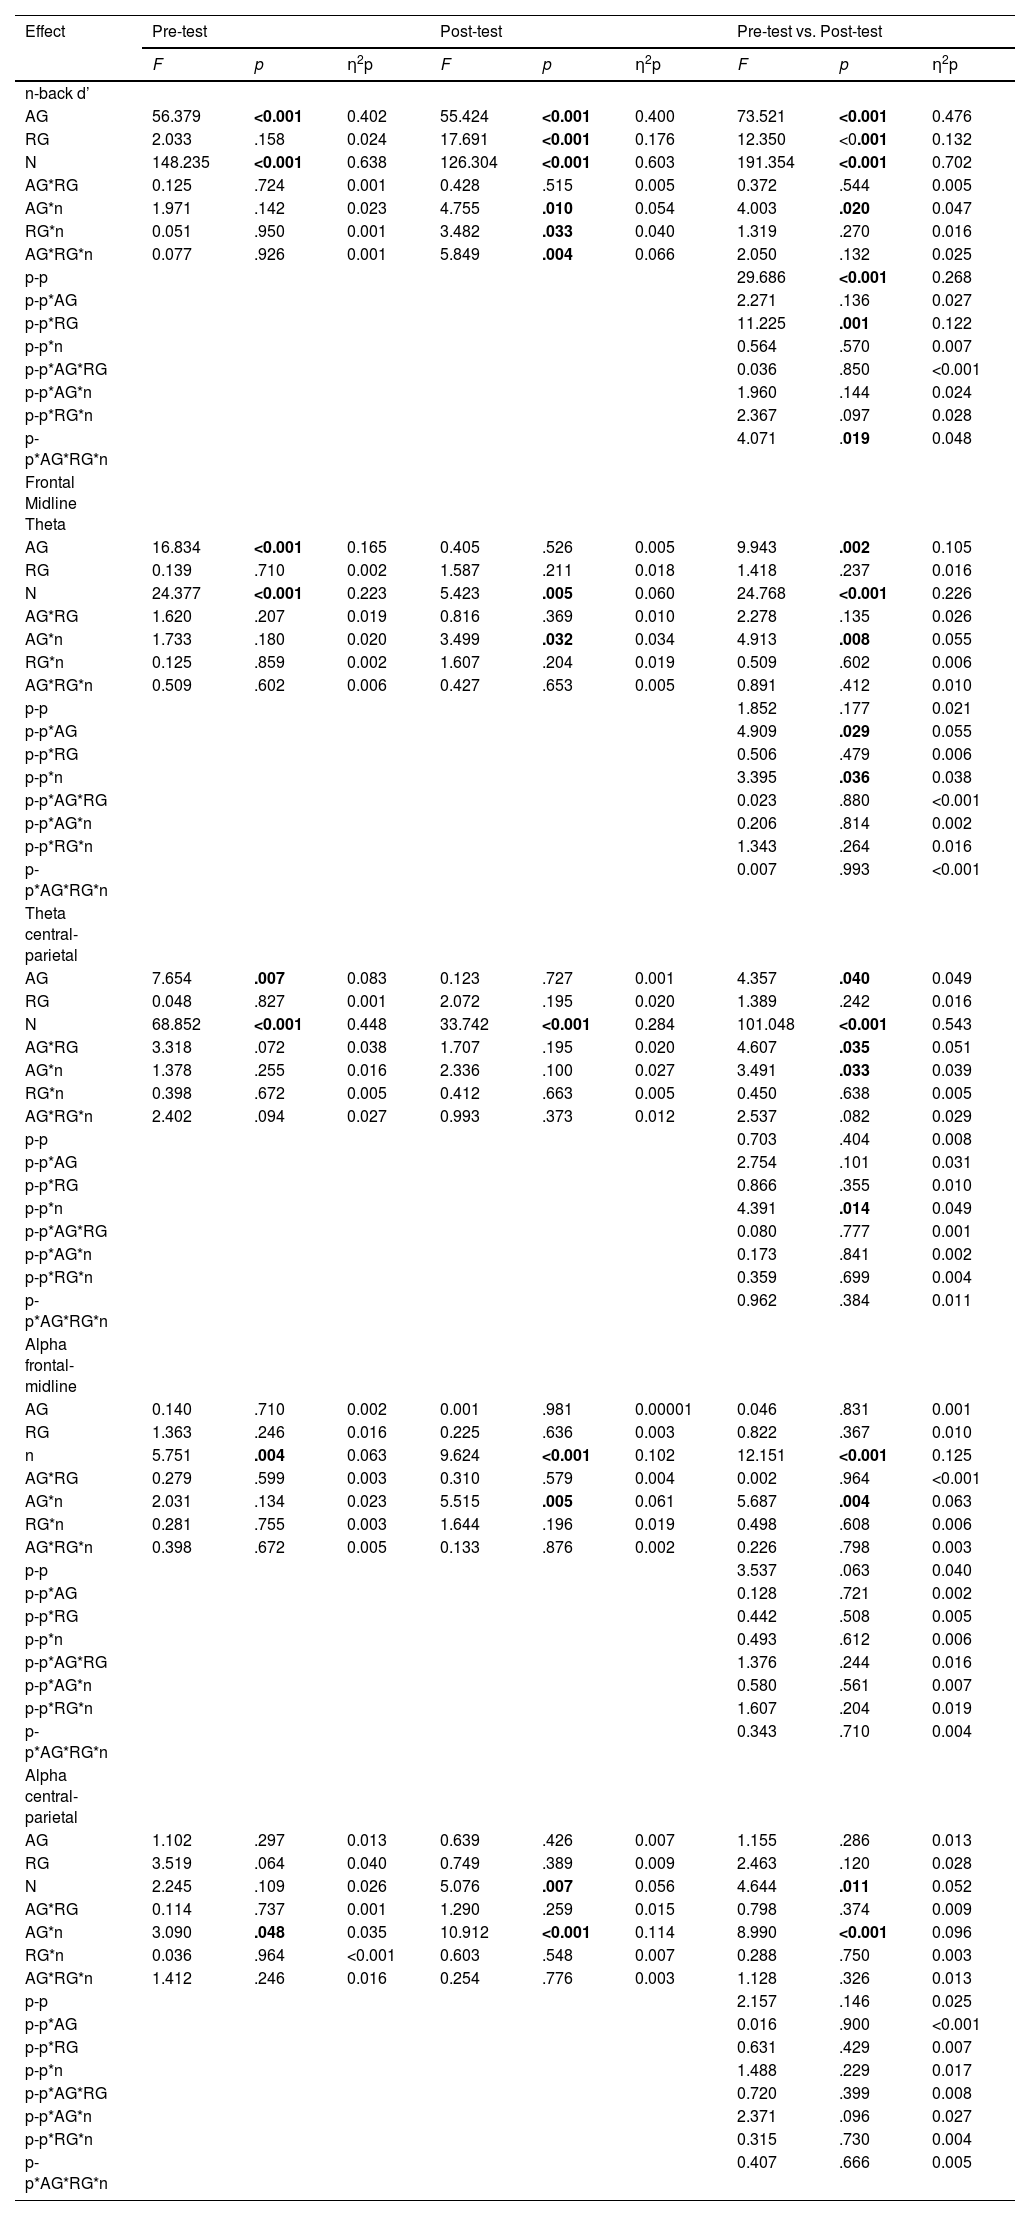
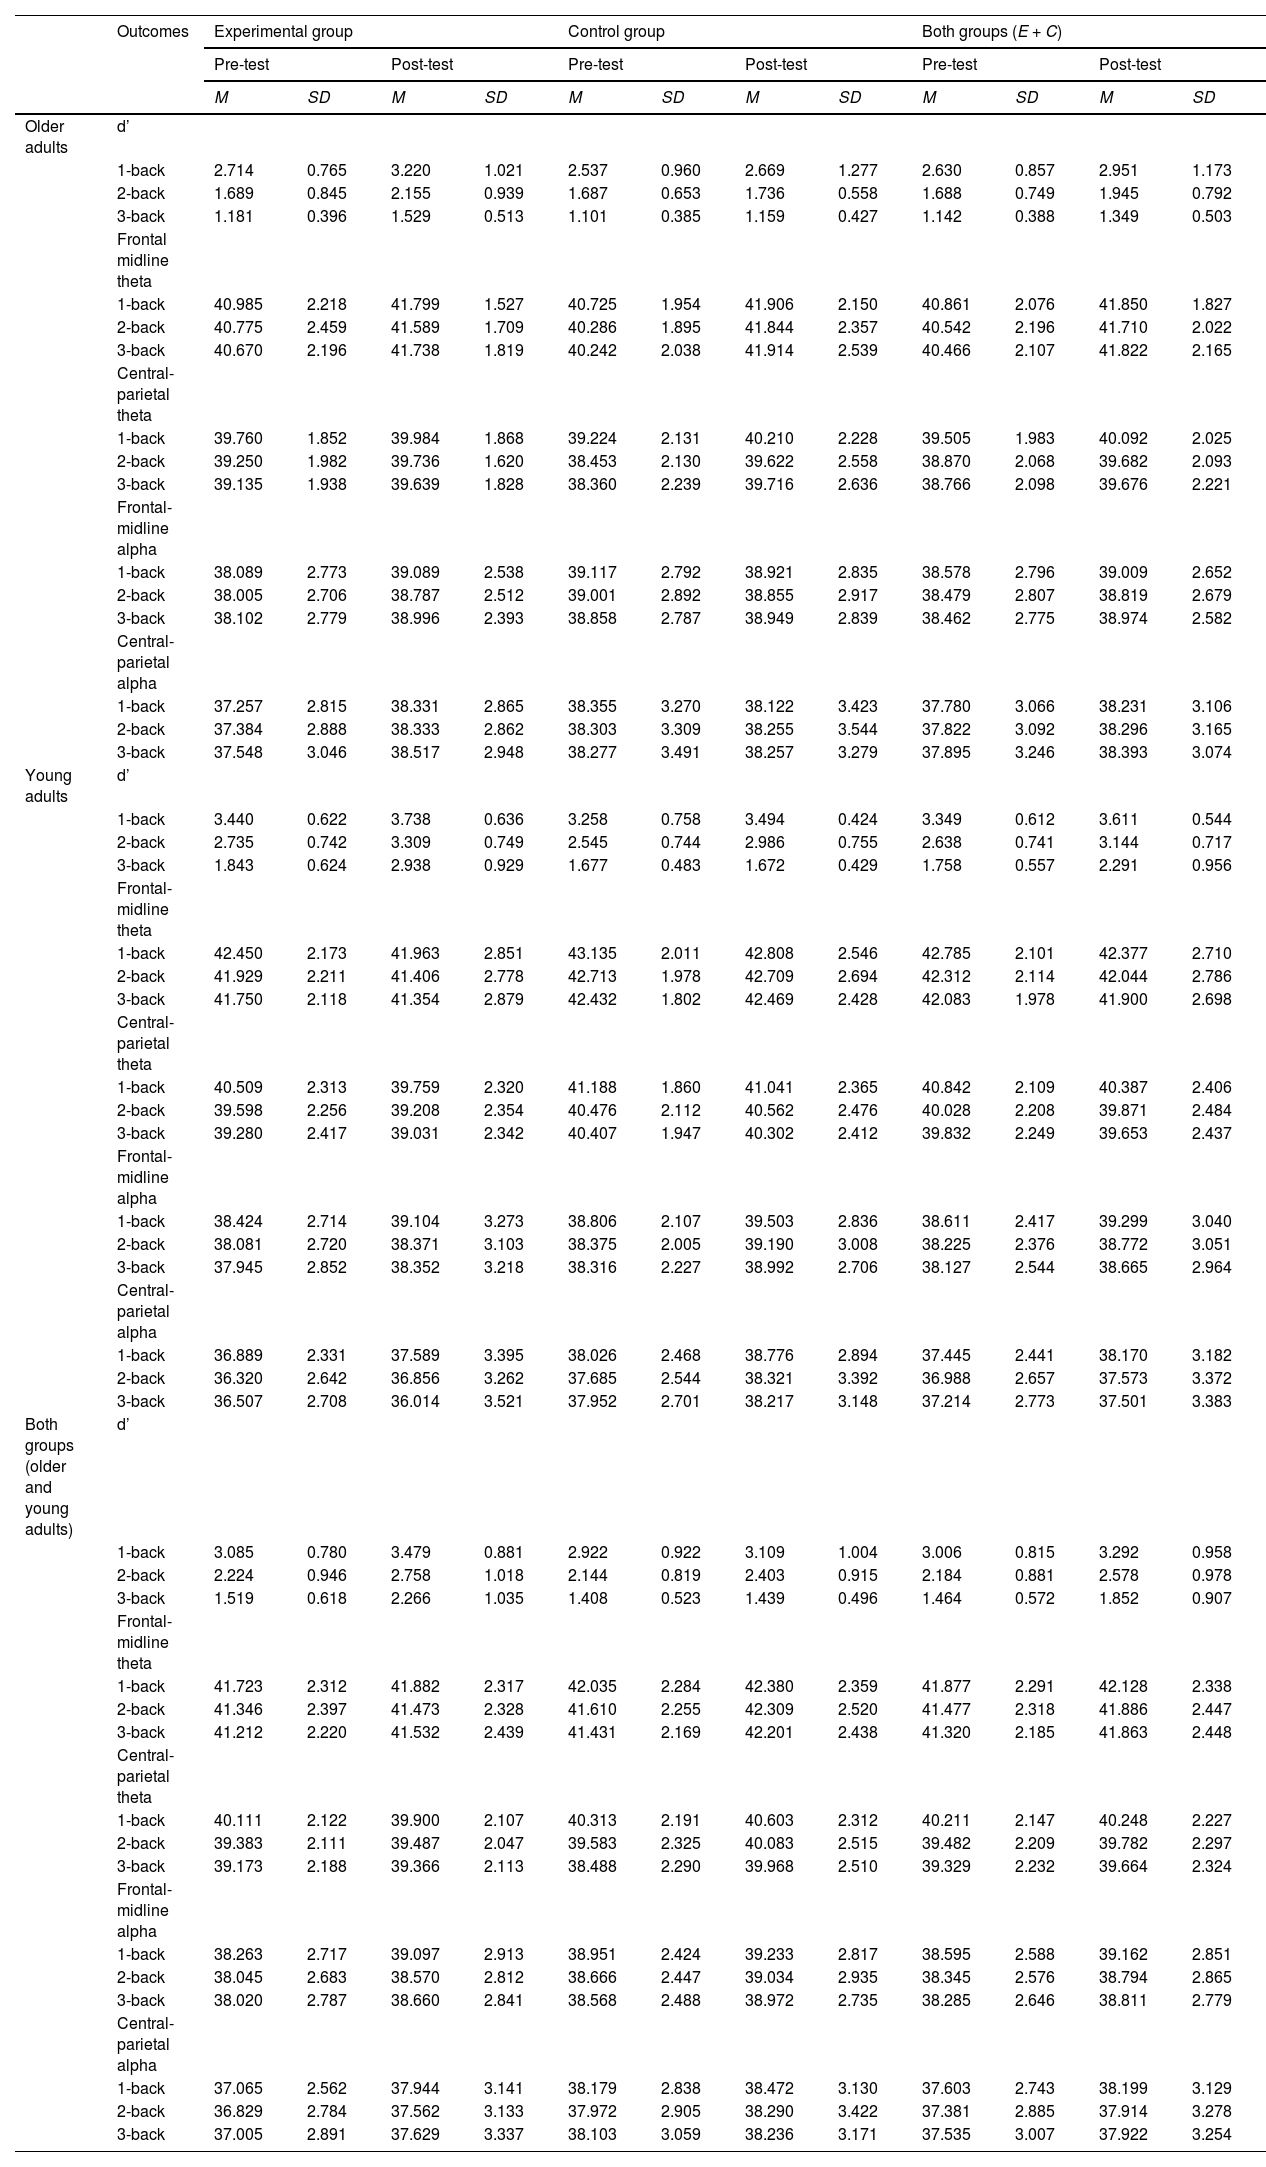
ResultsWe have organized the presentation of the results of the statistical analyses into separate sections for cognitive performance, theta power, and alpha power. The ANOVA results for all considered outcomes can be found in Table 1. The post hoc analysis results, are presented in the text. Table 2 displays the means and standard deviations of d', theta power, and alpha power in specific brain areas for each age and study group at the pre-test and post-test, as well as for age groups without division into experimental and control, and for experimental and control groups without division by age.
Mixed-design ANOVA results for pre-test, post-test, and repeated measurement.
Note. AG – the age group (older adults vs. young adults); RG – the research group (experimental vs. control); p-p – pretest-posttest; n – the level of difficulty in the n-back task (1-back, 2-back, 3-back).
Mean and standard deviation of theta and alpha power recorded in frontal-central and central-parietal areas in experimental and control groups of older and young adults in pre-test and post-test.
Note. d’ – sensitivity index; E + C – experimental and control groups together.
In the pre-test, according to the ANOVA results (Table 1, Fig. 3), the n-back task performance (d') was significantly different according to age group and task difficulty level but not to the experimental vs. control study group. None of the interaction effects of these variables proved significant. Post hoc analysis showed that performance on the n-back task was significantly (p < .001) worse in older adults than in young adults (Table 2). Performance also deteriorated significantly (p < .001) when progressing to successive levels of task difficulty – from 1-back to 2-back and from 2-back to 3-back (Table 2).
 at three levels of difficulty in the experimental and control groups of older and young adults at the pre-test and post-test. Note. E – experimental group, C – control group, PRE – pre-test, POST – post-test.")
Regarding the effect of WM training on cognitive performance, ANOVA revealed that the effect of measurement point (pre-test vs. post-test), the interaction effect of measurement point with the study group, and the interaction effect of four factors: measurement point, study group, age group, and task difficulty level were significant (Table 1, Fig. 3). At the same time, the interaction effect of four independent variables was small and notably lower than the other two significant effects. Post hoc analysis of the effect of the measurement point showed significantly better cognitive performance in the post-test than in the pre-test (p < .001; Table 2). The analysis of the effect of the measurement point's interaction with the study group revealed that significant performance improvement occurred in the experimental group (p < .001; Table 2) but not in the control group (p = .403; Table 2). Finally, according to the results of the post hoc analysis for the interaction effect of the four factors, in the experimental groups, cognitive performance improved in the post-test compared to the pre-test among young adults for the 2-back (p = .008; Table 2) and 3-back task (p < .001; Table 2), but not for the 1-back task (p = .931; Table 2) and not among older adults (1-back p = .085; 2-back p = .250; 3-back p = .826; Table 2). In contrast, no significant changes in cognitive performance were revealed in the control groups, whether young (1-back p = 1.000; 2-back p = .245; p = 1.000; Table 2) or old adults (1-back p = 1.000; 2-back p = 1.000; and 3-back p = 1.000; Table 2).
In the post-test, the differences in cognitive performance between the age groups, study groups, and task difficulty level proved significant, as well as the interaction effects of the difficulty with the study and age groups (Table 1, Fig. 3). The main effects were large, and the interaction effects were rather small. Finally, the interaction effect of the three factors – study group, age group, and difficulty level of the n-back task – was also found to be significant with medium effect size. According to the post hoc analysis for main effects, older adults still showed poorer (p < .001) cognitive performance than young adults (Table 2). The task performance worsened when cognitive demands increased (1-back vs. 2-back p < .001; 2-back vs. 3-back p < .001; Table 2). At the same time, in the post-test, individuals in the experimental group presented higher cognitive performance than those in the control group (p < .001; Table 2). The effect of the interaction of the level of task difficulty with the study group indicated that cognitive performance declined with increasing task difficulty in both the control group (1-back vs. 2-back p < .001; 2-back vs. 3-back p < .001; Table 2) and experimental group (1-back vs. 2-back p < .001; 2-back vs. 3-back p = .001; Table 2), with the former having slightly greater decline between 2-back and 3-back levels than the experimental one. Similarly, in the case of the interaction between the difficulty level and age group, both groups showed inferior cognitive performance when the cognitive demands increased (young adults: 1-back vs. 2-back p = .004; 2-back vs. 3-back p < .001; older adults:; 1-back vs. 2-back p < .001; 2-back vs. 3-back < 0.001; Table 2). However, in older adults, the difference between d' in the 1-back and 2-back tasks was greater than in young adults. As for the three-factors interaction effect, post hoc analysis revealed that in the post-test in young adults, cognitive performance was better in the experimental group than in the control group only in the 3-back task (p < .001; Table 2), but not in 1-back (p = 1.000; Table 2) and 2-back (p = .947; Table 2). In turn, in older adults, the experimental and control groups did not differ significantly at any of the task's difficulty levels (1-back p = .522; 2-back p = .833; 3-back p = .935; Table 2).
Theta powerFrontal midline thetaAccording to the ANOVA results, for FMT power in the pre-test, two main effects were significant and large: age group and task difficulty level (Table 1, Fig. 4). Post hoc analysis showed that FMT power was significantly higher in young than older adults (p < .001; Table 2). Moreover, FMT power was significantly higher when performing a 1-back task than two more difficult levels, i.e., 2-back and 3-back (p < .001), between which, in turn, there were no significant differences (p = .131) in FMT power (Table 2).
 according to the level of the task difficulty. The top three plots show the distribution of the theta power for 1-back, 2-back, and 3-back tasks obtained in the pre-test, labeled as “PRE.” The bottom three plots show the distribution of the theta power for 1-back, 2-back, and 3-back tasks obtained in the post-test, labeled as “POST”. Panel A shows the distribution of the alpha power in experimental group of older adults, labeled as “OA-E”. Panel B shows the distribution of the alpha power in control group of older adults, labeled as “OA-C”. Panel C shows the distribution of the alpha power in experimental group of young adults, labeled as “YA-E”. Panel D shows the distribution of the alpha power in control group of young adults, labeled as “YA-C”.")
 according to the level of the task difficulty. The top three plots show the distribution of the theta power for 1-back, 2-back, and 3-back tasks obtained in the pre-test, labeled as “PRE.” The bottom three plots show the distribution of the theta power for 1-back, 2-back, and 3-back tasks obtained in the post-test, labeled as “POST”. Panel A shows the distribution of the alpha power in experimental group of older adults, labeled as “OA-E”. Panel B shows the distribution of the alpha power in control group of older adults, labeled as “OA-C”. Panel C shows the distribution of the alpha power in experimental group of young adults, labeled as “YA-E”. Panel D shows the distribution of the alpha power in control group of young adults, labeled as “YA-C”.")
Topographical distribution of the theta power for three levels of n-back task difficulty in the older and young adult age groups in the pre-test and the post-test.
Note. All plots provide the topographical distribution of the theta power (μV2) according to the level of the task difficulty. The top three plots show the distribution of the theta power for 1-back, 2-back, and 3-back tasks obtained in the pre-test, labeled as “PRE.” The bottom three plots show the distribution of the theta power for 1-back, 2-back, and 3-back tasks obtained in the post-test, labeled as “POST”. Panel A shows the distribution of the alpha power in experimental group of older adults, labeled as “OA-E”. Panel B shows the distribution of the alpha power in control group of older adults, labeled as “OA-C”. Panel C shows the distribution of the alpha power in experimental group of young adults, labeled as “YA-E”. Panel D shows the distribution of the alpha power in control group of young adults, labeled as “YA-C”.
Regarding the differences in FMT power between the pre-test and post-test assessed by ANOVA, two interaction effects were found to be significant, however rather small: point of measurement (pre-test vs. post-test) with age group and with the n-back task difficulty (Table 1, Fig. 4). A post hoc analysis of the interaction effect of measurement point and age group showed no significant change in FMT power in either age group. However, the p-value for older adults was p = .078, while the p-value for younger adults was p = .922. In turn, post hoc analysis revealed significant changes at each difficulty level for the interaction of measurement point and task difficulty, with larger changes for the more difficult levels than for the easiest ones (1-back p = .025; 2-back and 3-back p < .001; Table 2).
Unlike in the pre-test, the ANOVA no longer found a significant effect of age group on FMT power in the post-test (Table 1). The effect of task difficulty level remained significant (Table 1), with significantly higher FMT power when performing the 1-back task than the 2-back (p = .012) and 3-back (p = .005) tasks, and no differences (p = .959) in FMT power accompanying the performance of the latter two difficulty levels (Table 2). At the same time, the effect size was medium, while in the pre-test, it was large (Table 1, Fig. 4). In addition, a significant small interaction effect of age group and task difficulty level was revealed, which was absent in the pre-test (Table 1). According to the results of post hoc analysis, in the post-test, older adults no longer differed from young adults in terms of FMT power at any level of task difficulty (1-back p = .916; 2-back p = .988; 3-back p = 1.000; Table 2). At the same time, only young adults maintained the pattern of differences in FMT power with higher power in performing the 1-back task than the 2-back (p = .048) and 3-back (p < .001) tasks. In older adults, on the other hand, FMT power did not differ by task difficulty level (1-back vs. 2-back p = .867; 1-back vs. 3-back p = 1.000; 2-back vs. 3-back p = .946).
Theta in the central-parietal areaTheta power, measured in the pre-test in the central-parietal area, differed, like FMT, according to age group (medium effect size) and the task difficulty level (large effect size) (Table 1, Fig. 4). Post hoc analysis revealed that it was higher in young than in older adults (p = .010; Table 2) and when performing the 1-back task than the 2-back and 3-back tasks (p < .001; Table 2), for which, in turn, it was not significantly different (p = .133; Table 2).
In the ANOVA on theta power measured in the central-parietal region in the pre-test and post-test, only the interaction effect of the measurement point with the task difficulty level was significant but small (Table 1, Fig. 4). According to the post hoc analysis results, significant changes occurred for the 2-back (p = .001; Table 2) and 3-back tasks (p < .001; Table 2) but not for the 1-back (p = 997; Table 2).
In the post-test, as with the FMT, the ANOVA no longer revealed significant differences in theta power related to age group, only differences related to task difficulty (Table 1, Fig. 4). The effect size for this factor was still large. According to the results of the post hoc analysis, theta power in the central-parietal area in the post-test was still significantly higher in performing the 1-back task than the 2-back and 3-back tasks (p < .001; Table 2), with no differences for the latter two levels of difficulty (p = .252; Table 2).
Alpha powerAlpha in the frontal-midline areaIn the pre-test, alpha power in the frontal-midline region, according to the ANOVA results, depended only on the level of task difficulty, with a medium effect size (Table 1). Post hoc analysis indicated that alpha power was significantly higher during the performance of the 1-back than the 2-back (p = .022; Table 2) and 3-back (p = .003; Table 2) tasks. In contrast, alpha power was not significantly different for the two more difficult task versions (p = .801; Table 2).
When comparing alpha power in the frontal-midline region between the pre-test and post-test, the ANOVA results indicated that the measurement point was not a significant factor, alone or in interaction with other variables (Table 1).
In the post-test, the task's difficulty level remained relevant to alpha power (Table 1). The effect size of this factor was medium. Again, the post hoc analysis showed significantly higher alpha power on the 1-back task than on the 2-back and 3-back tasks (p < .001; Table 2) and no difference between the latter two difficulty levels (p = .981; Table 2). In addition, in the post-test, the interaction effect of task difficulty level with age group proved significant and medium (Table 1). The pattern described above, with significantly higher alpha power during the performance of the 1-back task compared to the two more difficult versions of the task, was revealed only among young adults (1-back vs. 2-back and 1-back vs. 3-back p < .001; 2-back vs. 3-back p = .957; Table 2). In older adults, on the other hand, alpha power did not differ according to the difficulty level of the task performed (1-back vs. 2-back p = .697; 1-back vs. 3-back p = 1.000; 2-back vs. 3-back p = .847; Table 2).
Alpha in the central-parietal areaThe results obtained for alpha power measured in the central-parietal region were similar to those obtained from the frontal-midline area. In the pre-test, the only significant ANOVA effect for alpha power was an interaction effect of task difficulty level and age group. This effect was, however, small (Table 1, Fig. 5). Post-hoc analysis found that significant differences occurred only in the young adult group and involved higher alpha power during the 1-back task than the 2-back task (p = .013; Table 2). In the same group, alpha power did not differ between 1-back and 3-back tasks (p = .554; Table 2), nor 2-back and 3-back (p = .582; Table 2). In contrast, among older adults, alpha power from the central-parietal area did not differ according to the difficulty level of the task (1-back vs. 2-back p = 697; 1-back vs. 3-back p = 1.000; 2-back vs 3-back p = .847; Table 2).
 according to the level of the task difficulty. The top three plots show the distribution of the alpha power for 1-back, 2-back, and 3-back tasks obtained in the pre-test, labeled as “PRE.” The bottom three plots show the distribution of the alpha power for 1-back, 2-back, and 3-back tasks obtained in the post-test, labeled as “POST”. Panel A shows the distribution of the alpha power in experimental group of older adults, labeled as “OA-E”. Panel B shows the distribution of the alpha power in control group of older adults, labeled as “OA-C”. Panel C shows the distribution of the alpha power in experimental group of young adults, labeled as “YA-E”. Panel D shows the distribution of the alpha power in control group of young adults, labeled as “YA-C”.")
 according to the level of the task difficulty. The top three plots show the distribution of the alpha power for 1-back, 2-back, and 3-back tasks obtained in the pre-test, labeled as “PRE.” The bottom three plots show the distribution of the alpha power for 1-back, 2-back, and 3-back tasks obtained in the post-test, labeled as “POST”. Panel A shows the distribution of the alpha power in experimental group of older adults, labeled as “OA-E”. Panel B shows the distribution of the alpha power in control group of older adults, labeled as “OA-C”. Panel C shows the distribution of the alpha power in experimental group of young adults, labeled as “YA-E”. Panel D shows the distribution of the alpha power in control group of young adults, labeled as “YA-C”.")
Topographical distribution of the alpha power for three levels of n-back task difficulty in the older and young adult age groups in the pre-test and the post-test.
Note. All plots provide the topographical distribution of the alpha power (μV2) according to the level of the task difficulty. The top three plots show the distribution of the alpha power for 1-back, 2-back, and 3-back tasks obtained in the pre-test, labeled as “PRE.” The bottom three plots show the distribution of the alpha power for 1-back, 2-back, and 3-back tasks obtained in the post-test, labeled as “POST”. Panel A shows the distribution of the alpha power in experimental group of older adults, labeled as “OA-E”. Panel B shows the distribution of the alpha power in control group of older adults, labeled as “OA-C”. Panel C shows the distribution of the alpha power in experimental group of young adults, labeled as “YA-E”. Panel D shows the distribution of the alpha power in control group of young adults, labeled as “YA-C”.
According to ANOVA, neither the point of measurement (pre-test vs. post-test) nor its interaction with other variables proved significant for alpha power in the central-parietal region (Table 1).
Furthermore, the same effects were significant in the post-test for central-parietal alpha power as in the frontal-midline area, namely the task's difficulty level (small effect size) and interaction of this level with the age group (medium effect size) (Table 1). Once again, post hoc analysis showed that alpha power was significantly higher during the performance of 1-back than the 2-back (p = .006; Table 2) and 3-back (p = .009; Table 2) tasks, while there were no significant differences in alpha power for the 2-back and 3-back tasks (p = .996; Table 2). Again, this pattern was present only in the young adult group (1-back vs. 2-back and 1-back vs. 3-back p < .001; 2-back vs. 3-back p = .994; Table 2). There were no significant differences in alpha power according to the n-back task difficulty level among older adults (1-back vs. 2-back p = .997; 1-back vs. 3-back p = .843; 2-back vs. 3-back p = .980; Table 2).
DiscussionThe present study aimed to examine whether WM training can improve cognitive performance and promote compensatory scaffolding in older adults, as suggested by the STAC-R model. We expected this effect to manifest through enhanced activity in the prefrontal and parietal regions, aligning with one of the compensatory scaffolding types outlined in the CRUNCH hypothesis. To understand the distinct changes in older adults, we analyzed the results from this group in comparison to those of young adults.
Cognitive performanceBaseline cognitive performanceIn line with previous findings (Bopp & Verhaeghen, 2020; Braver & West, 2008; Harada et al., 2013), older adults in our study also manifested poorer WM functioning than young adults. Reduced WM functioning in older adults was already apparent at the lowest cognitive demands, namely in the 1-back task. Therefore, our study did not reproduce the conditions described in the CRUNCH hypothesis and the STAC-R model (Park & Reuter-Lorenz, 2009; Reuter-Lorenz & Cappell, 2008). According to them, for a task difficulty level in which older adults achieve the same results as young adults due to compensatory brain activity, training would lead to a return to the primary network or “youthful” activity pattern instead of inducing further compensation. At the same time, it should be noted that in on the 1-back task, performance in the older adults, although worse than in young adults, was relatively good, as evidenced by the sensitivity index value (d’).
Changes in cognitive performanceTraining improved performance on the n-back task, albeit to a limited extent. The positive results of the training are indicated by the significant interaction effect of the measurement point with the study group and the corresponding results of the post hoc analysis, which revealed that significant improvement in task performance occurred only in the experimental group, not the control group. However, the significant (albeit small) interaction effect of four factors: point of measurement, age group, study group, and task difficulty, supplemented by the results of the post hoc analysis, provide a more precise image. It shows that the improvement resulting from training occurred mainly in young adults in the more difficult versions of the n-back task. The absence of change in this particular age group regarding the easiest task is unsurprising. This result is attributable to the fact that young adults had already achieved very high performance on the 1-back task during the pre-test. Thus, we encountered a ceiling effect, rendering further improvement unattainable at this level of task difficulty. On the other hand, in older adults, the improvement, although evident in the mean scores obtained in the pre-test and post-test, was too small to prove statistical significance in post hoc analysis. The limited effects of WM training on cognitive performance levels were discussed more extensively, including the transfer effect, in the article (Zając-Lamparska, 2024c) on the training impact on behavioral outcomes based on data collected in a somewhat larger sample, i.e., including participants which results we had to remove from the current sample due to insufficient EEG signal quality. Overall, the lack of significant improvement in the performance of the trained n-back task in older adults is not consistent with the results of meta-analyses (Bonnechère et al., 2020; Chiu et al., 2017; Lampit et al., 2014) which indicated at least small effects of CT in this age group. On the other hand, not all the individual studies included in these meta-analyses revealed significant changes under the influence of training in older adults, even on the same outcome variable (Chiu et al., 2017), including WM (e.g., Bonnechère et al., 2020; Lampit et al., 2014). Still, the result obtained in our study is particularly concerning since we examined the improvement in the n-back (trained) task, not the transfer effect. Meta-analyses indicated that in WM training, older adults improved significantly in the trained tasks (Sala et al., 2019; Teixeira-Santos et al., 2019). However, these meta-analyses included various WM tasks. A meta-analysis focusing solely on the n-back task used in training adults of different ages (Soveri et al., 2017) indicated a significant post-training improvement in the n-back task's performance. Age was not a significant moderator of this effect. At the same time, only 5 of the 41 experiments included in this meta-analysis involved older adults. In another meta-analysis by Karbach and Verhaeghen (2014), the authors only included studies conducted among older adults and separated n-back task training from other WM training. According to this meta-analysis, the improvement in performance on the n-back task after training was significant; however, this result was again based on only four studies out of the 61 included in the meta-analysis. Thus, the results obtained in our study can contribute to a long-standing and still inconclusive dispute about the effectiveness of WM (and specifically, n-back) training, not only in older adults but in general. At the same time, the limited positive effects in the older adult group may result from the restricted length and intensity of the training. The difficulty of the n-back task at its higher levels may also be a relevant factor, constraining the ability of older adults to “advance” in training due to WM's cognitive limitations and reduced plasticity in this age group.
Brain activityBaseline brain activityIn the baseline, age-related differences were revealed only for theta power. Theta power, measured in the frontal-midline and central-parietal areas, was lower at baseline in older adults compared to young adults. This result suggests less effective neural engagement in older adults during the n-back task performance (Belham et al., 2013; Gajewski & Falkenstein, 2014). Lowered theta power in older adults, along with the poorer cognitive performance observed in this age group, supports the idea that a decrease in theta power can be seen as an indicator of neurocognitive aging in working memory (Cummins & Finnigan, 2007; van de Vijver et al., 2014; Reichert et al., 2016).
The lower theta power in older adults is also in line with the change in processing strategies that occurs with aging in performing the n-back task, including the lesser involvement of executive processes. In general, the n-back task is characterized by high demands on cognitive control (Scharinger et al., 2017), which is strongly related to the theta band (Eisma et al., 2021; Roux & Uhlhaas, 2014). However, the cross-sectional research indicated that while young adults primarily utilize executive functions during the n-back task performance, older adults rely more on attentional resources and memory processes and engage executive processes to a lesser extent (Gajewski et al., 2018).
At the same time, theta power in the two areas considered is consistently (regardless of age group) lower during performance on the task's more difficult 2-back and 3-back versions, regardless of age group, and higher on the easier 1-back version. Significant differences in theta power between the 1-back task and the 2-back and 3-back versions, accompanied by no differences between the latter two, can be considered within the framework of the three-sub-process model of the n-back task (Chen et al., 2008). This model indicates that matching, replacement, and shift are sub-processes involved in the n-back task. The 0-back task only requires matching, the 1-back task requires matching and replacement, and the 2-back task, as well as more difficult versions of the n-back task (where “n” has a higher value), require the involvement of all three sub-processes, matching, replacement, and shift. These inequalities in cognitive load may explain why the differences are revealed specifically between the 1-back task, which is based on two sub-processes, and the 2-back and 3-back tasks, which involve all of them. At the same time, based on previous research and own studies, the authors (Chen et al., 2008) posit that replacement may be directly influenced by bottom-up control in the posterior area. In contrast, the shift is primarily influenced by top-down control in the frontal area. This would suggest expecting higher theta power for versions of the task that require the sub-process shift to be involved, i.e., 2-back and 3-back, rather than 1-back. However, we obtained the opposite result. Therefore, if we additionally consider that previous studies have indicated that theta power increases with the increase of the set of stimuli successfully stored in the WM (Itthipuripat et al., 2013; Jensen & Tesche, 2002) and that higher theta power during the involvement of memory, attention, and cognitive control is associated with better performance (Tan et al., 2024), our results may suggest a decline in neural efficiency in both age groups as cognitive demands increase, corresponding to deteriorating task performance. This interpretation is consistent with the assumptions of the Cognitive Load Theory (Sweller, 1988), which posits that as cognitive resources become depleted and mental overload occurs, efficiency in processing declines, which can lead to reduced theta activity. In line with these assumptions are the results of the study by Arnau et al., 2021, which interpretation suggests that reduced task-related theta power with increased task difficulty (visual Simon task in this study) may indicate decreased task engagement and cognitive control, reflecting the impact of mental fatigue on performance. In another study on the relationship between theta power and cognitive workload assessed in multitasking environments, theta power increased with the cognitive load when the level of cognitive performance persisted. However, as the performance deteriorated, theta power stopped growing and reached a plateau (Puma et al., 2018). Moreover, in the study by Fuentes-García et al. (2019), the theta power accompanying an increase in the difficulty of a task (chess game) increased, but only in the group of participants who won. This suggests that increased theta power only occurs with effective coping with escalating cognitive demands. Finally, attempts to elicit consistent patterns of increasing theta power through progressively challenging tasks have been ineffective in multiple studies (see Puma et al., 2018 for review). This highlights the complexity of the relationship between cognitive load and theta power. Based on our results, it seems reasonable to interpret that an increase in cognitive load during the n-back task leads to decreased neural efficiency (lower theta power) and behavioral efficiency (lower d' index, indicating less correct performance) in both age groups.
Baseline alpha power was also dependent on the level of task difficulty. For the alpha measured in the frontal midline area, the power was significantly higher in a 1-back task than in the two higher difficulty levels, regardless of the participants' age. In turn, for alpha measured in the central parietal region, the decrease in power occurred only between the 1-back and 2-back tasks and was observed only in young adults. The observed decline in alpha power corresponding with heightened cognitive demands is consistent with existing research findings, which interpret it as a mechanism that facilitates the regulation of information flow within task-relevant brain regions, fosters a more profound information processing, and denotes enhanced mental effort (Fairclough & Ewing, 2017; Karlsson & Sander, 2023; Pesonen et al., 2007; Wang et al., 2016; Zhozhikashvili et al., 2022; Zhu et al., 2021) .2 The differences observed between the 1-back task and the two more difficult versions can again be explained by the three-sub-process model of the n-back task (Chen et al., 2008). Moreover, in the case of alpha, the differences are consistent with this model's assumptions (contrary to theta, as described above). The decrease in alpha power that occurs with an increase in cognitive (including WM) load has primarily been observed in the parietal and posterior areas of the brain Chen et al. (2022); Karlsson and Sander, (2023); Scharinger et al. (2017); Zhozhikashvili et al. (2022). However, studies also indicated changes in alpha power in other brain regions, highlighting the significance of alpha modulation in the frontal region for cognitive control and the involvement of WM (Fairclough & Ewing, 2017; Palva & Palva, 2007; Pesonen et al., 2007; Sauseng et al., 2005; Zhu et al., 2021). In the study on bottom-up and top-down modulation of sensory processing in a cross-modal matching task, the authors observed a task-related reduction of alpha power in frontal and parietal areas. This led them to link the alpha band dynamics with the fronto-parietal attention network. They proposed that decreased alpha band power in frontal cortices reflects the origin of top-down modulation, whereas parietal alpha oscillations relate to intersensory (re-)orienting (Misselhorn et al., 2019). Other studies have shown that top-down processes from higher-order control regions in the brain, such as the frontal and prefrontal cortex, influence goal-oriented modulations of visual alpha oscillations during tasks that involve visual spatial attention and working memory (Wang et al., 2016). The differences in alpha power based on cognitive demands observed in our study in both analyzed brain regions among young adults and only in the medial frontal region in older adults may indicate that the cognitive mechanisms related to alpha oscillations are more effective in younger individuals, while in the older adults, increased cognitive demands exceed the capacity of these mechanisms. The study by Pergher et al. (2019) showed that, unlike younger adults, who typically show a decrease in alpha power with increased cognitive demand, older adults may display an increase in alpha power at higher difficulty levels. This may signal disengagement from the task rather than effective cognitive processing. The increase in alpha power among older adults at high task difficulty levels is also linked to fatigue, suggesting that as cognitive load rises, older individuals may become less engaged or more prone to mental fatigue. We observed minor age-related differences – not an increase in theta power at more difficult levels of the task, but only a lack of its reduction, and only in the central-parietal area.
Changes in brain activityFirstly, the limited impact of training on improving performance in the trained task may lead to doubts about the training's ability to change brain activity (theta and alpha power in this study). However, some studies have reported changes in brain activity due to cognitive training being observed even when there were no accompanying improvements at the behavioral level. In a study by Brehmer et al. (2011), although there was no evidence of improved WM capacity on tasks conducted in the scanner after progressive working memory training, this training did lead to reduced activation in the right dorsolateral prefrontal, right superior temporal, and bilateral occipital cortices under higher WM demand. The authors pointed out that this pattern of changes suggests intervention-related increases in neural efficiency. In another study, Miró-Padilla et al. (2020) examined whether training in n-back tasks can improve performance in the Paced Auditory Serial Addition Test (PASAT) and found no behavioral transfer effect. However, the training led to reduced activation in the front part of the brain, known as the anterior dorsolateral prefrontal cortex (DLPFC; BA 9/46), during the PASAT, which the authors interpret as a neural transfer effect. Also, a one-year longitudinal study examining the multi-domain CT effect on three higher cognitive networks in healthy older adults proved to have maintained or increased functional connectivity within all three networks. At the same time, significant improvement occurred in only 2 of the ten cognitive performance indicators considered (Cao et al., 2016). These results allow us to infer that cognitive training can induce significant neuronal changes that may not always manifest as improved cognitive performance.
Importantly, all the significant changes we observed did not depend on the study group. This result suggests that we are observing the retest effect, rather than the effects attributed to training interventions. The retest effect (also: practice effect, testing effect) indicates improvement in test performance when individuals retake the same or a different cognitive ability test under similar conditions. This effect is common in studies that measure cognitive function repeatedly and is considered a factor that biases the results obtained and conclusions drawn (Duff et al., 2012; Scharfen et al., 2018). However, it is also noted that specific cognitive mechanisms – such as learning, developing strategies and skills, and optimizing the allocation of cognitive resources – contribute to the retest effect. Therefore, this effect is also regarded as a manifestation of plasticity (Hartman et al., 2019; Nguyen et al., 2015; Scharfen et al., 2018; Wilson et al., 2018; Yang, 2011).
As for the observed changes, as expected, theta power in general increased at the post-test compared to the pre-test. These changes clearly depend on the task difficulty level. In contrast, their dependence on age remains vague.
The increase in theta power was greater for the more demanding versions of the task (2- and 3-back) in the frontal-midline area or occurred only for these more difficult versions in the central parietal area. Hence, the increase in theta power occurred for those levels of task difficulty for which theta was significantly lower initially. This indicates that, due to the practice effect, executive control involvement increased for tasks where we initially observed mental overload and reduced neural efficiency of cognitive control processes (Arnau et al., 2021; Puma et al., 2018; Sweller, 1988). We can attribute this increase to more effective engagement of processes relevant to the performed task as a result of acquired proficiency and the elimination of the need to allocate a portion of cognitive resources to learning and maintaining the task rules (additionally, more difficult for the 2- and 3-back versions than for the 1-back). The maintenance and ongoing implementation of newly learned task rules primarily requires proactive control, while executing the n-back involves responding correctly to the stimuli presented, which is a form of reactive control. With retest learning, the requirements of proactive control have been reduced, leaving more resources for reactive control, which is associated with greater theta enhancement (Eisma et al., 2021). At the same time, we did not observe a significant decrease in theta power for the easiest version of the task, as we expected. This means that even at the lowest WM load, performance on the n-back task does not automate so much as to considerably reduce the need for cognitive control.
Regarding the role of age, some indications can be interpreted with particular caution as supporting greater benefits of retest learning in older than young adults. Only in the group of older adults did the increase in frontal midline theta power in the post-test achieve a level close to statistical significance. Moreover, in the post-test, theta power associated with higher task difficulty in older adults no longer remained lower than at the easiest task level. This means that in older adults, neural processes of cognitive control were involved to the same extent, regardless of the level of cognitive demands, and the disengagement associated with excessive demands disappeared. This result may suggest positive changes in the brain activity of older adults, consistent with predictions based on the compensatory importance of increased executive control and associated enhanced involvement of prefrontal and parietal regions during cognitively demanding tasks, as assumed by the CRUNCH hypothesis (Reuter-Lorenz & Cappell, 2008). Finally, in the post-test, older and young adults no longer differed in terms of theta power. An analysis of the mean values for theta power shows that the absence of age-related differences was due to a general increase in theta power among older adults across all levels of task difficulty and in both brain regions considered. In contrast, young adults exhibited no clear changes in theta power. We observed both its increases and decreases depending on the brain area and task difficulty. However, these changes did not form any consistent pattern. At the same time, the lack of statistically significant results on the changes described above, both in older and young adults, precludes conclusions based on them. It can only sensitize us to observe such trends, consistent with predictions based on the CRUNCH hypothesis in subsequent studies.
In contrast to theta, alpha power had no significant changes, indicating that the retest effect was stronger for neuronal mechanisms associated with theta than alpha. This observation may be explained by a tighter relationship between the cognitive processes engaged during the n-back task performance and theta than alpha oscillations. The n-back task requires continuous selection and execution of responses to incoming stimuli (matching) according to changing criteria (replacing and shifting) (Chen et al., 2008). These are requirements consistent with cognitive processes that are associated with theta oscillation. Theta brainwaves are linked to reactive control when responding to stimuli and the updating of mental representations, especially when attention must shift to new information or changes in the environment (Cavanagh & Frank, 2014; Clements et al., 2021; Eisma et al., 2021; Gratton, 2018; Liegel et al., 2022). Theta power increases when making difficult externally-driven choices, while it does not show a similar increase for internally-driven decisions (Pierrieau et al., 2022). Additionally, the theta band plays a role in continuous processing, which involves both maintaining and manipulating information (Itthipuripat et al., 2013; Pesonen et al., 2007; Rodriguez-Larios et al., 2020).
On the other hand, alpha waves are also linked to WM and executive control, but in a more generalized manner. A decrease in alpha power typically indicates enhanced information flow efficiency in the brain region where it occurs (Wang et al., 2016) and increased recruitment of attentional resources (Gajewski & Falkenstein, 2014). The role of enhanced alpha activity in the frontoparietal network is significant for sustaining the neuronal representation of memorized items (Clements et al., 2021; Gratton, 2018; Rodriguez-Larios et al., 2020). However, the n-back task requires continuous updating of memory representations, which brings to light another phenomenon: retrieval-associated alpha suppression (Clements et al., 2021; Palva & Palva, 2007). This phenomenon, however, is less closely related to the n-back task than the ongoing processing and updating of representations in response to new stimuli, which involves theta waves.
The only difference we observed for alpha in the post-test compared to the pre-test was the disappearance in older adults of the dependence of its power on task difficulty. In the older adult group, increased task difficulty were no longer associated with a decrease in alpha power. We found this pattern, present in both age groups at the pre-test and maintained in young adults at the post-test, to be adaptive to increasing cognitive demands (Gajewski & Falkenstein, 2014; Pergher et al., 2019; Wang et al., 2016). Its disappearance in older adults as a retest effect can be attributed to a reduction in the involvement of the controlling function of attention (proactive control) in the face of the already well-established knowledge of the task rules. Coupled with the lack of significant improvement in older adults' task performance in the post-test, this lack of top-down attentional modulation in the face of changing cognitive demands should be considered a maladaptive phenomenon.
Thus, while we observed some changes (differences between pre-test and post-test) in theta oscillations in older adults, which can be considered beneficial, the opposite observations apply to alpha oscillations. Thus, the retest effect leads to some refinement of neuronal processes closely related to the task the older adult faced but not processes that are more generally related to the task's requirements. Consequently, the retest effect refines (to some extent) specific neuronal processes related to the task that older adults are familiar with but not those more broadly applicable to the task's requirements.
Limitations and future directionsThe current study was not free of limitations. First, in the study, we only included a passive control group. In contrast, it would have been optimal to incorporate both a passive and an active control group, which was our initial intention. The WM training we introduced was relatively short, involving 12 sessions delivered over 4 weeks. It is difficult to recruit and maintain a group of study participants for a longitudinally implemented study; nevertheless, the limited length of the intervention may have reduced its effects. The sample was also not fully balanced in terms of gender and years of education. We successfully balanced the experimental and control groups in terms of gender (the whole sample: χ2 = 0.191, p = .659; older adults: χ2 = 0.877, p = .349; young adults: χ2 = 0.031, p = .859) and level of education (the whole sample: χ2 = 1.516, p = .468; older adults: χ2 = 1.374, p = .503; young adults: χ2 = 1.146, p = .563). However, between young and older participants, a disparity in gender (χ2 = 4.796, p = .029) and years of education (t = - 2.952, p = .004) was present, but not in the educational level (χ2 = 4.407, p = .110). However, differences in education between generations are common in Polish society. Over the past few decades, the educational levels of Polish citizens have changed significantly, highlighting notable disparities between older and younger adults. This trend is supported by data from the National Population and Housing Census 2021, provided by the Central Statistical Office of Poland (Statistics Poland, 2022). Finally, older adults scored significantly lower than young participants on Raven's test (t = - 6.533, p < .001). However, it aligns with established knowledge about age-related changes in fluid intelligence.
As regards directions for further research, as we indicated in the limitations, it would be worthwhile to extend the length of the intervention time. On the other hand, in our study, training (i.e., repetitive practice of performing a task) appeared to have an effect only at the behavioral level, while a retest effect was revealed at the neuronal level. Moreover, given that the n-back task, already at the lowest level of difficulty implemented in the study, proved to be more challenging for older than young adults, it would be worthwhile to be able to compare brain activity in the two age groups during cognitive activities that place comparable demands on them. An effective method may involve tasks that can be continuously adjusted in complexity and tailored to suit each participant's cognitive abilities or difficulty thresholds (Kim et al., 2021). Finally, the distinct findings regarding changes at the behavioral level and at the level of neural activity suggest the need for a deeper understanding of the links and discrepancies between these two types of training/retest learning effects.
ConclusionsThe study aimed to evaluate the effects of WM training at the behavioral level (cognitive performance) and the level of neural activity (theta and alpha power), taking into account differences between older and young adults. Since the study's context was the CRUNCH hypothesis and the STAC-R model, we anticipated cognitive improvement in both age groups, with an increase in theta power and a decrease in alpha power in older adults in the prefrontal and parietal regions, demonstrating enhanced cognitive control. At baseline, older adults manifested poorer cognitive performance (lower d' score) and less optimal neural engagement (lower theta power in frontal and parietal regions). This result indicates limited potential for improving WM functioning in older adults compared to young adults. At the behavioral level, we found a positive, significant effect of WM training on cognitive performance in young adults, while there were no significant changes in older adults. At the level of neuronal activity, we observed not a training effect but a retest effect. Thus, what proved to be crucial was familiarity with the task, i.e., its rules, stimulus presentation, and response, rather than regular training in its performance, with difficulty increasing accordingly to the level of performance. The retest effect was revealed primarily for theta oscillations in the older adult group, in which there was an increase in theta power with higher task demands and equalization of theta power of older and younger persons in the post-test. These changes can be considered positive, and these results are consistent with the CRUNCH hypothesis of a compensatory role for increased executive control involvement. On the other hand, for alpha oscillations, the retest effect was negligible, and its only subtle manifestation observed in older adults was a reduction in the dependence of alpha power on task difficulty, which should be considered a rather maladaptive phenomenon. Nevertheless, given the overall study findings, it can be concluded that although the behavioral effects of training are stronger in young adults, the changes in neuronal activity resulting from the retest learning effect are more marked in older adults.
During the preparation of this work the author(s) used Grammarly in order to grammar check and correction. After using this tool/service, the author(s) reviewed and edited the content as needed and take(s) full responsibility for the content of the publication.
We have no known conflict of interest to disclose.
However, the results in this group are more favorable when the study considers a broader spectrum of interventions (cognitive stimulation, cognitive rehabilitation) and incorporates non-cognitive outcomes, such as quality of life, mood, and behavior (Folkerts et al., 2017; Garcia-Casal et al., 2016; Yun & Ryu, 2022).
It is worth adding that intensified cognitive control and increased memory load may also be associated with alpha enhancement, but only if the cognitive activity is intrinsic and does not require responding to stimuli (Benedek et al., 2014; Gratton, 2018; Jensen et al., 2002; Magosso et al., 2019; Xie et al., 2016).
articles
