


Background/Objective: The aim was to evaluate the evolution of depressive symptoms and to explore the influence of physical activity (PA) practice during the home confinement due to the COVID-19 outbreak in Spain. Method: Information was collected from 595 confined participants who reported personal and contextual information, depressive symptoms and PA levels at four time points. Results: The changes in depressive symptoms were analyzed using a linear mixed model with cubic splines. Results showed a significant increase, with a significant rise between T1 and T2 (OR = 2.38, 95% CI = 1.83-3.10). It continued growing until T4 (OR = 2.93, 95% CI = 1.97-4.38). A negative relationship was observed between the increase in depressive symptoms and moderate-to-vigorous physical activity (MVPA) levels, with a significant slope up to 4 hours of MVPA per week (OR = 0.51, 95% CI = 0.29-0.90) that tended to increase until 16 hours per week of MVPA (OR = 0.41, 95% CI = 0.20-0.87). Conclusions: Results from a partition model showed that moderate intensity of PA could be enough to prevent an increase of depressive symptoms during home isolation.
Antecedentes/Objetivo: El objetivo fue evaluar la evolución de los síntomas depresivos y explorar la influencia de la práctica de actividad física (AF) durante la fase de confinamiento domiciliario de la población española como consecuencia de la enfermedad del coronavirus 2019 (COVID-19). Método: Participaron 595 personas confinadas que informaron de su situación personal, los síntomas depresivos y la AF en cuatro momentos de medida. Resultados: Los cambios en los síntomas depresivos analizados con splines cúbicos a partir de modelos lineales mixtos, mostraron un incremento significativo, con una subida importante entre el T1 y el T2 (OR=2,38, 95% CI=1,83-3,10), para luego seguir incrementándose de manera más lenta hasta el T4 (OR=2,93, 95% CI=1,97-4,38). Se observó una relación inversa entre el incremento de los síntomas depresivos y los niveles de actividad física moderada-vigorosa (AFMV) semanal, con una pendiente importante hasta las cuatro horas de AFMV a la semana (OR=0,51, 95% CI=0,29-0,90) que tiende a disminuir hasta las 16 horas/semana AFMV (OR=0,41, 95% CI=0,20-0,87). Conclusiones: Se probó un modelo de partición que mostró que la AF de intensidad moderada podría ser suficiente para prevenir un incremento de los síntomas depresivos en situación de confinamiento.
The World Health Organization (WHO) declared on March 11th, 2020 the public health emergency caused by the new Coronavirus (COVID-19) as an international pandemic. To address this serious and exceptional situation, the Government of Spain declared on March 14th the state of alarm to manage the health crisis caused by the COVID-19. This law imposed a strict isolation of the entire Spanish population at their homes.Thus, freedom of movement was limited to basic activities such as buying food and basic products or going to health centres. This situation extended for 50 days.
In addition to the physical damage, COVID-19 could also have a serious impact on the mental health of the population for several reasons. In a systematic review addressing the relationship between COVID-19 and mental health, Rajkumar (2020) suggests that symptoms of anxiety and depression (16-28%) and self-reported stress (8%) are common psychological reactions to the COVID-19 pandemic, and that a number of individual and structural variables moderate this risk. In this review, 28 articles were selected, and only a minority (n=4) could be genuinely labelled as original research. The four studies were conducted using a cross-sectional and observational design and no longitudinal studies were detected. Five general topics were identified in this review, but it did not include any studies that specifically addressed the consequences of home confinement on the populations mental health.
As far as specific therapeutic strategies are concerned, the proposals include the following: (a) the development of teams of qualified specialists to address emotional distress (Duan & Zhu, 2020), (b) the training of community health workers in basic aspects of mental health care (Duan & Zhu, 2020), (c) the use of online surveys to assess the extent of mental health problems (Liu, Li et al., 2020), (d) the development of online materials for mental health education (Liu, Yang et al., 2020), (e) the provision of online counselling and self-help services (Liu, Li et al., 2020), (f) the use of structured charts as a form of asynchronous consultation in tele-psychiatry (Xiao, 2020), (g) the development of synchronous telemedicine services for diagnostic and counselling purposes (Zhou et al., 2020), and (h) the need to make online mental health services accessible to people from lower socioeconomic backgrounds (Yao et al., 2020). Consequently, the potential impact of physical activity (PA) on the populations mental health was not considered.
According to Qiu et al. (2020), there were three significant moments that could have caused panic in the population during the COVID-19 pandemic: (1) the official confirmation of person-to-person transmission of COVID-19 (declared on January 20th, 2020); (2) the strict confinement of Wuhan (January 22th, 2020); and (3) the announcement by the World Health Organization (WHO) that the new Coronavirus was an international public health emergency (January 31th, 2020). Regarding the quarantine, Brailovskaia and Margraf (2020) point out that some people experienced the restrictions on daily life as a heavy burden. This study addresses the second of these moments: the effects of quarantine on depressive symptoms. How have these 50 days of strict confinement affected the mental health of the Spanish population? This is a key public health question that deserves to be investigated since little is known about how depressive symptoms evolve due to strict confinement based on longitudinal data.
On the other hand, it is believed that alternative interventions, such as PA, can be valuable for the confined population. There is a range of treatments available for depression, including psychotherapy, medication programs, and psychoeducation. However, it should be noted that these interventions require a significant investment of time and money for individuals and for the health system, and have offered very diverse outcomes (Khan et al., 2012).
A recent review of longitudinal studies has shown a reduction in the likelihood of the onset of depression through PA practice (Mammen & Faulkner, 2013). Although there is strong evidence of a protective effect of PA against depression, results vary in duration and intensity (Currier et al., 2020). With respect to duration, studies have reported that, per week, any PA, compared to sedentary behaviour, between 20 and 150minutes, and between 120 and 420minutes confer mental health benefits (see Mammen & Faulkner, 2013; Teychenne et al., 2008). The World Health Organization WHO (2010) recommends at least 150minutes per week of moderate (MPA) or 75minutes of vigorous (VPA) PA, or 150minutes of a combination of both (MPA and VPA) to maintain physical and mental well-being. In a recent study, Currier et al. (2020) found that men who completed at least 150minutes/week of MPA were less likely to have symptoms of moderate/severe depression. Duration of activity was inversely associated with these symptoms. However, little is known about how PA relates to depressive symptoms in confined situations, given the limitations of confined situations that would make it difficult to maintain an adequate level of PA.
Consequently, the available scientific literature on confinement has emerged from only a few affected countries, and may not reflect the experience of people living in other parts of the world (Rajkumar, 2020). On the other hand, it is necessary to know how mental health and, in this case, depressive symptoms in the confined population evolved over the time of isolation. Likewise, it is estimated that alternative interventions, such as PA, may be valuable for the confined population. However, in an isolation situation it may be complicated to maintain active life habits or reach an adequate level of PA intensity.
Based on the aforementioned, this study set out two fundamental objectives: (1) to measure the prevalence and severity of depressive symptoms in Spanish confined people by collecting longitudinal data that allow to assess their changes, and (2) to provide a concrete guide for PA in order to face this challenge efficiently and effectively, based on (a) the WHO recommendations (150minutes per week of MVPA), (b) the relationship slope between depressive symptoms and MVPA (hours per week of maximum slope, and linear association), and (c) the relationship (slope) between depressive symptoms and MPA and VPA independently, and to be able to determine the most appropriate intensity of PA for people in confinement.
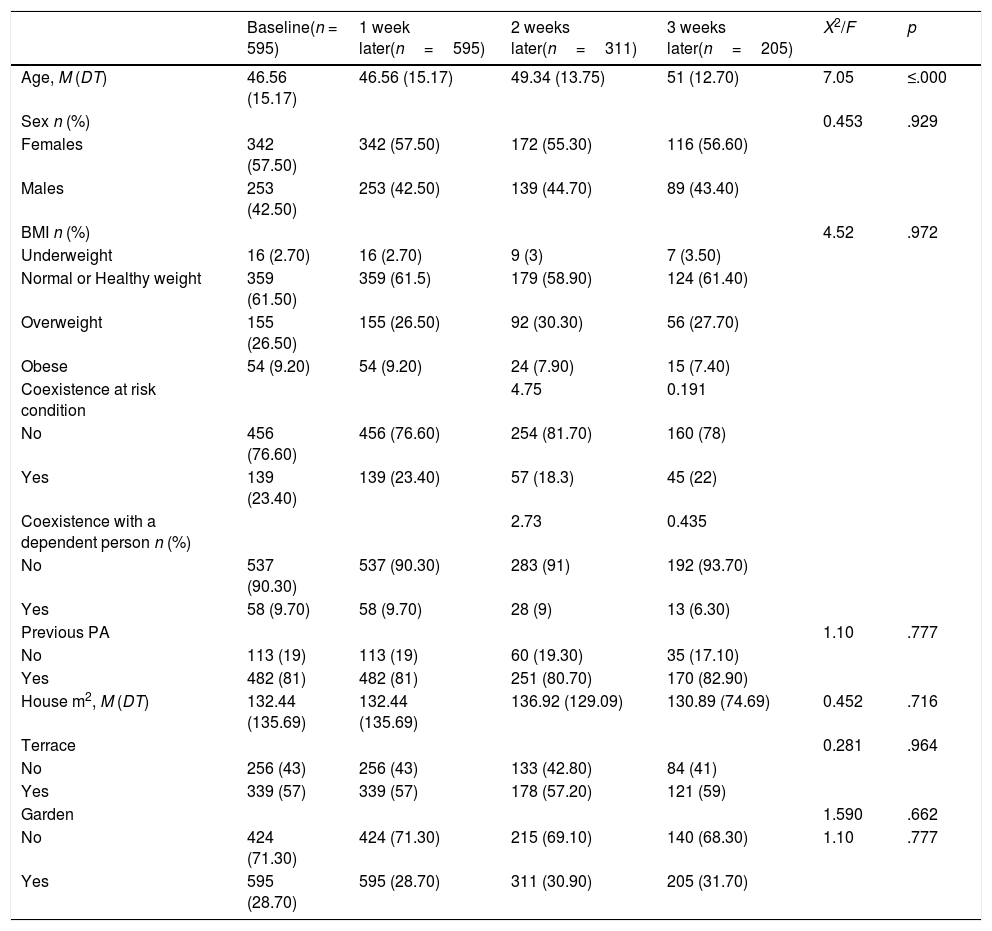
MethodParticipantsThe sample consisted of 595 participants (342 females and 253 males), aged between 18 and 84 years (M=45.60, SD=15.17), from 17 Spanish Autonomous Regions. Table 1 presents the participants characteristics during the weekly follow-up while in confinement on each of the measurement waves. They did not change significantly between the first and the last wave (all p> .05), except in the age: older individuals stayed longer in the study.
Participants characteristics during the weekly follow-up while in confinement.
| Baseline(n = 595) | 1 week later(n=595) | 2 weeks later(n=311) | 3 weeks later(n=205) | X2/F | p | |
|---|---|---|---|---|---|---|
| Age, M (DT) | 46.56 (15.17) | 46.56 (15.17) | 49.34 (13.75) | 51 (12.70) | 7.05 | ≤.000 |
| Sex n (%) | 0.453 | .929 | ||||
| Females | 342 (57.50) | 342 (57.50) | 172 (55.30) | 116 (56.60) | ||
| Males | 253 (42.50) | 253 (42.50) | 139 (44.70) | 89 (43.40) | ||
| BMI n (%) | 4.52 | .972 | ||||
| Underweight | 16 (2.70) | 16 (2.70) | 9 (3) | 7 (3.50) | ||
| Normal or Healthy weight | 359 (61.50) | 359 (61.5) | 179 (58.90) | 124 (61.40) | ||
| Overweight | 155 (26.50) | 155 (26.50) | 92 (30.30) | 56 (27.70) | ||
| Obese | 54 (9.20) | 54 (9.20) | 24 (7.90) | 15 (7.40) | ||
| Coexistence at risk condition | 4.75 | 0.191 | ||||
| No | 456 (76.60) | 456 (76.60) | 254 (81.70) | 160 (78) | ||
| Yes | 139 (23.40) | 139 (23.40) | 57 (18.3) | 45 (22) | ||
| Coexistence with a dependent person n (%) | 2.73 | 0.435 | ||||
| No | 537 (90.30) | 537 (90.30) | 283 (91) | 192 (93.70) | ||
| Yes | 58 (9.70) | 58 (9.70) | 28 (9) | 13 (6.30) | ||
| Previous PA | 1.10 | .777 | ||||
| No | 113 (19) | 113 (19) | 60 (19.30) | 35 (17.10) | ||
| Yes | 482 (81) | 482 (81) | 251 (80.70) | 170 (82.90) | ||
| House m2, M (DT) | 132.44 (135.69) | 132.44 (135.69) | 136.92 (129.09) | 130.89 (74.69) | 0.452 | .716 |
| Terrace | 0.281 | .964 | ||||
| No | 256 (43) | 256 (43) | 133 (42.80) | 84 (41) | ||
| Yes | 339 (57) | 339 (57) | 178 (57.20) | 121 (59) | ||
| Garden | 1.590 | .662 | ||||
| No | 424 (71.30) | 424 (71.30) | 215 (69.10) | 140 (68.30) | 1.10 | .777 |
| Yes | 595 (28.70) | 595 (28.70) | 311 (30.90) | 205 (31.70) |
This is a four-wave longitudinal study of data collection on depressive symptoms in a COVID-19-confined population in Spain. Participation was requested at four different times during the confinement (Fig. 1). The most complicated phase of the confinement began on March 14th, 2020 and ended on May 4th, 2020. The first call for participation was made on March 18th and information was collected over the next six days (1st wave). The second call was made on April 1st and information was collected over the next six days (2nd wave). The third call was made on April 9th and information was collected over the next six days (3rd wave), and the last call for participation was made on April 17th and information was collected over the next six days. Due to the drop in the number of participants, it was decided not to make any more data collections. Participation was voluntary and participants were requested to complete a self-reported, online questionnaire. Before completing the questionnaire, participants had to read the instructions carefully and were informed that the survey was anonymous. It took about ten minutes to complete the questionnaire at the beginning of the study and at the follow-ups. For a size of the universe of 47,100,396 people (Spanish population in the year 2020), considering 50% heterogeneity, 5% error margin and 95% confidence level, the number of participants needed was 385, something that is true for the 1st and 2nd wave. In the third wave, the margin of error rose to 5.60% and in the fourth wave to 6.80%. Taking into account the specific and difficult-to-control circumstances where this research was conducted, and its objectives, a non-probabilistic sampling method called "snowball" was used. This type of sampling is frequently used to identify potential subjects in studies where participants are difficult to find, as in the present case where the entire population was confined at their homes. Information asking for participation was sent to the entire potential population through social networks (Facebook, YouTube, WhatsApp, Messenger, and Twitter) and social media (newspapers, radio, and television). One of the main disadvantages of this type of sampling is that the representativeness of the sample is not guaranteed. However, the objectives of this study are not descriptive, but seek to measure the prevalence and severity of depressive symptoms in confined Spanish people. To this aim, longitudinal data was collected to analyse their changes and provide a concrete basis of PA to meet this challenge efficiently and effectively. We understand that the sample to be studied should have those characteristics that allow to address the objectives set. However, it may not necessarily be representative of the population, in the statistical sense of the term (Rothman, 2014). This study was approved by the Research Ethics Committee of the University where the study was conducted. Also, participants gave their informed consent after reading the objectives and instructions of the study in the first page of the questionnaire.
Measures and instruments. Timing of data collection (waves; dashed line) and growth rate of the pandemic in Spain (Official data of the Government of Spain, retrieved from https://cnecovid.isciii.es/covid19/#declaraci%C3%B3n-agregada).")
Personal and contextual characteristics. At the beginning of the questionnaire, information was collected on sex, age, height, weight, PA practice before confinement, coexistence with people at risk of death if they contracted COVID-19, coexistence with disabled people, square meters (m2) of the house, and the possibility of going out to a terrace or garden, since they could be influencing the relationship between PA and depressive symptoms in a confined situation.
International Physical Activity Questionnaire (IPAQ). This instrument, which was developed to monitor PA and inactivity (Craig et al., 2003), has demonstrated acceptable psychometric properties to monitor PA levels in adults from different settings, and it is as accurate as other self-administered questionnaires. In the present study, the short version Slast 7 days was used (Craig et al., 2003). It provides information about the time participants spend performing PA at three levels of intensity: walking, moderate PA (MPA) and vigorous PA (VPA), and time spent doing sedentary activities (i.e., inactivity). To measure PA intensity, METs are usually used, which is the unit of measurement of the metabolic index with the following equivalents: walking=3.30 METs, MPA=4 METs, and VPA=8 METs (Ainsworth et al., 2000). Thus, these values were used to define the following quantitative variables: MPA METs - minutes/week=4 * minutes of MPA day * days a week MPA; VPA METs-minutes/week=8 * minutes of VPA day * days a week VPA; MVPA METs - minutes/week=sum of MPA+VPA METs-minutes/week. To measure PA levels during the confinement, the Spanish short version of the IPAQ (www.ipaq.ki.se) was used, which can be used from 15 years of age (Booth, 2000). Silsbury et al. (2015) reported that this version showed excellent rates of repeatability during one week (r=.62, p< .001; and 2 weeks (r=.74-.79, p< .001). Furthermore, these authors added that there are no significant differences in repeated measures for separate intensities of PA (r=0.74-0.84). In the present study, the hours of MPA and VPA per week were also used separately and jointly, to assess the amount of PA in relation to the intensity.
Depressive symptoms were measured using a six-item self-reported questionnaire that was adapted by Kandel and Davies (1982), where depressive symptoms experienced in the past 12 months are assessed (Choi et al., 1997). The questions refer to social activities that can affect health. For each question (e.g., "⬦I feel too tired to do things") it should be indicated whether the situation occurred never (1), rarely (2), sometimes (3), or often (4). Cronbach's alpha for the whole scale was .85. The responses to the items are added to evaluate depressive symptomatology with an overall score ranging from 6 to 24 points. These scores were increased by 10 to produce a new range of 16 and 34 points. Subjects who achieve a score of 29 or higher are defined as having noticeable depressive symptoms.
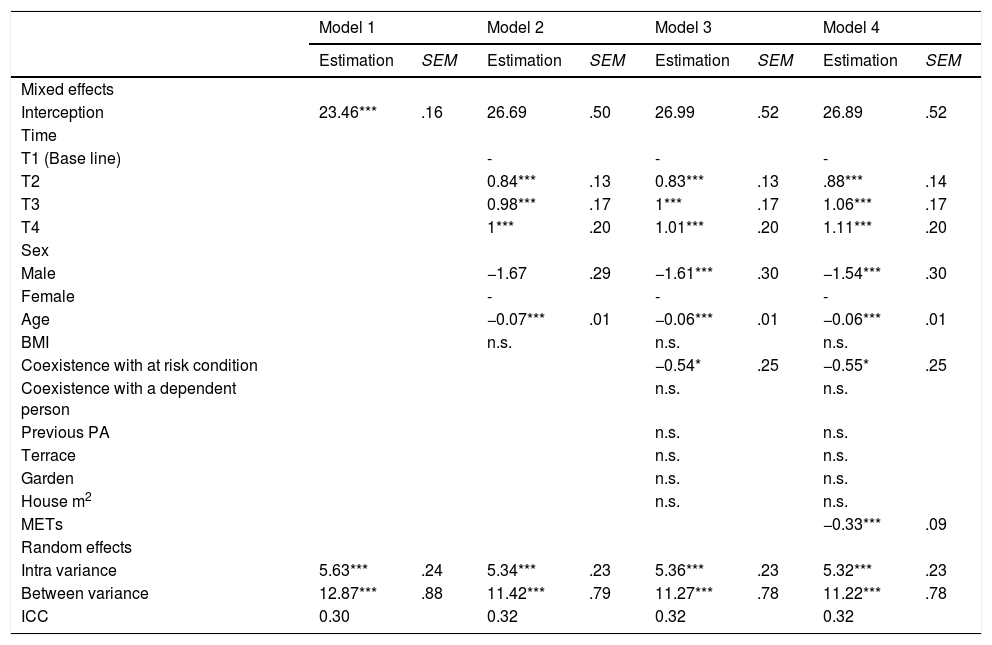
Data analysisMultilevel modeling was chosen for its suitability to the analysis of repeated measures, since the standard errors of the estimated model parameters are not underestimated, reducing the risk of inflation of type I errors, and missing data is not a problem (Field, 2013). This modelling technique examines the pattern of change, takes into account the correlation between measurement occasions for each participant and estimates the error-covariance matrix of the repeated measures. The outcome variables (level 1, N=1,706) were nested in the participants (N=595, baseline). Linear mixed model procedures with maximum likelihood estimates (ML) were carried out following the procedures of Snijders and Bosker (2004). First, an intercept only model (null model) was adjusted for depressive symptoms, taking the variance for level 1 (repeated measures), level 2 (participants). The amount of variance explained was calculated using intraclass correlation coefficients (ICC), which identifies the proportion of variance and validates the relevance of using multilevel analysis (Hofmann et al., 2000). Analyses were continued by fitting hierarchical random-intercept and two-level models for each of the outcome variables.
The second model included the predictors: Linear time (1 = baseline/T1, 2=T2, 3=T3 and 4=T4), Sex (1 = male, 2 = female) and BMI. The third model also included the variables of coexistence with people at risk due to the COVID-19, coexistence with dependent people, PA prior to home confinement, square meters of the house, having a terrace and having a garden in the house. The fourth model also included the minute/week METs. For the sake of parsimony, the variables that yielded non-significant results in all the model estimates were excluded from the final model. Variables were included one by one using a surge modelling strategy (West et al., 2007). Each model was compared to the intercept only model using the Akaike information criterion (AIC) and Bayesian information criterion (BIC, lower indices indicate a better fitting model). To precisely determine the association between depressive symptoms and PA (Currier et al., 2020), cubic splines were modelled using all variables that were significant as control variables. The relationship between changes in depressive symptoms and weekly hours of MVPA was assessed using restricted cubic spline models with four knots to produce a smoothly adjusted curve. An isotemporal substitution model was calculated (Mekary et al., 2009), where MVPA was substituted while total PA was kept constant. As with the previous analysis, restricted cubic spline models were adjusted (Currier et al., 2020). As the substitution model was not significant, a partition model was tested (Mekary et al., 2009). In this model, the coefficient for one activity type represents the effect of increasing this activity type while keeping the other activity types constant. Therefore, it represents the effect of "aggregating" rather than sub-creating an activity type. The statistical significance was set at p< .05 on both sides. All statistical analyses were performed using Stata/MP version 15.0 (StataCorp LP, College Station, TX, USA). The odds ratio (OR) is a measure of association between two variables. When the odds ratio is 1, it indicates no association between the variables. Values less than 1 indicate a negative association between the variables and values greater than 1 indicate a positive association between the variables. For example, when the odds ratio is less than 1 it is interpreted as high levels of PA are associated with lower probability of depressive symptoms (Figs. 3 and 4). On the contrary, when the odds ratio is greater than 1 it is interpreted that as the days of confinement increase the probabilities of depressive symptoms increase too. This, together with the cubic splines, which allow the establishment of precise cut-off points, will provide very useful information to address the objectives of this research. To facilitate the interpretation, the probabilities of depressive symptoms are presented in all figures (OR=vertical axis). In Fig. 2, on the horizontal axis, the four waves of measurement are shown, taking the first one as reference, which allows to determine how the probability of depressive symptoms evolves over time; in Fig. 3, the horizontal axis represents MVPA hours/week, taking as reference those who did not perform any weekly MVPA hour; in Fig. 4, the abscissa axis represents MPA hours/week, taking as reference those who did not perform any weekly MPA hour. In short, the probabilities of the population under confinement to show depressive symptoms with the weekly increase in confinement (Fig. 2), weekly hours of MVPA (Fig. 3), weekly hours of MPA (Fig. 4) are presented. This information will allow to establish risk rates and the possibilities of decreasing depressive symptoms according to precise indications of PA (the discontinuous lines show 95% CI).

. Note. The partition model was modeled by restricted cubic splines using a mixed linear model of repeated measures, adjusted for VPA hours/week, age, sex, measurement times and coexistence with people at risk for COVID-19.")
OR adjusted with 95% CI for the association of the MVPA hours/week with changes in depressive symptoms in people confined in Spain (COVID-19).
Note. The partition model was modeled by restricted cubic splines using a mixed linear model of repeated measures, adjusted for VPA hours/week, age, sex, measurement times and coexistence with people at risk for COVID-19.
.")
The results of the preliminary analysis (null model, 1), in Table 2, revealed that depressive symptoms varied significantly within and between participants. According to these estimates, the variability between participants represented 30% and the variability within participants the remaining 70%. In model 2, results showed that age, sex and time are significant, but not BMI. There is an increase in depressive symptoms while in isolation over time, and differences according to sex and age (i.e., women showed more depressive symptoms than men, and depressive symptoms were inversely related with age).
Linear mixed models of repeated measures.
| Model 1 | Model 2 | Model 3 | Model 4 | |||||
|---|---|---|---|---|---|---|---|---|
| Estimation | SEM | Estimation | SEM | Estimation | SEM | Estimation | SEM | |
| Mixed effects | ||||||||
| Interception | 23.46*** | .16 | 26.69 | .50 | 26.99 | .52 | 26.89 | .52 |
| Time | ||||||||
| T1 (Base line) | - | - | - | |||||
| T2 | 0.84*** | .13 | 0.83*** | .13 | .88*** | .14 | ||
| T3 | 0.98*** | .17 | 1*** | .17 | 1.06*** | .17 | ||
| T4 | 1*** | .20 | 1.01*** | .20 | 1.11*** | .20 | ||
| Sex | ||||||||
| Male | −1.67 | .29 | −1.61*** | .30 | −1.54*** | .30 | ||
| Female | - | - | - | |||||
| Age | −0.07*** | .01 | −0.06*** | .01 | −0.06*** | .01 | ||
| BMI | n.s. | n.s. | n.s. | |||||
| Coexistence with at risk condition | −0.54* | .25 | −0.55* | .25 | ||||
| Coexistence with a dependent person | n.s. | n.s. | ||||||
| Previous PA | n.s. | n.s. | ||||||
| Terrace | n.s. | n.s. | ||||||
| Garden | n.s. | n.s. | ||||||
| House m2 | n.s. | n.s. | ||||||
| METs | −0.33*** | .09 | ||||||
| Random effects | ||||||||
| Intra variance | 5.63*** | .24 | 5.34*** | .23 | 5.36*** | .23 | 5.32*** | .23 |
| Between variance | 12.87*** | .88 | 11.42*** | .79 | 11.27*** | .78 | 11.22*** | .78 |
| ICC | 0.30 | 0.32 | 0.32 | 0.32 | ||||
Note. Null model for depressive symptoms, taking the variance for level 1 (repeated measures) and level 2 (confined persons). In model 2 the predictors were included: Linear time (1 = baseline/T1, 2=T2, 3=T3, 4=T4), Sex (1 = male, 2 = female), age and BMI. Model 3 also included situational variables. Model 4 also included minute/week METs. SEM=Standard Error of Measurement. n.s=non-significant.
In model 3, which also included situational variables, it was observed that the only one that was significant was the coexistence with people at risk due to the COVID-19. In model 4, included METs minute/week, it was observed that this variable was inversely related to depressive symptoms. Comparing the estimates of the parameters of covariance of the null model (1) and model 4, the proportion of variance explained at each level was: (a) level 1 (variance within participants) 5.50%; and (b) level 2 (variance between participants) 12.80%.
Changes in depressive symptomsThe results of the cubic spline model (Fig. 2) showed the curve of depressive symptoms in the four waves of measurement. It can be observed how the probability of depressive symptoms increases as the weeks of isolation go, with a significant rise between T1 and T2 (OR=2.38, 95% CI=1.83-3.10), and then continues to increase more slowly until T4 (OR=2.93, 95% CI=1.97-4.38).
Relationship between depressive symptoms and MVPAFig. 3 shows how hours/week of MVPA were negatively associated with depressive symptoms. A significant slope is observed up to 4hours of MVPA per week (OR=0.51, 95% CI=0.29-0.90) that tends to decrease up to 16hours/week MVPA (OR=0.41, 95% CI=0.20-0.87). In the 150minutes/week of MVPA (recommended by the WHO) the results were the following: OR=0.56, 95% CI=0.32-0.98.
Since the isotemporal substitution model was not significant, a partition model was tested (Mekary et al., 2009). Fig. 4 shows how the coefficient for MPA, which represents the effect of increasing this type of activity while maintaining constant VPA, was significant. The associated probability, which was inversely related to depressive symptoms, was significantly higher for MPA. Therefore, for the same amount of moderate or vigorous PA, MPA was inversely associated, to a greater extent, to depressive symptoms. At the 150minute per week of MPA (recommended by the WHO) the results were as follows: OR=0.60, 95% CI=0.37-0.96.
DiscussionThe first objective was to analyze the changes in depressive symptoms in the Spanish confined population as a consequence of COVID-19. The results showed that in the third week of confinement the risk rate of increasing depressive symptoms affected 68% of the population. The risk continued to increase in the third and fourth week, but at a slower rate. In short, depressive symptoms increased throughout the confinement, being consistent with the results of the cross-sectional study of Huang and Zhao (2020) that observed a prevalence of depressive symptoms in 20.10% of the Chinese population as a consequence of COVID-19. However, such study did not specifically assessed the confinement of the population in their homes. In previous studies, it has been observed that social isolation is one of the variables most highly associated with depression (e.g., Serrano & Ferrer, 2001).
These changes in depressive symptoms were inversely associated with levels of PA performed in confinement (Objective 2). In the model 4 analyzed, METs were a significant predictor of depressive symptoms. In the present study, METs were calculated by means of a mathematical formula that ponders the contribution of the three dimensions of intensity in exercise: vigorous, moderate and light. However, in order to determine more precisely the contribution of the two dimensions with greater incidence on mental health, vigorous and moderate intensity levels (Currier et al., 2020), MVPA hours/week was modeled by restricted cubic splines using a mixed linear model of repeated measures, adjusted by significant covariates in previous analyses. The results showed that: (a) the 150minutes per week of MVPA (recommended by WHO) produced a significant effect in the reduction of depressive symptoms, and (b) the effects can be increased up to 18hours of weekly MVPA (OR=0.41, 95% CI=0.20-0.87). Confined individuals who performed at least four hours of MVPA per week were 49% less likely to report increases in depressive symptoms than those who did not perform PA. After four hours per week, the inverse relationship between depressive symptoms remained, but it was moderate. These results are consistent with previous studies in unconfined individuals, that showed general consensus on the beneficial effect of PA on depressive symptoms (Cecchini et al., 2017; Cecchini-Estrada et al., 2015; Mikkelsen et al., 2010) and life satisfaction (García-Hermoso et al., 2020). However, there is less agreement on the optimal duration and intensity of activity to achieve these benefits (Currier et al., 2020). Regarding duration, the results of the present study showed that the possibilities of increasing depressive symptoms in isolation decreased as the PA levels increased, reaching up to 16hours, and with a tendency to fall in a more linear dose-response model. However, the slope was more moderated from four hours per week. The difference with other studies that reported a Sceiling effect, with no additional benefit above it, may be related to the way depressive symptoms were measured, rather than to more specialized diagnostic instruments of depression.
The most appropriate PA intensity was tested using isotemporal substitution models, which were non-significant and were replaced by partitioning models (Mekary et al., 2009). Increasing moderate-intensity activity, while keeping vigorous-intensity activity constant, had a significant effect, but not the opposite. These results are contradictory to some previous studies that observed a greater impact of vigorous activity on depressive symptoms than moderate activity. For example, Pavey et al. (2013) observed that doing vigorous activity in addition to moderate activity had a stronger association with depression than moderate activity alone, but only for participants who had very high overall levels of PA. This may be a possible explanation for the results obtained in this study. In other words, the home confinement made difficult to carry out vigorous intensity activity on a regular basis and reach very high levels of VPA.
ConclusionsThe home confinement of the Spanish population as a consequence of the COVID-19 increased the probability of showing depressive symptoms. Nevertheless, PA can be a potentially useful strategy to reduce this risk. The promotion of PA is low-cost, and it can be done in confinement contexts. As noted in this study, its incidence does not depend on the size of the house, whether it has a garden or terrace or on levels of PA prior to isolation. The 150-minute per week of MVPA (recommended by the WHO) was beneficial for mental health and even the results showed that VPA is not necessary, since mental health can be effectively influenced by moderate-intensity PA. The findings also suggest that longer duration of PA has benefits above the minimum recommended level. This study has some limitations. The most important ones are related to the measurement instruments and to the disadvantage of not being able to use accelerometers. The impossibility of using other instruments to measure depression in a face-to-face way or to analyze the intermediation of positive mental health should also be pointed out (Teismann et al., 2019).
