
To better understand drivers of disease progression in non-alcoholic steatohepatitis (NASH), we assessed clinical and sociodemographic markers of fibrosis progression in adults with NASH.
Patients and methodsPhysician-reported patient demographics and clinical characteristics were utilised from the real-world Global Assessment of the Impact of NASH (GAIN) study. Factors associated with likelihood of fibrosis progression since NASH diagnosis were identified using a logistic regression model.
ResultsOverall, 2349 patients in Europe from the GAIN study were included; mean age was 54.6 years and 41% were women. Significant covariates included age, years since diagnosis, employment status, fibrosis stage at diagnosis, type 2 diabetes mellitus, hypertension, liver transplant and liver biopsy at diagnosis. Risk of progression was 1.16 (95% confidence interval 1.12–1.20; p<0.001) times higher for each additional year since NASH diagnosis and 5.43 (2.68–11.37; p<0.001) times higher when physicians proposed a liver transplant at diagnosis. Compared with full-time employed patients, risk of progression was 1.77 (1.19–2.60; p=0.004) times higher for unemployed patients and 3.16 (1.30–7.63; p=0.010) times higher for those unable to work due to NASH.
ConclusionsDisease duration, NASH severity and presence of other metabolic comorbidities could help to assess risk of progression in patients with NASH.
Para comprender mejor los factores que impulsan la progresión de la enfermedad en la esteatohepatitis no alcohólica (NASH), evaluamos los marcadores clínicos y sociodemográficos de la progresión de la fibrosis en adultos con NASH.
Pacientes y métodosSe utilizaron las características demográficas y clínicas de los pacientes informadas por los médicos del estudio de Evaluación Global del Impacto de NASH (GAIN) del mundo real. Los factores asociados con la probabilidad de progresión de la fibrosis desde el diagnóstico de EHNA se identificaron mediante un modelo de regresión logística.
ResultadosEn total, se incluyeron 2.349 pacientes en Europa del estudio GAIN; la edad media fue 54,6 años y el 41% eran mujeres. Las covariables significativas incluyeron edad, años desde el diagnóstico, situación laboral, estadio de fibrosis en el momento del diagnóstico, diabetes mellitus tipo 2, hipertensión, trasplante de hígado y biopsia de hígado en el momento del diagnóstico. El riesgo de progresión fue 1,16 (intervalo de confianza del 95% 1,12-1,20; p < 0,001) veces mayor por cada año adicional desde el diagnóstico de EHNA y 5,43 (2,68-11,37; p < 0,001) veces mayor cuando los médicos propusieron un trasplante de hígado. en el momento del diagnóstico. En comparación con los pacientes empleados a tiempo completo, el riesgo de progresión fue 1,77 (1,19-2,60; p = 0,004) veces mayor para los pacientes desempleados y 3,16 (1,30-7,63; p = 0,010) veces mayor para aquellos que no podían trabajar debido a a NASH.
ConclusionesLa duración de la enfermedad, la gravedad de NASH y la presencia de otras comorbilidades metabólicas podrían ayudar a evaluar el riesgo de progresión en pacientes con NASH.
Non-alcoholic fatty liver disease (NAFLD) is characterised by an excessive accumulation of fat in hepatocytes and remains the most common cause of liver disease, with a global prevalence of approximately 25% among adults.1–3 NAFLD is associated with obesity, insulin resistance, dyslipidaemia and hypertension,4,5 and may progress to non-alcoholic steatohepatitis (NASH), cirrhosis, liver cancer and death.3,6 Up to 20% of adults with NAFLD may be expected to develop NASH, and this proportion is even greater among those with chronic obesity and/or type 2 diabetes mellitus (T2DM).6,7 NASH is known to have a persistent negative impact on clinical morbidity, quality of life and mortality.6,8–10 In Europe, the disease burden and the economic impact of the disease are high.11
Fibrosis stage in individuals with NAFLD or NASH is associated with poor outcomes, including overall and liver-related mortality, liver transplantation and liver-related events.12–14 Furthermore, worsening fibrosis in patients with NAFLD/NASH has been associated with obesity and markers of insulin resistance, such as homeostasis model assessment insulin resistance (HOMA-IR), and presence of T2DM.15,16 Fibrosis staging, confirmation of NASH diagnosis and evaluation of disease progression is best achieved with liver biopsy, which bears risks and some limitations, and is often faced with hesitation by patients and clinicians.17 As such, the identification of simple and practical risk factors associated with fibrosis progression that can be easily measured and monitored in routine clinical practice would be beneficial for clinical decision-making.
A more clinically oriented approach has been investigated for some time, with non-invasive laboratory biomarkers, medical history and patient demographics most often identified as potential predictors of the presence of NASH or advanced fibrosis.15,16,18,19 While these studies have advanced clinical decision support, particularly in evaluating the potential value of conducting a liver biopsy in a given patient, few studies have examined the use of non-invasive biomarkers, patient demographics and clinical characteristics to evaluate the risk of disease progression over time, and furthermore, such markers have not been widely validated for this purpose in prospective trials.16 Risk factors for fibrosis progression identified in single-centre studies include presence of comorbidities such as hypertension, obesity and T2DM.16,20 In addition, an analysis of clinical and sociodemographic risk factors for fibrosis progression in United States (US) participants from the Global Assessment of the Impact of NASH (GAIN) study reported greater fibrosis progression among participants who had a longer time since NASH diagnosis, had obesity, and those who were current smokers, male and not in full-time employment.21
We aimed to build on previous analyses in adults with NASH in European countries and the US9,21 by characterising clinical and sociodemographic risk factors for fibrosis progression in patients in Europe using a large real-world patient sample from the GAIN study, to help inform patient management and clinical decision-making.
Materials and methodsThe GAIN studyThe design and methods of the multinational, retrospective and cross-sectional GAIN study have been reported previously.9 Adults in Europe and the US with confirmed NASH diagnosis at least 12 months before eligibility screening were eligible. In this retrospective patient chart review study, specialists completed a single electronic case report form for each patient at the date of consultation (i.e. the index date), with abstraction of medical records for said patient over the 12 months prior to the index date. Eligible patients were “recruited consecutively as they attended a clinical appointment by their treating physician, regardless of the reason for their consultation.”9
Confirmed NASH diagnosis was evaluated by physician review of the patient's medical chart and defined as: histologically confirmed NASH with fibrosis; laboratory evidence of advanced fibrosis in patients with metabolic syndrome risk factors (aspartate aminotransferase [AST]/alanine aminotransferase [ALT] ratio, NAFLD fibrosis score, BARD score and Fibrosis-4 score); or imaging evidence of advanced fibrosis and/or cirrhosis in patients with metabolic syndrome risk factors (by ultrasound, magnetic resonance imaging or computed tomography). All patients were classified as F0–F4 by physicians, with F4 being further classified into compensated and decompensated cirrhosis. This classification was performed for patients with a biopsy but also those diagnosed by biomarker or imaging. Specialists such as hepatologists, gastroenterologists, endocrinologists and diabetologists provided demographic and clinical information for participating patients. Patients could opt in to completing questionnaires regarding quality of life and medical costs. “The study protocol was approved by the Research Ethics Subcommittee of the Faculty of Health and Social Care within the University of Chester. The approval stipulated that the study was to be carried out in correspondence with regional and relevant guidelines, and the 1975 Declaration of Helsinki.”9
We sought to identify risk factors for disease progression specific to the European population, and thus limited this cohort to Europe-based GAIN study patients (from France, Germany, Italy, Spain and the United Kingdom). A similar publication examining risk factors from the US cohort of the GAIN study has also been developed.
Disease and outcome definitionsWe used physician-reported patient demographic and clinical characteristics measured at the time of consultation from the GAIN study (including age, sex, race/ethnicity, height, body mass index [BMI, both numerical and categorical], time since NASH diagnosis, alcohol consumption, smoking status and employment status), as well as record of liver biopsy at NASH diagnosis, fibrosis stage, comorbidities, weight loss in the previous 12 months, non-pharmacological treatments proposed at NASH diagnosis, and pharmacological treatment prescribed at diagnosis and still being received at consultation date.
At least two different records of fibrosis stage were required in order to determine any changes in fibrosis progression: at NASH diagnosis and at the study recruitment consultation visit. Patients were included in the analysis if they had a baseline fibrosis stage of F0–F4 compensated cirrhosis. Patients with missing responses for fibrosis progression or with F4 decompensated cirrhosis were excluded (as fibrosis progression was not possible from this point onward). Changes in fibrosis stage were classified as ‘progressed’, ‘regressed’ or ‘stable’ by the physicians. For the purposes of this analysis, ‘regressed’ and ‘stable’ were grouped together to capture the patients who had not progressed. Information related to the presence of comorbid conditions included number of comorbidities (numerical) and presence of the following conditions: obesity (by BMI or physician assessment); T2DM; cardiovascular disease; hypertension; and/or dyslipidaemia. Pharmacological interventions prescribed at NASH diagnosis (and still being received at consultation date) were categorised as lipid-lowering drugs, vitamin E, metformin, thiazolidinediones, sulfonylureas, glucagon-like peptide-1 receptor agonists, sodium-glucose co-transporter-2 inhibitors, dipeptidyl peptidase-4 inhibitors, ‘other anti-diabetic medications’ and ‘other medications’. Non-pharmacological treatments proposed at NASH diagnosis were classified as lifestyle modification, diet change, behavioural, bariatric surgery and/or liver transplantation. It should be noted that data on filled prescriptions were not available.
Statistical analysisDescriptive statistics summarised patient characteristics and model covariates, as previously described.21 In this study, odds ratios were calculated for variables in the univariable and multivariable models along with 95% confidence intervals. No imputation of missing responses was conducted and patients with missing responses for fibrosis progression (fibrosis stage recorded at two different time points) were excluded from the analysis.21 Multicollinearity was evaluated using scatter plots and Pearson moment correlation to evaluate relationships between covariates and remove redundant variables (independent variables should not be highly correlated with each other in a regression model). Variables with higher correlations (r>0.8) were removed to avoid bias and the final covariates were validated for multicollinearity using the variance inflation factor (Supplementary Table A4). Univariable and multivariable logistic regression models were developed to determine the likelihood of disease progression. Model development is described in the Supplementary Materials.
Patient and public involvement statementThis study used patient-reported outcomes in primary and secondary analyses. The research questions and outcomes were developed based on published available relevant work, and according to the expertise of the authors.
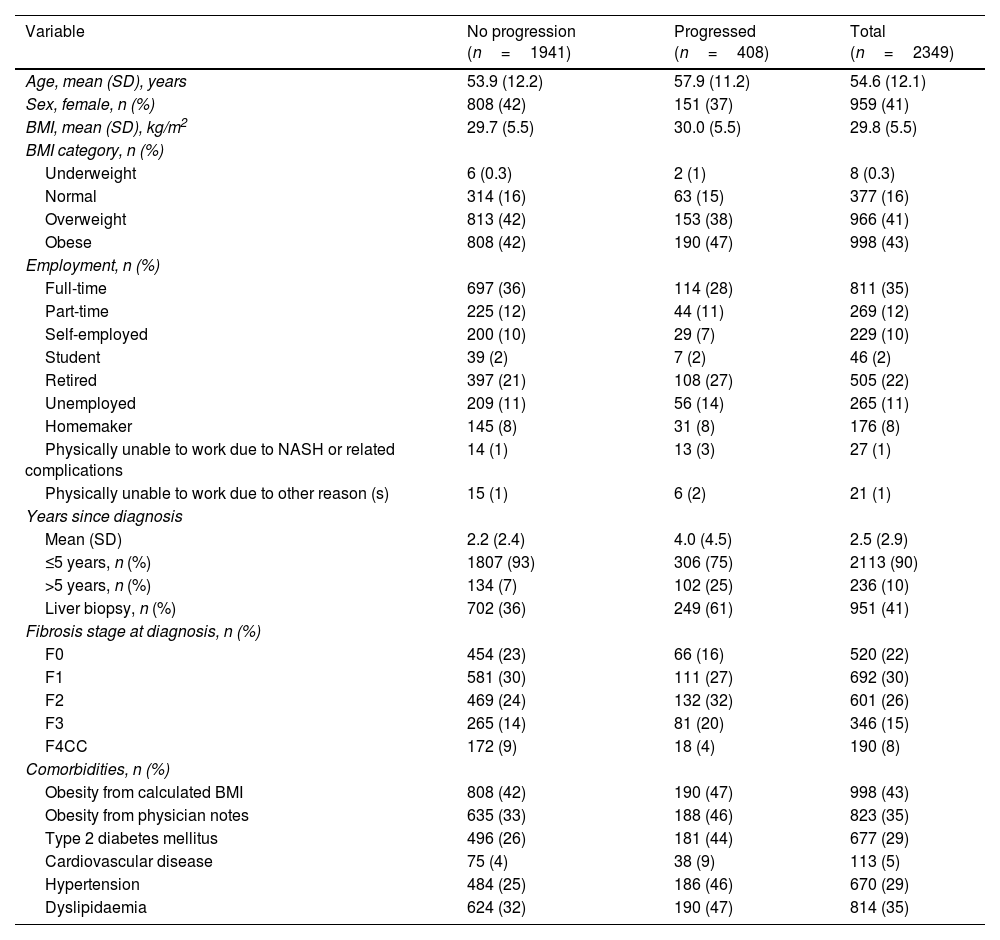
ResultsBaseline demographics and clinical characteristicsWe included 2349 patients in Europe from the GAIN study with at least two recorded fibrosis stages and no stage F4 decompensated cirrhosis at baseline (93% of the total GAIN study European cohort of 2533 patients). Overall, most patients did not have disease progression at follow-up (n=1941); 408 had progressed (Table 1 and online Supplemental Table A2). Substantially more patients who were diagnosed with NASH>5 years prior to follow-up were determined to have disease progression (43%) compared with those whose diagnosis was within 5 years (15%). The mean age for the overall European cohort was 55 years and mean time since diagnosis was 2.5 years (4.0 and 2.2 years for those with progression and no progression, respectively). Most patients were categorised as overweight or obese based on BMI (84%). One-quarter to one-third of patients had T2DM (29%), dyslipidaemia (35%) and/or hypertension (29%), and one-third had no comorbidities (32%), as reported by their treating physicians. Most patients were reported as having fibrosis stage F0–F2 at diagnosis (77%), and slightly fewer than half had liver biopsy at diagnosis (41%), although this varied between those with progression (61%) and those without progression (36%).
Baseline demographic and clinical characteristics of the European cohort.
| Variable | No progression (n=1941) | Progressed (n=408) | Total (n=2349) |
|---|---|---|---|
| Age, mean (SD), years | 53.9 (12.2) | 57.9 (11.2) | 54.6 (12.1) |
| Sex, female, n (%) | 808 (42) | 151 (37) | 959 (41) |
| BMI, mean (SD), kg/m2 | 29.7 (5.5) | 30.0 (5.5) | 29.8 (5.5) |
| BMI category, n (%) | |||
| Underweight | 6 (0.3) | 2 (1) | 8 (0.3) |
| Normal | 314 (16) | 63 (15) | 377 (16) |
| Overweight | 813 (42) | 153 (38) | 966 (41) |
| Obese | 808 (42) | 190 (47) | 998 (43) |
| Employment, n (%) | |||
| Full-time | 697 (36) | 114 (28) | 811 (35) |
| Part-time | 225 (12) | 44 (11) | 269 (12) |
| Self-employed | 200 (10) | 29 (7) | 229 (10) |
| Student | 39 (2) | 7 (2) | 46 (2) |
| Retired | 397 (21) | 108 (27) | 505 (22) |
| Unemployed | 209 (11) | 56 (14) | 265 (11) |
| Homemaker | 145 (8) | 31 (8) | 176 (8) |
| Physically unable to work due to NASH or related complications | 14 (1) | 13 (3) | 27 (1) |
| Physically unable to work due to other reason (s) | 15 (1) | 6 (2) | 21 (1) |
| Years since diagnosis | |||
| Mean (SD) | 2.2 (2.4) | 4.0 (4.5) | 2.5 (2.9) |
| ≤5 years, n (%) | 1807 (93) | 306 (75) | 2113 (90) |
| >5 years, n (%) | 134 (7) | 102 (25) | 236 (10) |
| Liver biopsy, n (%) | 702 (36) | 249 (61) | 951 (41) |
| Fibrosis stage at diagnosis, n (%) | |||
| F0 | 454 (23) | 66 (16) | 520 (22) |
| F1 | 581 (30) | 111 (27) | 692 (30) |
| F2 | 469 (24) | 132 (32) | 601 (26) |
| F3 | 265 (14) | 81 (20) | 346 (15) |
| F4CC | 172 (9) | 18 (4) | 190 (8) |
| Comorbidities, n (%) | |||
| Obesity from calculated BMI | 808 (42) | 190 (47) | 998 (43) |
| Obesity from physician notes | 635 (33) | 188 (46) | 823 (35) |
| Type 2 diabetes mellitus | 496 (26) | 181 (44) | 677 (29) |
| Cardiovascular disease | 75 (4) | 38 (9) | 113 (5) |
| Hypertension | 484 (25) | 186 (46) | 670 (29) |
| Dyslipidaemia | 624 (32) | 190 (47) | 814 (35) |
BMI, body mass index; CC, compensated cirrhosis; NASH, non-alcoholic steatohepatitis; SD, standard deviation.
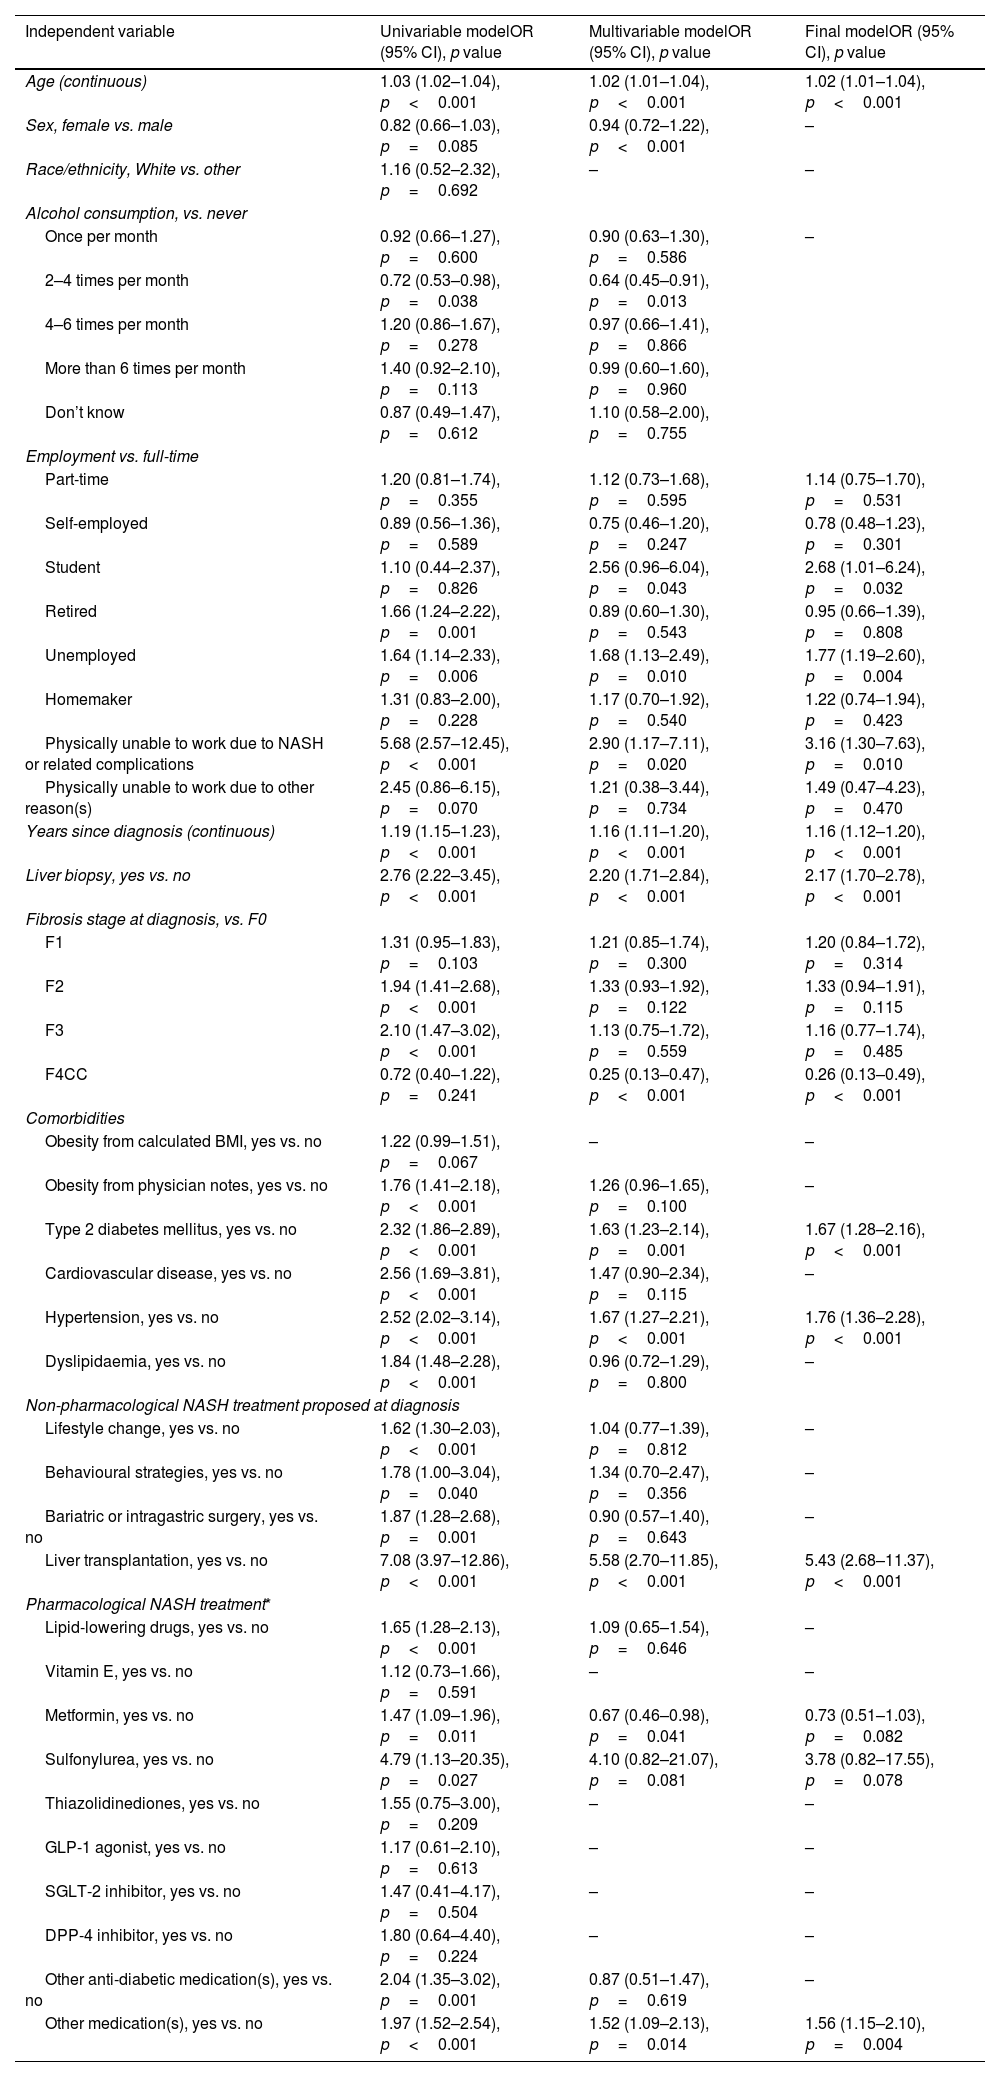
The following covariates were excluded from the univariable analysis based on the results of the multicollinearity assessment: BMI; height; number of comorbidities; presence of any comorbidities; and diet change proposed at NASH diagnosis. Evaluation of model covariates by univariable regression showed several significant influential factors for disease progression, although these did not account for the presence of any other factors (Table 2). Significant univariable predictors of progression included: age; years since diagnosis; liver biopsy diagnosis; employment status; fibrosis stage at diagnosis; obesity and cardiometabolic comorbidities; and pharmacological treatments. All of the comorbidities and proposed non-pharmacological treatments, including bariatric surgery or liver transplant, were statistically significant in the univariable analysis, as were prescriptions at diagnosis for lipid-lowering drugs, metformin, sulfonylureas, other anti-diabetic medications and any other medications.
Modelling fibrosis progression in the European cohort.
| Independent variable | Univariable modelOR (95% CI), p value | Multivariable modelOR (95% CI), p value | Final modelOR (95% CI), p value |
|---|---|---|---|
| Age (continuous) | 1.03 (1.02–1.04), p<0.001 | 1.02 (1.01–1.04), p<0.001 | 1.02 (1.01–1.04), p<0.001 |
| Sex, female vs. male | 0.82 (0.66–1.03), p=0.085 | 0.94 (0.72–1.22), p<0.001 | – |
| Race/ethnicity, White vs. other | 1.16 (0.52–2.32), p=0.692 | – | – |
| Alcohol consumption, vs. never | |||
| Once per month | 0.92 (0.66–1.27), p=0.600 | 0.90 (0.63–1.30), p=0.586 | – |
| 2–4 times per month | 0.72 (0.53–0.98), p=0.038 | 0.64 (0.45–0.91), p=0.013 | |
| 4–6 times per month | 1.20 (0.86–1.67), p=0.278 | 0.97 (0.66–1.41), p=0.866 | |
| More than 6 times per month | 1.40 (0.92–2.10), p=0.113 | 0.99 (0.60–1.60), p=0.960 | |
| Don’t know | 0.87 (0.49–1.47), p=0.612 | 1.10 (0.58–2.00), p=0.755 | |
| Employment vs. full-time | |||
| Part-time | 1.20 (0.81–1.74), p=0.355 | 1.12 (0.73–1.68), p=0.595 | 1.14 (0.75–1.70), p=0.531 |
| Self-employed | 0.89 (0.56–1.36), p=0.589 | 0.75 (0.46–1.20), p=0.247 | 0.78 (0.48–1.23), p=0.301 |
| Student | 1.10 (0.44–2.37), p=0.826 | 2.56 (0.96–6.04), p=0.043 | 2.68 (1.01–6.24), p=0.032 |
| Retired | 1.66 (1.24–2.22), p=0.001 | 0.89 (0.60–1.30), p=0.543 | 0.95 (0.66–1.39), p=0.808 |
| Unemployed | 1.64 (1.14–2.33), p=0.006 | 1.68 (1.13–2.49), p=0.010 | 1.77 (1.19–2.60), p=0.004 |
| Homemaker | 1.31 (0.83–2.00), p=0.228 | 1.17 (0.70–1.92), p=0.540 | 1.22 (0.74–1.94), p=0.423 |
| Physically unable to work due to NASH or related complications | 5.68 (2.57–12.45), p<0.001 | 2.90 (1.17–7.11), p=0.020 | 3.16 (1.30–7.63), p=0.010 |
| Physically unable to work due to other reason(s) | 2.45 (0.86–6.15), p=0.070 | 1.21 (0.38–3.44), p=0.734 | 1.49 (0.47–4.23), p=0.470 |
| Years since diagnosis (continuous) | 1.19 (1.15–1.23), p<0.001 | 1.16 (1.11–1.20), p<0.001 | 1.16 (1.12–1.20), p<0.001 |
| Liver biopsy, yes vs. no | 2.76 (2.22–3.45), p<0.001 | 2.20 (1.71–2.84), p<0.001 | 2.17 (1.70–2.78), p<0.001 |
| Fibrosis stage at diagnosis, vs. F0 | |||
| F1 | 1.31 (0.95–1.83), p=0.103 | 1.21 (0.85–1.74), p=0.300 | 1.20 (0.84–1.72), p=0.314 |
| F2 | 1.94 (1.41–2.68), p<0.001 | 1.33 (0.93–1.92), p=0.122 | 1.33 (0.94–1.91), p=0.115 |
| F3 | 2.10 (1.47–3.02), p<0.001 | 1.13 (0.75–1.72), p=0.559 | 1.16 (0.77–1.74), p=0.485 |
| F4CC | 0.72 (0.40–1.22), p=0.241 | 0.25 (0.13–0.47), p<0.001 | 0.26 (0.13–0.49), p<0.001 |
| Comorbidities | |||
| Obesity from calculated BMI, yes vs. no | 1.22 (0.99–1.51), p=0.067 | – | – |
| Obesity from physician notes, yes vs. no | 1.76 (1.41–2.18), p<0.001 | 1.26 (0.96–1.65), p=0.100 | – |
| Type 2 diabetes mellitus, yes vs. no | 2.32 (1.86–2.89), p<0.001 | 1.63 (1.23–2.14), p=0.001 | 1.67 (1.28–2.16), p<0.001 |
| Cardiovascular disease, yes vs. no | 2.56 (1.69–3.81), p<0.001 | 1.47 (0.90–2.34), p=0.115 | – |
| Hypertension, yes vs. no | 2.52 (2.02–3.14), p<0.001 | 1.67 (1.27–2.21), p<0.001 | 1.76 (1.36–2.28), p<0.001 |
| Dyslipidaemia, yes vs. no | 1.84 (1.48–2.28), p<0.001 | 0.96 (0.72–1.29), p=0.800 | – |
| Non-pharmacological NASH treatment proposed at diagnosis | |||
| Lifestyle change, yes vs. no | 1.62 (1.30–2.03), p<0.001 | 1.04 (0.77–1.39), p=0.812 | – |
| Behavioural strategies, yes vs. no | 1.78 (1.00–3.04), p=0.040 | 1.34 (0.70–2.47), p=0.356 | – |
| Bariatric or intragastric surgery, yes vs. no | 1.87 (1.28–2.68), p=0.001 | 0.90 (0.57–1.40), p=0.643 | – |
| Liver transplantation, yes vs. no | 7.08 (3.97–12.86), p<0.001 | 5.58 (2.70–11.85), p<0.001 | 5.43 (2.68–11.37), p<0.001 |
| Pharmacological NASH treatment* | |||
| Lipid-lowering drugs, yes vs. no | 1.65 (1.28–2.13), p<0.001 | 1.09 (0.65–1.54), p=0.646 | – |
| Vitamin E, yes vs. no | 1.12 (0.73–1.66), p=0.591 | – | – |
| Metformin, yes vs. no | 1.47 (1.09–1.96), p=0.011 | 0.67 (0.46–0.98), p=0.041 | 0.73 (0.51–1.03), p=0.082 |
| Sulfonylurea, yes vs. no | 4.79 (1.13–20.35), p=0.027 | 4.10 (0.82–21.07), p=0.081 | 3.78 (0.82–17.55), p=0.078 |
| Thiazolidinediones, yes vs. no | 1.55 (0.75–3.00), p=0.209 | – | – |
| GLP-1 agonist, yes vs. no | 1.17 (0.61–2.10), p=0.613 | – | – |
| SGLT-2 inhibitor, yes vs. no | 1.47 (0.41–4.17), p=0.504 | – | – |
| DPP-4 inhibitor, yes vs. no | 1.80 (0.64–4.40), p=0.224 | – | – |
| Other anti-diabetic medication(s), yes vs. no | 2.04 (1.35–3.02), p=0.001 | 0.87 (0.51–1.47), p=0.619 | – |
| Other medication(s), yes vs. no | 1.97 (1.52–2.54), p<0.001 | 1.52 (1.09–2.13), p=0.014 | 1.56 (1.15–2.10), p=0.004 |
BMI, body mass index; CC, compensated cirrhosis; CI, confidence interval; DPP-4, dipeptidyl peptidase-4; GLP-1, glucagon-like peptide-1; NASH, non-alcoholic steatohepatitis; OR, odds ratio; SGLT-2, sodium-glucose co-transporter-2.
Several significant predictors of disease progression were identified in the initial multivariable logistic regression model when keeping other covariates constant (Table 2). Following the model selection criteria, the final multivariable model for disease progression included significant covariates for age, years since diagnosis, employment status, T2DM, hypertension, liver transplant, and liver biopsy at diagnosis (Table 2). As such, the final model suggested that a 2% (odds ratio, 1.02 [95% confidence interval 1.01–1.04]; p<0.001) increase for risk of progression could be expected for each additional year of age, and a 16% (1.16 [1.12–1.20]; p<0.001) increased risk for each additional year since NASH diagnosis. Compared with patients in full-time employment, risk of progression was increased by 77% (1.77 [1.19–2.60]; p=0.004) for unemployed patients and by 216% (3.16 [1.30–7.63]; p=0.010) for patients physically unable to work due to NASH-related complications. The presence of T2DM and hypertension increased risk of progression by 67% (1.67 [1.28–2.16]; p<0.001) and 76% (1.76 [1.36–2.28]; p<0.001), respectively. Physician recommendation for liver transplant at NASH diagnosis was associated with an increased risk of 443% (5.43 [2.68–11.37]; p<0.001), as was having a prescription for ‘other medication(s)’ (Table A3), which was associated with an increased risk of 56% (1.56 [1.15–2.10]; p=0.004).
DiscussionWe identified clinical and sociodemographic risk factors for disease progression based on real-world physician-reported demographic and clinical characteristics of adults with NASH in Europe. Significant model parameters after adjusting for all other covariates included age, employment status, NASH duration, having a liver biopsy at diagnosis, T2DM, hypertension and prescription of ‘other medication(s)’ at the time of NASH diagnosis (still being received at last consultation date). Being physically unable to work due to NASH or related complications, receiving a prescription for a sulfonylurea at the time of diagnosis and having had a liver transplant recommendation were each particularly significant determinants of disease progression.
The results of the final model of the present study are generally similar to findings in the US cohort of the GAIN study.21 Both studies reported greater odds of fibrosis progression among patients with more years since NASH diagnosis, patients for whom liver transplant was proposed at the time of NASH diagnosis, and those who were unemployed or physically unable to work due to NASH or related complications. There are also differences in the US cohort compared to what has been reported in this study.21 The odds of progression were lower for women than men and higher for smokers versus non-smokers among participants in the US cohort, whereas we found no significant difference by sex or by smoking status in the European cohort. Furthermore, in the European cohort but not in the US cohort, older age was associated with greater odds of progression. Additionally, we found greater odds of progression in participants in Europe who had received a liver biopsy at diagnosis, but no significant difference was seen in participants in the US. In terms of comorbidities, greater odds of progression in patients with versus without obesity (from physician notes) were reported for the US cohort but this was not the case in the European cohort. Conversely, T2DM and hypertension were associated with greater odds of progression in the European cohort but not in the US cohort in the GAIN study.21 These differences may reflect the variations in clinical practices and population demographics between the two studies, and may also be explained by the observational nature of the study, where the sample size is not powered for specific research questions.
Our study suggested that a patient may progress to a higher fibrosis stage every 6.3 years on average, based on a 16% increase in odds of progression for each year since NASH diagnosis. This is generally consistent with findings in the US cohort of the GAIN study, which suggested average progression to a higher stage every 5.9 years,21 and with the estimate of 7.1 years reported in a meta-analysis of paired liver biopsy studies.22
The model used demonstrated good validity, with an area under the receiver operating characteristic curve (AUROC) of 0.76, indicating that routinely available sociodemographic and clinical factors can assess the risk of fibrosis progression. This is consistent with other clinical models developed to support the identification of NASH or advanced fibrosis, albeit often with smaller sample sizes and in more concentrated clinical contexts. For example, Bazick and colleagues (2015) investigated predictors of NASH or advanced fibrosis among 346 patients with T2DM and NAFLD,15 and Vilar-Gomez and colleagues (2017) reported biomarker levels predictive of changes in liver fibrosis among 261 patients with NASH receiving lifestyle modification interventions.16 Among patients with T2DM and NAFLD, Bazick and colleagues reported age, Hispanic ethnicity, BMI, waist-to-hip ratio, hypertension, AST-to-ALT ratio, alkaline phosphatase, bilirubin, globulin, albumin, serum insulin, haematocrit, international normalised ratio and platelet count to be associated with advanced fibrosis, with an AUROC of 0.80.15 Among patients with NASH who had undergone 1 year of lifestyle intervention, Vilar-Gomez and colleagues reported change in platelets and NAFLD fibrosis score (NFS) to be significant predictors of fibrosis progression by multivariable analysis, based on paired liver biopsies; however, a model that included change in HbA1c, platelet and ALT normalisation was significantly more accurate than NFS and other fibrosis models for predicting fibrosis improvement, with an AUROC of 0.96.16 Blood-based biomarkers of fibrosis progression were not evaluated in the present study due to a lack of relevant data in the GAIN patient sample, but it is likely that a combination of sociodemographic and clinical factors and blood-based biomarkers could yield a high predictive accuracy, and should be evaluated in future studies. Another area of investigation that could be considered for future research is the association of clinical and socio-demographic factors with the degree of fibrosis progression.
This clinical model sought to identify practical, real-world determinants of NASH disease progression in a large cohort of adults in five European countries; however, there are some limitations. One of the main limitations of observational, chart review studies is the lack of control over the data. This means that information in the patients’ records, how the information was obtained, and what can be analysed when reviewing the records is largely determined by standard practices of the institution and the treating physician. To obtain a representative sample for the study, this cohort included patients who had been diagnosed with NASH with and without confirmatory liver biopsy. The use of different diagnostic methods may lead to variations in disease classification, as NASH biomarkers have not been demonstrated to have the same level of accuracy for determining fibrosis as histological methods. However, non-invasive techniques, such as magnetic resonance imaging, have been shown to provide reliable measurements of components of NASH such as fibrosis and steatosis.23,24 Furthermore, the GAIN study revealed that >50% of the overall population never underwent a biopsy to confirm disease; therefore, the analysis would not have been representative of fibrosis progression in a real-world setting if it had only included biopsy-confirmed patients.8 The screening and recruitment of patients at a specialist clinic for the GAIN study meant that the population included in this analysis consisted of those who have engaged with secondary/tertiary care. However, current trends in diagnosis and management of NASH indicate that involvement of secondary and tertiary care clinicians is common in real-world practice and so the conclusions of this analysis remain applicable to the wider NASH population.25–27 While we were able to use a large sample of patients from the GAIN study, patients in the European cohort had an average of 2.5 years since diagnosis, which may be considered a relatively short period of time to evaluate progression in this chronic condition. Liver biopsy was a significant predictor of progression in our model, which may be considered a proxy for severity observed by physicians in Europe, who would usually prescribe this procedure only to certain patients due to its invasive nature. T2DM medications commonly prescribed in early T2DM management – metformin and sulfonylureas – were all significant predictors of NASH progression when accounting for the presence of the others in the model (and were not correlated in the multicollinearity assessment), signalling the underlying relationship between NAFLD and cardiometabolic syndrome. It should be noted that parameters related to non-pharmacological treatment were recorded as those proposed at NASH diagnosis. These were likely reflective of patients’ clinical presentation at the time, and may also be attributed to physician intentions, rather than the occurrence or duration of non-pharmacological treatment by the patient. It should also be noted that certain clinical measures that are known or likely to be important in this setting, such as obesity and weight loss, were not included in the final model. This was related to data collection and analysis; for example, weight loss was captured as a percentage based on physician recall over a 12-month period, which was ultimately deemed too convoluted for interpretation and inclusion in the model.
ConclusionsThis study has identified practical, real-world determinants of NASH disease progression in a large cohort of adults in Europe. In summary, age, baseline employment status, liver biopsy, cardiometabolic comorbidities and pharmacological treatment were found to be associated with disease progression based on medical chart-derived physician-reported information. Socio-economic issues were major factors and should be taken into account when designing strategies in the management of NASH. While further work is needed to validate these findings, consideration of these factors, in addition to fibrosis-related biomarkers, could help clinicians and public health managers to assess potential interventions to avoid or delay disease progression in patients with NAFLD.
Data-sharing statementThe data that support the findings of this study may be available from HCD Economics, Ltd, but restrictions apply to the availability of these data, which were used under licence for the current study, and so are not publicly available. Data may be available from the authors upon reasonable request and with permission of HCD Economics, Ltd.
Ethical considerationsThe study protocol was approved by the Research Ethics Subcommittee of the Faculty of Health and Social Care within the University of Chester. The approval stipulated that the study was to be carried out in correspondence with regional and relevant guidelines, and the 1975 Declaration of Helsinki.
Author contributionsAS, GP, LR-C, BF and HD conducted the analysis and contributed to the study design and interpretation of findings; JDdRF, MA, MR-G and JMS contributed to the study design and interpretation of findings. All authors participated in the development of the manuscript and approved submission.
FundingThis study was sponsored by Novo Nordisk A/S. Novo Nordisk A/S contributed to the study design and interpretation of findings, participated in the development of the manuscript and approved submission.
Conflict of interestLR-C and BF are employees of HCD Economics, Ltd., and AS, GP and HD were employees at the time of the study. HCD Economics, Ltd., received research funding for this study from Novo Nordisk. MA, KKM and JDdRF are employees of Novo Nordisk A/S, the study sponsor; KKM may have employee shares. JMS has provided consultancy to BMS, Boehringer Ingelheim, Echosens, Genfit, Gilead Sciences, Intercept Pharmaceuticals, Madrigal, Novartis, Nordic Bioscience, Novo Nordisk, Pfizer, Roche, Sanofi, Siemens Healthcare GmbH, and Zydus, has received research funding from Gilead Sciences, and has served on speaker's bureaus for Falk Foundation and MSD Sharp & Dohme GmbH. MR-G has served as a consultant for Allergan, Alpha-sigma, BMS, Boehringer Ingelheim, Gilead, Intercept, Kaleido, MSD, Prosciento, Shionogi and Zydus, and has received research grants from Gilead, Intercept, Novo Nordisk, Siemens and Theratechnologies.
This study was supported by Novo Nordisk. The authors received medical writing and editorial support from Jeff Frimpter, MPH, of HCD Economics, Ltd., Sophie Bruce of Open Health, and Sally Humphries, contract writer working on behalf of Open Health, funded by Novo Nordisk.
The following are the supplementary data to this article: