
Hundreds of millions of patients are suffering from cirrhosis and other chronic liver diseases worldwide, and this public health problem continues to grow. It has been proven that liver fibrosis is reversible after the elimination of the etiology, especially in the early stage. Thus, early diagnosis of liver fibrosis is of vital importance for clinical treatment. Liver biopsy remains the gold standard for both diagnosis and staging of fibrosis, but is suboptimal, due in large parts to its invasive nature and sundry associated complications. To overcome this, a number of non-invasive diagnosis based on serum biomarkers or imaging modalities have been developed. While diagnosis based on serum biomarkers is cheaper and more acceptable to patients, almost none developed to date are liver-specific, and may engender a false positive error. The imaging modalities have evolved rapidly and are taking on more and more important roles in the diagnosis of liver fibrosis.
Cientos de millones de pacientes sufren cirrosis y otras enfermedades hepáticas crónicas en todo el mundo, y este problema de salud pública no cesa de crecer. Se ha demostrado que la fibrosis hepática es reversible tras la eliminación de su etiología, especialmente en una fase temprana. De este modo, el diagnóstico precoz de la fibrosis hepática resulta de crucial importancia para el tratamiento clínico. La biopsia de hígado sigue siendo el método de referencia tanto para el diagnóstico como para la estadificación de la fibrosis, pero se trata de un enfoque mejorable, debido en gran medida a su naturaleza invasiva y a las diversas complicaciones asociadas. Para superar estas limitaciones se han desarrollado diversas técnicas diagnósticas no invasivas basadas en biomarcadores séricos o técnicas de diagnóstico por imagen. A pesar de que el diagnóstico basado en biomarcadores séricos es menos costoso y resulta más aceptable para los pacientes, hasta la fecha prácticamente no se ha desarrollado ningún método que sea específico para el hígado, y esto puede dar lugar a falsos positivos. Las técnicas de diagnóstico por imagen han evolucionado rápidamente y están adoptando un papel cada vez más importante en el diagnóstico de la fibrosis hepática.
Liver fibrosis comes into being as a reversible result of a sustained or recurrent wound healing response to hepatic injury created by viral, toxic and/or metabolic insult, and represents an imbalance between the synthesis and degeneration of extracellular matrix (ECM).1 Accompanied by the distortion of hepatic structure and function, cirrhosis is the result of the progression of liver fibrosis. Regardless of the etiology, activated hepatic stellate cells secrete ECM molecules and release matrix metalloproteinases (MMPs) and tissue inhibitors of MMPs in the space of Disse,2 which can result in excessive matrix deposition and hepatic fibrogenesis.
According to the latest Global Burden of Disease Study, the global incidence of cirrhosis and other chronic liver diseases in 2017 was 5,154,900.3 Moreover, from 2007 to 2017, the years lived with disability (or ‘YLDs’) and all-age deaths from cirrhosis have increased by 34.8% and 15.0%,3,4 respectively. Hence, the clinical burden of cirrhosis is substantial. It has been validated that liver fibrosis can be reversed after proper treatment of the underlying etiologies, especially at the early stage of fibrosis.5 Therefore, early diagnosis and staging of liver fibrosis will benefit the treatment of patients, serving as a determinant in the prognosis of chronic liver disease, and acquiring the dynamic changes of liver fibrosis in a timely manner will be a boost for the clinical treatment approach.
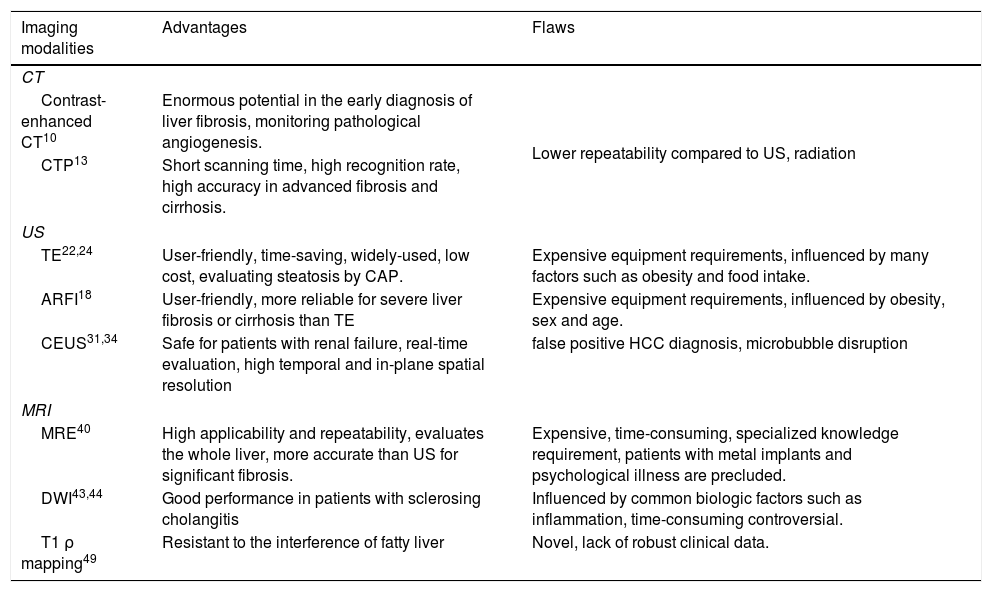
Imaging modalitiesThe medical imaging is a non-invasive tool with robust diagnostic function. Basic imaging methods, including computed tomography (CT), ultrasound (US) and magnetic resonance imaging (MRI), can provide dependable information about decompensated cirrhosis, while the performance for diagnosing early fibrosis is not so good.6 Over the last few decades, quite a number of more advanced imaging modalities have been developed, enabling a prompt evaluation of liver fibrosis and cirrhosis. And, combining different imaging modalities or combining them with serum biomarkers can be a realistic substitution for liver biopsy. Advantages and flaws of different imaging modalities are summarized briefly in Table 1.
Summary characteristics of imaging modalities.
| Imaging modalities | Advantages | Flaws |
|---|---|---|
| CT | ||
| Contrast-enhanced CT10 | Enormous potential in the early diagnosis of liver fibrosis, monitoring pathological angiogenesis. | Lower repeatability compared to US, radiation |
| CTP13 | Short scanning time, high recognition rate, high accuracy in advanced fibrosis and cirrhosis. | |
| US | ||
| TE22,24 | User-friendly, time-saving, widely-used, low cost, evaluating steatosis by CAP. | Expensive equipment requirements, influenced by many factors such as obesity and food intake. |
| ARFI18 | User-friendly, more reliable for severe liver fibrosis or cirrhosis than TE | Expensive equipment requirements, influenced by obesity, sex and age. |
| CEUS31,34 | Safe for patients with renal failure, real-time evaluation, high temporal and in-plane spatial resolution | false positive HCC diagnosis, microbubble disruption |
| MRI | ||
| MRE40 | High applicability and repeatability, evaluates the whole liver, more accurate than US for significant fibrosis. | Expensive, time-consuming, specialized knowledge requirement, patients with metal implants and psychological illness are precluded. |
| DWI43,44 | Good performance in patients with sclerosing cholangitis | Influenced by common biologic factors such as inflammation, time-consuming controversial. |
| T1 ρ mapping49 | Resistant to the interference of fatty liver | Novel, lack of robust clinical data. |
Traditionally, CT has often been used in the diagnosis of advanced liver fibrosis and cirrhosis, especially for assessment of liver cirrhosis-associated complications, such as portal hypertension. Based on simplified indices for liver remodeling and attenuation, quantitative CT scores have been shown to have a good performance in predicting significant liver fibrosis, with high areas (0.96–0.97) under the ROC curves.7 However, considering the reliance on radiation and inherent lower accuracy compared to other diagnostic methods such as fibroScan and MRE, CT remains an inferior choice for assessing early stages of liver fibrosis. Countless efforts have been taken to improve its accuracy and diagnostic value, for example: employing iodine density measurement in 8-cm detector dual-energy CT, clinicians could assess liver parenchyma hemodynamic changes and evaluate the severity through quantitative indices which correlate positively with Child-Paugh Score.8
Contrast-enhanced CT (CECT)Many researchers have found that CECT may be a pretty good choice in the evaluation of liver fibrosis. Choi et al. developed a deep learning system (based upon a data set including portal venous phase CT images from 7461 patients with pathologically-confirmed liver fibrosis) for staging liver fibrosis with CECT images of the liver. With a high accuracy as it diagnosed significant or more severe fibrosis patients, it did not assess moderate fibrosis.9 While, from the study on the rat model through micro-CT, the performance of CETC in assessing early and intermediate fibrosis is satisfying with strong correlations to both the Ishak fibrosis score (R2=0.751, P<0.01) and the fibrotic area (R2=0.801, P<0.01).10 Additionally, monitoring pathological angiogenesis and microvasculature alterations could be realized by contrast-enhanced micro-CT.11 Since a sharp increase in sinusoid angiogenesis has been observed during early-stage fibrosis and the vascular reconstruction would happen due to the portal hypertension,12 CECT might be of potential use in assessing liver fibrosis and the complications.
CT perfusion (CTP)Based on the changes of substantial microcirculation occurring in liver fibrosis: an increase in the arterial perfusion and a drop in portal and total liver perfusion, CTP allows for a quantitative assessment of the hepatic perfusion.13 And according to the transient time (a parameter of CTP) increased significantly between minimal fibrosis and intermediate fibrosis (P=0.025), discriminating mild fibrosis from intermediate fibrosis could be realized by CTP.13 Combining the measurements of liver and spleen might improve the accuracy of the assessment for liver fibrosis, and the splenic mean transient time (a parameter of splenic perfusion) also changes significantly between different fibrosis stages revealed under the Kruskal–Wallis test (P<0.001).14
USOn the basis of gray-scale findings such as surface nodularity, altered parenchymal echogenicity and heterogeneous echotexture, which reflect the presence of regenerative nodules and fibrous septa, US could help diagnosis liver cirrhosis.15 And combing the spleen longitudinal diameter, doctors could evaluate portal hypertension in patients with viral hepatitis.16 It is noteworthy that splenomegaly dose not equal portal hypertension, other mechanisms such as reduced lysosomal lipase in patients with non-alcoholic fatty liver disease (NAFLD) could result in splenomegaly.17 So in case of the splenomegaly detected by US, combining other examinations is needed for the right estimation of portal hypertension, especially in patients with NAFLD. The advantages of low cost, non-invasiveness, reproducibility, simple application, and non-reliance on ionizing radiation make US an attractive alternative to liver biopsy.18 However, like traditional CT, its accuracy is not reliable for the diagnosis of early fibrosis, which continues to limit the utility of US.
Transient elastography (TE)Based on the rationale that the collagen deposits and imparts parenchymal rigidity in livers during fibrogenesis, TE converts this rigidity into a stiffness value to evaluate the fibrosis degree,19 and it has to be noted that different from other imaging methods, TE presents us with the stiffness measurement of the liver tissue instead of an intuitive picture of the liver, therefore, it is not per se an imaging method.
Numerous researches have validated its accuracy in diagnosing and staging liver fibrosis under a recognized pre-determined set of cut-off values,19 as well as in identifying the improvement of liver fibrosis under effective treatment of different etiologies.20 Furthermore, the value of TE is a good reference for identifying patients at the risk of possible negative outcomes of liver cirrhosis such as liver decompensation, liver failure, hepatocellular carcinoma,21 and at worst, death. Moreover, no more than 5min is needed to perform TE at patient bedside or in an outpatient clinic, with results obtained immediately,22 doctors often choose TE to monitor patients longitudinally for evaluating therapeutic effectiveness and modulating treatment plan promptly.23 Meanwhile, it is important to note that a non-cirrhotic liver may also have a high TE value. Non-cirrhotic portal hypertension conditions such as portal vein thrombosis and nodular regenerative hyperplasia might result in an elevated TE value.24 Recent food intake, abdominal fat and elevated liver enzymes have all been reported as factors with potential for impairing the accuracy of TE.25
Acoustic radiation force impulse (ARFI)Akin to TE, ARFI is shear wave-based technique, and it is based on an acoustic internal push, known as liver share wave velocity, that assesses liver stiffness using focused US beams. Converted by Young's modulus: 3ρv2 (ρ and v represent the tissue density and the speed of shear wave respectively), the measured shear wave speed could be represented by the value in kilopascals (kPa) that positively correlated with tissue stiffness.18 Several researches have thoroughly compared the diagnostic performance of ARFI and TE for the evaluation of liver fibrosis with the conclusion that ARFI is more reliable than TE, especially in patients with ascites,26 the AUROC values and sensitivity of ARFI in diagnosing significant fibrosis could reach over 85%.27 Overall, there are 2 types of ARFI: point share wave elastography (pSWE) and two-dimensional share wave elastography (2D-SWE),18 sampling area and focused energy are the main differences, and the 2D-SWE is the latest elastography used in clinic.
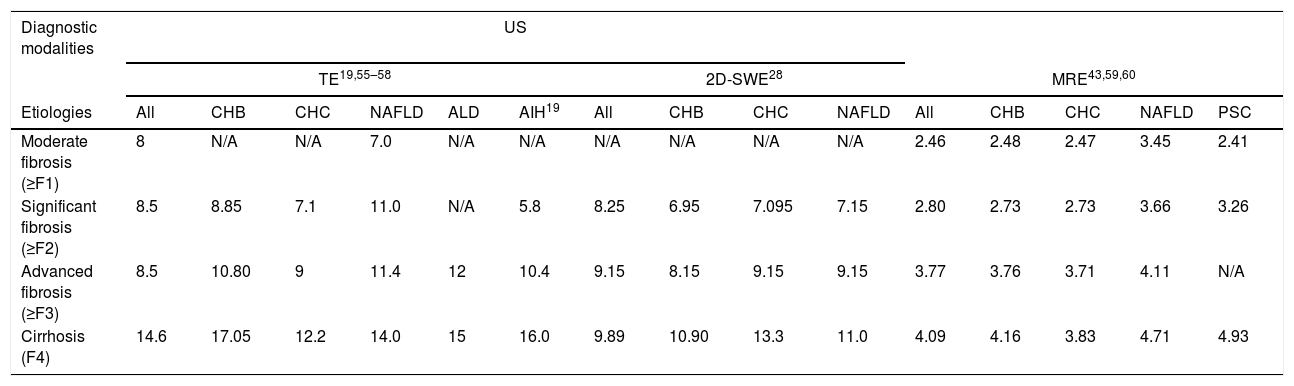
The 2D-SWE creates a real-time, 2D quantitative map of liver stiffness superimposed on a B-mode image, characterized by a higher frame rate to record the shear wave than the conventional US device.28 It integrates the information from the anatomy and stiffness: the shear wave velocities distribution reflects liver elastic properties, and the B-mode imaging represents the liver morphology, presenting us the anatomy specific elastograms of the liver.29 The reliability of it to assess the liver fibrosis is now being researched widely. It has a better performance than TE, probably due to the larger area of interest in 2D-SWE, which is more reflective of the whole picture of the liver; moreover, it could localize to the area of interest exactly. Because the liver stiffness could be influenced by the inflammation due to different etiologies,30 the threshold values that defines should be defined according to etiologies, and different cut-off values according to the etiologies are shown in Table 2. However, the area of interest which could be representative of the whole liver is depended on the operator, and it might cause deviations. It is noteworthy that the fibrosis is not reflected by the stiffness entirely, as the cofounding factors such as the inflammation and fluctuations of liver enzymes might influence the stiffness value,30 so it is necessary to combine other examinations such as medical history, clinical symptoms, serum biomarkers and so on.
Optimal cut-off values of TE, 2D-SWE and MRE in classifying liver fibrosis according to different etiologies.
| Diagnostic modalities | US | ||||||||||||||
|---|---|---|---|---|---|---|---|---|---|---|---|---|---|---|---|
| TE19,55–58 | 2D-SWE28 | MRE43,59,60 | |||||||||||||
| Etiologies | All | CHB | CHC | NAFLD | ALD | AIH19 | All | CHB | CHC | NAFLD | All | CHB | CHC | NAFLD | PSC |
| Moderate fibrosis (≥F1) | 8 | N/A | N/A | 7.0 | N/A | N/A | N/A | N/A | N/A | N/A | 2.46 | 2.48 | 2.47 | 3.45 | 2.41 |
| Significant fibrosis (≥F2) | 8.5 | 8.85 | 7.1 | 11.0 | N/A | 5.8 | 8.25 | 6.95 | 7.095 | 7.15 | 2.80 | 2.73 | 2.73 | 3.66 | 3.26 |
| Advanced fibrosis (≥F3) | 8.5 | 10.80 | 9 | 11.4 | 12 | 10.4 | 9.15 | 8.15 | 9.15 | 9.15 | 3.77 | 3.76 | 3.71 | 4.11 | N/A |
| Cirrhosis (F4) | 14.6 | 17.05 | 12.2 | 14.0 | 15 | 16.0 | 9.89 | 10.90 | 13.3 | 11.0 | 4.09 | 4.16 | 3.83 | 4.71 | 4.93 |
US: ultrasonography; TE: transient elastography; 2D-SWE: two-dimensional share wave elastography; MRE: magnetic resonance elastography; CHB: chronic hepatitis B; CHC: chronic hepatitis C; NAFLD: non-alcoholic fatty liver disease; AIH: auto-immune hepatitis; PSC: primary sclerosing cholangitis.
Akin to CTP, it evaluates liver fibrosis and cirrhosis is based on the liver hemodynamics alteration. Using microbubble as contrast agents, CEUS has intrinsic advantages: On the one hand, it is safety for patients with renal failure for whom conventional CT or MRI contrast agents are contraindicated31; on the other hand, free of interstitial or equilibrium phase, it has a better temporal and in-plane spatial resolution than contrast-enhanced CT and MRI. On the basis of its wash-in and washout patterns, focal liver lesions such as hepatocellular carcinoma can be detected – hypervascularity in the arterial phase and washout in the portal venous or delayed phase.32 For cirrhotic patients that are at a high risk for hepatocellular carcinoma, CEUS could be used during the follow up for the detection of new lesions. Based on portal vein maximum signal intenstiy, CEUS could diagnosis both and early fibrosis with high specificities in rabbits.33 CEUS also has limitations: based on US, the value of it depends on skills of operators, breath-hold of the patients and so on. Moreover, factors such as continuous imaging and inappropriate frame rate could result in excessive disruption of microbubble agent.34
MRILike US, MRI is another radiation-free imaging modality, and its specificity, sensitivity and accuracy are similar to CT in the diagnosis of liver cirrhosis. In the experimental fibrosis animal model (tetrachloride-induced), T1 and T2 mapping in MRI were found to associated with the severity of liver fibrosis.35 Moreover, a prospective study showed that, by calculating the hepatocyte fraction, the AUROC values of T1 mapping for diagnosis of any (≥F1), significant (≥F2), advanced (≥F3) and cirrhosis (≥F4) were 0.837, 0.890, 0.957, 0.957, respectively.36
As a part of the body unit, liver with pathological changes could impact other visceral organs such as spleen, kidney and cardiac. Measuring the volume, blood flow, perfusion of critical organs could help clinicians evaluate liver fibrosis and cirrhosis in a holistic fashion.37 The hepatic venous pressure gradient (HVPG) is an important index for evaluating the patients with fibrosis or cirrhosis, while invasiveness, high cost and poor reproducibility limit its implement. However, from the research by Bradley et al., apart from the structural changes reflected by prolonged T1 values and hemodynamic changes within the liver reflected by increased total hepatic blood flow and decreased liver perfusion, the HVPG could be estimated by the combination of T1 relaxation time and splenic artery velocity.38 Moreover, renal cortex T1 significantly reduced with disease severity (P<0.001).39 Therefore, MRI could help clinicians make an overall evaluation of cirrhotic patients. However, the accuracy of MRI for diagnosing liver fibrosis at early stages is still not satisfying. Thanks to great efforts of countless researchers, advanced imaging modalities based on MRI with improved performance in the evaluation of liver fibrosis are now being proposed and even developed, overcoming the limitations of diagnosis on the basis of morphological features alone.
Magnetic resonance elastography (MRE)MRE is a novel non-invasive tool for mapping of tissue elasticity based upon phase contrast, something like the palpation of the liver which can assess its tissue stiffness physically. It can directly visualize and quantitatively measure propagating acoustic strain waves.36 The diagnostic performance of MRE remains promising in clinical practice, not only for diagnosing liver fibrosis, but also for evaluating the patients’ survival by clinical end-points such as hepatocellular carcinoma and hepatic decompensation.40 Considering the less robust features of traditional MRI for detecting early fibrosis and the better performance of MRE in detecting morphological features in cirrhosis,31 MRE is superior for diagnosing patients with suspected liver fibrosis or for evaluating the effectiveness of a treatment. Furthermore, recent studies have reported that MRE is superior to ARFI and TE,40 having a higher AUROC than either for identifying liver fibrosis (P<0.01), especially in patients with non-alcoholic fatty liver disease.
Preceding studies and analyses have indicated satisfactory sensitivity, specificity, and accuracy rates of MRE in diagnosing and staging of liver fibrosis; moreover, just like TE, the high rates of repeatability and painlessness41 of MRE make it useful for longitudinal follow-up of patients with chronic liver disease. However, as every coin has two sides, MRE has some limitations too. Firstly, compared to other imaging modalities, such as TE, it is more expensive, though still cheaper than liver biopsy.41 Secondly, to obtain an accurate diagnosis through MRE, the clinical practitioner should possess specialized knowledge about MRE, and appropriate judgments should be made under different circumstances, such as severe obesity, massive ascites, liver iron deposition and the use of 3.0-Tesla (T), which can lead to the failure of MRE (P<0.004).42 Additionally, metal implants or psychological illness, such as claustrophobia, preclude a patient's ability to be examined by MRE. Because the value from the elastography could be influenced by different etiologies, according to the highest Youden's index (sensitivity+specificity−1), the optimal cut-off values for different fibrosis stages in different etiologies are shown in Table 2.
Diffusion-weighted imaging (DWI)DWI is a kind of imaging modality based on the assumption of the free (unrestricted) diffusion of water protons, which measures the apparent diffusion coefficient (ADC). Since excessive ECM deposition hinders the free movement of water molecules,43 the ADC value is inversely correlated with fibrosis stages as reflected by differing quantifiable measures of the random microscopic motion of water molecules in biological tissue. Conflicting results have been published regarding the accuracy of DWI. Furthermore, findings from the meta-analysis by Wang et al.44 challenged the value of DWI, with its accuracy being inferior to MRE when a 1.5-T MRI scanner is used (z test, P<0.05).
Use of a 3.0-T MRI scanner with consecutive b values of 0, 50, 100, 200, 400, 800s/mm2 has shown DWI to perform well in diagnosing and staging of liver fibrosis for primary sclerosing cholangitis cohorts,45 to be superior to Gd-EOB-DTPA-enhanced MRI, and to be capable of sufficiently discriminating mild or no fibrosis from moderate fibrosis and cirrhosis (P<0.001, sensitivity of 0.917 and 0.8, respectively). However, a contradictory conclusion was made in another study,46 in which use of the same 3.0-T magnetic field at a b value of 500ns/mm2 showed the ADC to be only weakly corrlated with fibrosis stages. It has also been reported that when a 3.0-T MRI scanner was used, fibrosis stages were poorly associated with ADC at a b value of 500s/mm2 (P=0.27), while were significantly associated with ADC at a b value of 1000s/mm2 (P=0.01).47
Thus, the collective findings reported in the literature to date suggested that use of a 3.0-T MRI scanner with a higher b value may benefit the ability of DWI to assess liver fibrosis more reliably. Disappointingly, it can be influenced by several common biologic, pathologic and physiologic factors, such as liver inflammation, steatosis and perfusion effects, and it is not sensitive enough in differentiating mild fibrosis from moderate fibrosis.46
T1 ρ mappingT1 ρ is the spin-lattice relaxation time constant in the rotating frame in MRI, and is sufficiently sensitive for identifying the motion related to tissue macromolecular composition, such as interaction among water molecules.48 In recently years, its application has been extended to detecting and staging liver fibrosis with 1.5-T or 3.0-T MRI scanner. Several preliminary studies have indicated the capabilities of T1 ρ mapping to diagnose and stage fibrosis48: T1 ρ values in fibrotic livers were significantly higher compared to healthy livers (P<0.05); at a threshold of 49.5ms, the sensitivity and specificity of a 3T scanner in predicting liver fibrosis could reach to 77.8% and 100%, respectively, as well as with a good interobserver agreement (intraclass correlation coefficient=0.975). Importantly, its detection may not be affected by the presence of fatty liver.49 However, the lack of robust clinical data cannot be ignored and optimization remains an open need, particularly since it has not shown any obvious superiority over the other imaging modalities, such as 2D-SWE.48
Molecular imaging techniquesLiver fibrosis is widely recognized as a dynamic process, involving the turnover of ECM. Collagen overload is one of its hallmarks. Low molecular weight (<1kDa)-based and peptide (<10kDa)-based agents contributing to the process of ECM turnover have attracted the attention of molecular imaging researchers for their potential to provide better visualization, characterization and measurement of fibrosis process, and thereby to improve the technological approaches for diagnosing and staging of liver fibrosis. The techniques that utilized such agents include, but are not limited to, radiotracer imaging, MRI, MR spectroscopy and optical imaging.50
Among these, MRI has been studied extensively in recent years. Studies using a rat model of liver fibrosis have validated the hypothesis that hepatic expression of integrin αγβ3 reflects the activation of hepatic stellate cells and allowed for characterization of the radioiodinated cyclic RGDyk peptide high-affinity binding to both purified and membrane-bound integrin αγβ3.51 These findings make it possible for subsequent researchers to use integrin αγβ3 as an imaging tracer to visualize and stage liver fibrosis,52 and to monitor the progression of liver fibrosis and therapeutic response. Another fascinating probe is EP-3533, compromising a 10 amino acid cyclic peptide conjugated to three gadolinium moieties.53 It has been clearly shown, through use of a rat model, that MRI-based molecular imaging is capable of distinguishing liver fibrosis stages and monitoring therapeutic effectiveness,54 suggesting its potential for clinical utility.
Ultimately, this experimental imaging modality is attracting more and more attention of researchers, particularly in consideration of its cost-effectiveness, accuracy, convenience, and feasibility for human application. Yet, there's still a long way to go before the application of molecular imaging modalities in clinical diagnosis of liver fibrosis can be fully realized.
ConclusionAdmittedly, imaging modalities of today cannot rival liver biopsy in accuracy of diagnosing and staging liver fibrosis, and the ultimately definitive diagnosis of liver fibrosis still depends on liver biopsy. Despite myriad studies that have demonstrated superiorities of non-invasive imaging modalities for diagnosing liver fibrosis, there remain some problems. For example, almost all of the studies have been performed by skilled operators, which does not reflect the real-life heterogeneity in clinical practices, and it impacts the generalizability of the findings published and underlies the uncertainty as to whether a similarly good performance of complex imaging modalities, such as DWI, could be realized in other clinical departments.
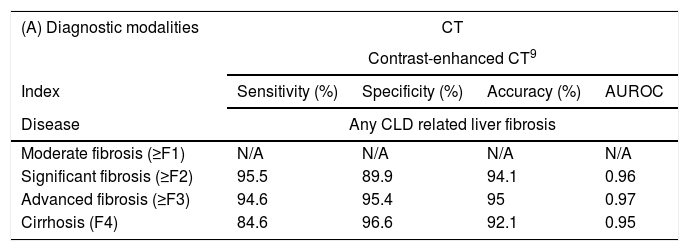
However, on the other hand, as compared with liver biopsy, the characteristics of higher cost-effectiveness, better compliance by patients, easier operation, better repeatability and so on, make non-invasive imaging modalities popular for use in diagnosing and evaluating liver fibrosis. The emergence of novel non-invasive techniques will provide more choices to both treating clinicians and patients for the diagnosis of liver fibrosis, particularly as they are being continually improved for better accuracy and greater practical value. Indexes of different techniques assess different fibrosis degrees are concisely described in Table 3.
Indexes of different techniques assess different fibrosis degrees.
| (A) Diagnostic modalities | CT | |||
|---|---|---|---|---|
| Contrast-enhanced CT9 | ||||
| Index | Sensitivity (%) | Specificity (%) | Accuracy (%) | AUROC |
| Disease | Any CLD related liver fibrosis | |||
| Moderate fibrosis (≥F1) | N/A | N/A | N/A | N/A |
| Significant fibrosis (≥F2) | 95.5 | 89.9 | 94.1 | 0.96 |
| Advanced fibrosis (≥F3) | 94.6 | 95.4 | 95 | 0.97 |
| Cirrhosis (F4) | 84.6 | 96.6 | 92.1 | 0.95 |
| (B) Diagnostic modalities | US | |||||||||||||
|---|---|---|---|---|---|---|---|---|---|---|---|---|---|---|
| TE24 | pSWE27 | 2D-SWE39 | ||||||||||||
| Index | Cut-off (kPa) | Sensitivity (%) | Specificity (%) | AUROC | Cut-off (m/s) | Sensitivity (%) | Specificity (%) | Accuracy (%) | AUROC | Cut-off (kPa) | Sensitivity (%) | Specificity (%) | Accuracy (%) | AUROC |
| Disease | NAFLD | CHC | CHB | |||||||||||
| Moderate fibrosis (≥F1) | N/A | N/A | N/A | N/A | N/A | N/A | N/A | N/A | N/A | N/A | N/A | N/A | N/A | N/A |
| Significant fibrosis (≥F2) | 6.1 | 90 | 38 | 0.77 | 1.36 | 80.6 | 87.5 | 84.1 | 0.89 | 7.6 | 92.0 | 90.0 | 92.1 | 0.97 |
| Advanced fibrosis (≥F3) | 7.1 | 90 | 50 | 0.8 | 1.45 | 90.3 | 87.5 | 88.5 | 0.94 | 9.2 | 91.6 | 96.7 | 93.1 | 0.96 |
| Cirrhosis (F4) | 10.9 | 90 | 70 | 0.89 | 1.7 | 90.9 | 90.3 | 90.4 | 0.95 | 10.4 | 94.6 | 94.9 | 94.7 | 0.98 |
| (C) Diagnostic modalities | MRI | ||||||||||||
|---|---|---|---|---|---|---|---|---|---|---|---|---|---|
| MRE40 | T1 ρ mapping48 | DWI45 | |||||||||||
| Index | Cut-off (kPa) | Sensitivity (%) | Specificity (%) | AUROC | Cut-off (ms) | Sensitivity (%) | Specificity (%) | AUROC | Discrimination | Cut-off (mm2/s×10–3) | Sensitivity (%) | Specificity (%) | AUROC |
| Disease | NAFLD | CCl4-induced liver fibrosis rabbit models | PSC | ||||||||||
| Moderate fibrosis (≥F1) | 2.99 | 58.3 | 90.6 | 0.799 | 62.1 | 83.33 | 83.33 | 0.856 | F1/0 from F2/3 | 1.14 | 91.7 | 82.1 | 0.926 |
| Significant fibrosis (≥F2) | 3.62 | 66.7 | 95.7 | 0.885 | 79.45 | 69.57 | 92.31 | 0.849 | F1/0 from F4 | 1.09 | 80 | 92.9 | 0.914 |
| Advanced fibrosis (≥F3) | 3.62 | 90.5 | 93.3 | 0.934 | 79.44 | 82.35 | 84.21 | 0.799 | |||||
| Cirrhosis (F4) | 4.15 | 88.9 | 91.4 | 0.882 | 92.43 | 80 | 69.23 | 0.692 | |||||
Sensitivity, specificity, accuracy and AUROC of contrast-enhanced CT detecting fibrosis in different stages. AUROC: receiver operating characteristic curve; CLD: chronic liver dsease; N/A: not applicable.
Sensitivity, specificity and AUROC of TE and ARFI detecting fibrosis in different stages under different cut-off values. AUROC: receiver operating characteristic curve; NAFLD: non-alcoholic fatty liver disease; CHC: chronic hepatitis C; N/A: not applicable.
Sensitivity, specificity and AUROC of MRE, T1 ρ mapping and DWI detecting fibrosis in different stages under different cut-off values. AUROC: receiver operating characteristic curve; NAFLD: non-alcoholic fatty liver disease; PSC: primary sclerosing cholangitis; N/A: not applicable.
Almost some of the newest (and promising) alternative techniques, such as molecular imaging techniques, have not yet been established in clinical practice, and their continued development may ultimately provide a foundation upon which even more techniques could be devised. In general, imaging techniques seem to have a great potential as a reliable alternative to liver biopsy. Tremendous efforts are being made to overcome their confounding factors and improve their accuracy in diagnosing liver fibrosis. Certainly, non-invasive imaging modalities represent a tangible hope for more convenient and accurate surveillance of patients with liver fibrosis and cirrhosis in the future.
FundingThis work was supported by the National Natural Science Foundation of China (Nos. 81270007 to Li F. and 81670513 to Li F.); the Shanghai Talent Development Funds (Grant No. 201304 to Li F.); the Shanghai Rising-Star Program (Grant No. 13QA1400700 to Li F.); and the Shanghai Outstanding Young Talent Plan in Health System (Grant No. 13 YO56 to Li F.).
Conflict of interestNone.
We are indebted to the National Natural Science Foundation of China (Nos. 81270007 to Li F. and 81670513 to Li F.); the Shanghai Talent Development Funds (Grant No. 201304 to Li F.); the Shanghai Rising-Star Program (Grant No. 13QA14007000 to Li F.); and the Shanghai Outstanding Young Talent Plan in Health System (Grant No. 13 YO56 to Li F.) for financial support. We also wish to thank Filipodia Publishing, LLC, for language editing service in English, making the expression in this manuscript more normative.