


Inflammatory bowel disease (IBD) features diverse clinical presentations and progressions, impacting IFX exposure. Understanding IFX serum concentration changes is crucial for tailored monitoring in specific patient groups. The main objective of this study was to analyze ITL trajectories in patients with IBD to identify distinct groups and subgroups, revealing heterogeneity in treatment responses.
MethodsA retrospective cohort study was conducted involving IBD patients treated with infliximab in a regional reference hospital in Spain. Latent class linear mixed models were applied to identify subgroups based on serum infliximab measurements over time. To analyze the factors associated with IFX discontinuation, we employed both logistic regression and Cox regression models.
ResultsThe study included 165 IBD patients, and a total of 799 ITL samples were analyzed. The selected model included three clusters, with a random intercept and a random effect on both time and natural cubic spline time in the linear mixed model. Cluster 1 (20.6%) had lower IFX exposure, with 93.9% experiencing treatment discontinuation, compared to 45.1% in Cluster 2 (43.0%) and 43.3% in Cluster 3 (36.4%) (p<0.001). Treatment discontinuation was observed in 91 individuals (55.2%) out of the total patients. In the multivariate analysis, the presence of cluster 1 was a significant predictor (OR: 7.25, 95% CI: 1.45–36.12). Bayesian dose adjustment was found to significantly reduce the risk of IFX discontinuation (OR: 0.19, 95% CI: 0.46–1.96).
ConclusionsThe lack of TDM during induction and a lower proportion of adjustments made through Bayesian methods were associated with a subgroup demonstrating suboptimal pharmacokinetic profiles and reduced drug persistence. These findings highlight the clinical relevance of model-informed TDM in optimizing IFX exposure and minimizing treatment discontinuation in IBD.
La enfermedad inflamatoria intestinal (EII) presenta una gran heterogeneidad en su manifestación clínica y evolución, lo que impacta en la exposición a infliximab (IFX). Comprender la variabilidad en las concentraciones séricas de IFX es fundamental para una monitorización personalizada en subgrupos específicos de pacientes. El objetivo principal de este estudio fue analizar las trayectorias de concentraciones séricas de IFX en pacientes con EII, identificando distintos grupos y subgrupos que reflejen la heterogeneidad en la respuesta al tratamiento.
MétodosSe realizó un estudio de cohorte retrospectivo en pacientes con EII tratados con infliximab en un hospital de referencia en España. Se aplicaron modelos mixtos lineales de clases latentes para identificar subgrupos basados en las concentraciones séricas de infliximab a lo largo del tiempo. Para evaluar los factores asociados con la discontinuación de IFX, se emplearon modelos de regresión logística y de Cox.
ResultadosSe incluyeron 165 pacientes con EII, con un total de 799 muestras de concentraciones séricas de IFX analizadas. El modelo seleccionado identificó tres clústeres, con un intercepto aleatorio y un efecto aleatorio en el tiempo y en la función spline cúbica natural en el modelo mixto lineal. El Clúster 1 (20,6%) presentó una menor exposición a IFX, con un 93,9% de fracaso terapéutico, en comparación con el 45,1% en el Clúster 2 (43,0%) y el 43,3% en el Clúster 3 (36,4%) (p<0,001). En total, 91 pacientes (55,2%) experimentaron fracaso terapéutico. En el análisis multivariante, la pertenencia al Clúster 1 fue un predictor significativo (OR: 7,25; IC 95%: 1,45-36,12). El ajuste de dosis mediante un método bayesiano redujo significativamente el riesgo de discontinuación de IFX (OR: 0,19; IC 95%: 0,46-1,96).
ConclusionesLa ausencia de monitorización terapéutica de fármacos durante la inducción y un menor uso de ajustes de dosis mediante métodos bayesianos se asociaron con un subgrupo de pacientes con perfiles farmacocinéticos subóptimos y menor persistencia al tratamiento.
Crohn's disease (CD) and ulcerative colitis (UC) are chronic immune-mediated inflammatory bowel diseases (IBD) that exhibit varying courses. The effectiveness of infliximab, the initial anti-tumor necrosis factor alpha (anti-TNF-α) drug approved for treating both CD and UC, has been established.1,2 However, a significant proportion of patients, ranging from 10% to 40%, do not respond to the treatment initially, and over time, 20–40% experience a loss of response, particularly during the first year of maintenance therapy.3
Several research studies suggest a positive association between trough levels of anti-TNF drugs and improved treatment response, lower relapse rates, reduced hospitalizations and surgeries, and enhanced quality of life for IBD patients.4,3,5 The multicenter, prospective, personalized anti-TNF therapy in CD patients study (PANTs), demonstrated that the primary factor independently linked to a lack of initial response to treatment was the presence of low infliximab concentration.6,7 Therapeutic drug monitoring (TDM), defined as the assessment of drug concentrations and antidrug antibodies, is a valuable tool that enables the individual optimization of dosage regimens for drugs with high inter-individual variability, ensuring adequate drug exposure.8,9 In recent years, the incorporation of Bayesian approaches for infliximab dose adjustments has gained significant prominence.10–15 Bayesian methods allow for the estimation of individual pharmacokinetic parameters and could serve as a useful technique to calculate serum concentrations for different doses tailored to a specific patient.16
IBD is a condition characterized by its diverse clinical presentation and progression.17 This variability also affects the exposure to IFX during the course of the disease. The changes in IFX serum concentrations over time represent a complex phenomenon not well-understood in IBD patients. This phenomenon not only significantly impacts the effectiveness of treatment but also plays a crucial role in the duration and consistency of therapeutic response. Understanding the evolution of IFX serum concentrations over time is essential for developing effective monitoring strategies for specific patient groups. Therefore, the objective of this study was to analyze infliximab trough levels (ITL) trajectories in patients with IBD to identify distinct groups and subgroups, revealing heterogeneity in treatment responses. Additionally, the study aimed to investigate baseline clinical characteristics, dose adjustment methods, and other variables associated with the identified groups to discern the factors influencing ITL trajectories.
MethodsStudy designWe conducted a retrospective cohort study involving consecutive IBD patients to determine if there were identifiable subgroups within the IBD patient population based on serum IFX measurements.
The study was conducted at a single center, located in a regional reference hospital in Murcia, southeastern Spain. Data were retrospectively collected from the medical records of patients who initiated treatment with IFX between March 2010 and January 2023. The inclusion criteria were outpatient individuals with inflammatory bowel disease (IBD), aged over 16 years, who had completed the induction phase with a dosage of 5mg/kg at weeks 0, 2, and 6. Patients without ITL or those lacking information related to their clinical responses or laboratory parameters were excluded. The study was approved by the local ethical research committee.
Data collectionVariables recorded at baseline included age, gender, body mass index (BMI), current smoker status, history of previous surgery, diagnosis (CD or UC), Montreal location and disease behavior, presence of perianal disease, extraintestinal manifestations, time to initiate IFX therapy, history of previous biological treatments, concomitant immunosuppressive therapy, and baseline analytical variables such as albumin, C-reactive protein (CRP), fecal calprotectin (FCP), and hemoglobin levels.
The patients were classified into two groups according to the strategy used to optimize the dose of infliximab: TDM-Algorithmic and TDM-Bayesian, as described by Gil-Candel et al.12 From May 2015 to January 2018, the TDM-Algorithmic strategy was applied using an individualized approach guided by the TAXIT algorithm.9 In this TDM-Algorithmic group, the dosage regimen for each patient was adjusted according to their ITL, clinical symptoms, and biochemical parameters to maintain an optimal ITL. Starting in February 2018, the dosing strategy transitioned to a Bayesian prediction approach (TDM-Bayesian), which utilized a previously validated population pharmacokinetic (PopPK) model to optimize dose adjustments. In the TDM-Bayesian group, Bayesian prediction was applied to calculate each patient's individual pharmacokinetic parameters, enabling an estimation of the ITL expected under different dosing regimens and thereby facilitating the selection of a regimen to achieve an optimal ITL. Bayesian prediction was performed using NONMEM software version 7.5 based on the population pharmacokinetic model developed by Fasanmade et al.18 ITL>3μg/ml and >5μg/ml were considered as the optimal cut-off values in CD and UC, respectively.19 These disease-specific thresholds were consistently applied in both the TDM-Algorithmic and TDM-Bayesian groups to guide therapeutic decision-making and dose adjustments.
Serum IFX level measurementBlood samples were collected from all patients before starting the intravenous infusion (as per the clinical pharmacist's criteria). The serum samples were separated into two aliquots and frozen within 2h of collection. Serum ITLs and antibodies to infliximab (ATI) were determined using a commercially available validated enzyme-linked immunosorbent assay (ELISA) kit (Promonitor; Grifols, Spain), following the manufacturer's instructions. When the value was below 0.4μg/ml, the determination of anti-IFX antibodies was performed. This method did not allow for the detection of ATI in the presence of infliximab. The lower limit of quantification of ATI was 5AU/ml.
TDM requests were made at the discretion of the treating physician or clinical pharmacist. All pharmacokinetic reports were prepared by a specialist pharmacist and discussed within multidisciplinary biologics committees to support dose adjustment decisions.
Persistence and classification of reasons for IFX discontinuationThe persistence of IFX treatment, defined as the time interval between initiation and discontinuation of therapy, was determined, and the reasons for treatment discontinuation were described. The reasons for discontinuation were classified as pharmacodynamic failure, pharmacokinetic failure (whether mediated by antibodies or not), adverse effects, and loss to follow-up. Pharmacodynamic failure was defined as a lack of response to IFX despite the drug being at an optimal therapeutic level. Pharmacokinetic failure was characterized by drug levels being lower than desired. This could be due to immunological causes, such as the formation of anti-IFX antibodies, or other reasons such as increased drug clearance from the body. Adverse effects leading to discontinuation of therapy were considered when significant side effects necessitated stopping IFX treatment. Loss to follow-up was defined as patients discontinuing treatment or being lost during the follow-up period without adequate documentation or communication with the healthcare provide
Statistical analysisIdentification of ITL trajectories during follow-up periodWe estimated a series of latent class linear mixed models (LCMM) to identify subgroups of ITL trajectories over time (serum IFX values were square root transformed to remove non normality before the models were fitted). These models were shaped with 1–7 latent clusters, considering polynomials (linear, and quadratic) and natural cubic splines (with 3 and 5df) to capture the longitudinal patterns, with different variance-covariance structures for the random-effects. These models were fit using the hlme function of the lcmm package in R.20
We selected the optimal model and number of clusters based on following criteria: (a) Bayesian Information Criterion (BIC, lower value indicates better fit, but a reduction of BIC of at least 10 points was necessary in the competing model); (b) average posterior probability of cluster membership (>0.7 for each cluster); (c) the odds of correct classification (>5 for each cluster); (d) cluster size (≥5% of participants in the smallest cluster); (e) relative entropy (values closer to 1 reflect better fit), and (f) model parsimony and interpretability.21
Patients’ baseline characteristics were compared between latent classes, including patients with a single measure of IFX levels at baseline because excluding them from the analysis may induce a biased estimation of the mean baseline of serum IFX level in the population. Quantitative data was compared by chi square test for categorical variables (with continuity correction) and one way ANOVA test for continuous variables (with equal variance assumption). In case of nonnormal variables and small cell counts, Kruskal–Wallis rank-sum test was used for the nonnormal continuous variables, and Fisher's exact test was used for categorical variables.
To analyze the factors associated with IFX discontinuation, we employed Cox proportional hazards regression models, which are appropriate for time-to-event data with variable follow-up durations and censored observations. Initially, univariate Cox regression analyses were performed to identify candidate variables associated with treatment discontinuation. Variables with a p-value less than 0.05 in the univariate analysis were considered for inclusion in the multivariate Cox model to adjust for potential confounders. Hazard ratios (HR) with 95% confidence intervals (CI) were calculated to estimate the relative risk of discontinuation over time. Kaplan–Meier survival curves were generated to visualize time to IFX discontinuation across patient subgroups, and the log-rank test was used to assess statistical differences between groups.
All analyses were conducted in SPSS (version 23) and LCMM were performed using the R statistical software (version 4.1.1) using the hlme function of the lcmm package. The R code utilized in this study was based on the approach described by Constantine et al.17 We followed the GRoLTS checklist for reporting latent trajectory studies.22
ResultsOut of a total of 173 initially selected patients, 8 were excluded due lack of information ITL levels (5 patients) and loss of follow-up at our center (3 patients). Therefore, 165 IBD patients were included in the study, 57.0% of whom were male, with a mean age at the start of IFX treatment of 40.8 (SD: 15.0) years. Among the patients, 97 (58.8%) were diagnosed with CD, most commonly in the ileocolonic region (47.4%), while 68 (41.2%) had ulcerative colitis, predominantly pancolitis (52.9%). Baseline demographics of the study population are summarized in Table 1.
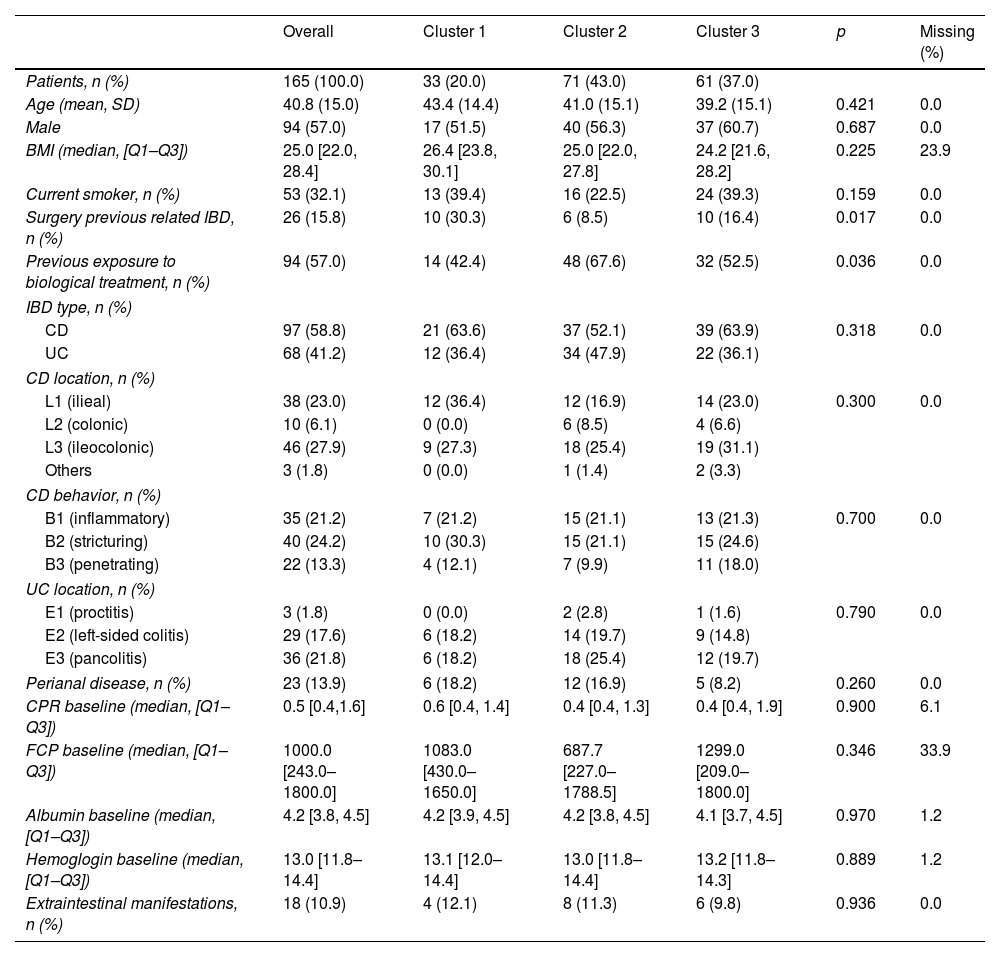
Distribution of clusters and baseline variables in the study population.
| Overall | Cluster 1 | Cluster 2 | Cluster 3 | p | Missing (%) | |
|---|---|---|---|---|---|---|
| Patients, n (%) | 165 (100.0) | 33 (20.0) | 71 (43.0) | 61 (37.0) | ||
| Age (mean, SD) | 40.8 (15.0) | 43.4 (14.4) | 41.0 (15.1) | 39.2 (15.1) | 0.421 | 0.0 |
| Male | 94 (57.0) | 17 (51.5) | 40 (56.3) | 37 (60.7) | 0.687 | 0.0 |
| BMI (median, [Q1–Q3]) | 25.0 [22.0, 28.4] | 26.4 [23.8, 30.1] | 25.0 [22.0, 27.8] | 24.2 [21.6, 28.2] | 0.225 | 23.9 |
| Current smoker, n (%) | 53 (32.1) | 13 (39.4) | 16 (22.5) | 24 (39.3) | 0.159 | 0.0 |
| Surgery previous related IBD, n (%) | 26 (15.8) | 10 (30.3) | 6 (8.5) | 10 (16.4) | 0.017 | 0.0 |
| Previous exposure to biological treatment, n (%) | 94 (57.0) | 14 (42.4) | 48 (67.6) | 32 (52.5) | 0.036 | 0.0 |
| IBD type, n (%) | ||||||
| CD | 97 (58.8) | 21 (63.6) | 37 (52.1) | 39 (63.9) | 0.318 | 0.0 |
| UC | 68 (41.2) | 12 (36.4) | 34 (47.9) | 22 (36.1) | ||
| CD location, n (%) | ||||||
| L1 (ilieal) | 38 (23.0) | 12 (36.4) | 12 (16.9) | 14 (23.0) | 0.300 | 0.0 |
| L2 (colonic) | 10 (6.1) | 0 (0.0) | 6 (8.5) | 4 (6.6) | ||
| L3 (ileocolonic) | 46 (27.9) | 9 (27.3) | 18 (25.4) | 19 (31.1) | ||
| Others | 3 (1.8) | 0 (0.0) | 1 (1.4) | 2 (3.3) | ||
| CD behavior, n (%) | ||||||
| B1 (inflammatory) | 35 (21.2) | 7 (21.2) | 15 (21.1) | 13 (21.3) | 0.700 | 0.0 |
| B2 (stricturing) | 40 (24.2) | 10 (30.3) | 15 (21.1) | 15 (24.6) | ||
| B3 (penetrating) | 22 (13.3) | 4 (12.1) | 7 (9.9) | 11 (18.0) | ||
| UC location, n (%) | ||||||
| E1 (proctitis) | 3 (1.8) | 0 (0.0) | 2 (2.8) | 1 (1.6) | 0.790 | 0.0 |
| E2 (left-sided colitis) | 29 (17.6) | 6 (18.2) | 14 (19.7) | 9 (14.8) | ||
| E3 (pancolitis) | 36 (21.8) | 6 (18.2) | 18 (25.4) | 12 (19.7) | ||
| Perianal disease, n (%) | 23 (13.9) | 6 (18.2) | 12 (16.9) | 5 (8.2) | 0.260 | 0.0 |
| CPR baseline (median, [Q1–Q3]) | 0.5 [0.4,1.6] | 0.6 [0.4, 1.4] | 0.4 [0.4, 1.3] | 0.4 [0.4, 1.9] | 0.900 | 6.1 |
| FCP baseline (median, [Q1–Q3]) | 1000.0 [243.0–1800.0] | 1083.0 [430.0–1650.0] | 687.7 [227.0–1788.5] | 1299.0 [209.0–1800.0] | 0.346 | 33.9 |
| Albumin baseline (median, [Q1–Q3]) | 4.2 [3.8, 4.5] | 4.2 [3.9, 4.5] | 4.2 [3.8, 4.5] | 4.1 [3.7, 4.5] | 0.970 | 1.2 |
| Hemoglogin baseline (median, [Q1–Q3]) | 13.0 [11.8–14.4] | 13.1 [12.0–14.4] | 13.0 [11.8–14.4] | 13.2 [11.8–14.3] | 0.889 | 1.2 |
| Extraintestinal manifestations, n (%) | 18 (10.9) | 4 (12.1) | 8 (11.3) | 6 (9.8) | 0.936 | 0.0 |
SD: standard deviation; Q1: first quartile (25th percentile); Q3: third quartile (75th percentile); BMI: body mass index; IBD: inflammatory bowel disease; CD: Crohn's disease; UC: ulcerative; CRP: reactive protein; FCP: fecal calprotectin.
A total of 799 samples of ITLs were analyzed during the follow-up period, with a median follow-up duration of 29.7 months [7.7–61.4]. The median frequency of ITL measurements for a patient during this period was 3 [2.0–8.0]. Of these samples, 64 (8%) were collected during the induction phase, while the majority, 735 (92%), were obtained during the maintenance phase. Fig. S1 shows the temporal evolution of ITL according to TDM methods (TDM Bayesian and TDM induction period).
Trajectories of infliximab trough level and differential baseline clinical featuresLCMMs with assumed clusters ranging from 2 to 6 all converged based on the default convergence criteria. The selected model included three clusters, with a random intercept and a random effect on both time and natural cubic spline time in the linear mixed model, with cluster-specific fixed effects of both time and natural cubic spline time on transformed square-root ITL trajectory. The variance-covariance of the random-effects was common over latent clusters and non-structured. A full model description is provided in the Supplementary Appendix (Figs. S2–S10, Tables S1 and S2).
In our analysis, Cluster 1, representing 20.6% of the patients, was characterized by lower exposure to IFX compared to the other clusters. In contrast, both Cluster 2 (43.0%) and Cluster 3 (36.4%) exhibited adequate exposure to IFX. However, In Cluster 2, more stable trajectories were observed during the follow-up period (Fig. 1). Among the baseline characteristics analyzed, significant differences were observed in two aspects. Previous surgery was notably higher in Cluster 1 (30.3%) compared to Cluster 2 (8.5%) and Cluster 3 (16.5%) (p=0.017). The other variable with statistical significance was the previous exposure to biological, which was higher for Cluster 1 (57.6%) compared to Cluster 2 (23.4%) and Cluster 3 (47.5%) (p=0.032).
 transformed infliximab trough level (ITL) latent cluster trajectories IBD cohort (A) grouped, (B) cluster 1, (C) cluster 2, and (D) cluster 3. The red solid line represents the predicted mean trajectory for each group, while the red dotted lines represent 95% confidence intervals. The gray lines indicate the trajectory of each subject. The blue dotted line indicates an ITL of 3μg/ml.")
Square-root (Sqrt) transformed infliximab trough level (ITL) latent cluster trajectories IBD cohort (A) grouped, (B) cluster 1, (C) cluster 2, and (D) cluster 3. The red solid line represents the predicted mean trajectory for each group, while the red dotted lines represent 95% confidence intervals. The gray lines indicate the trajectory of each subject. The blue dotted line indicates an ITL of 3μg/ml.
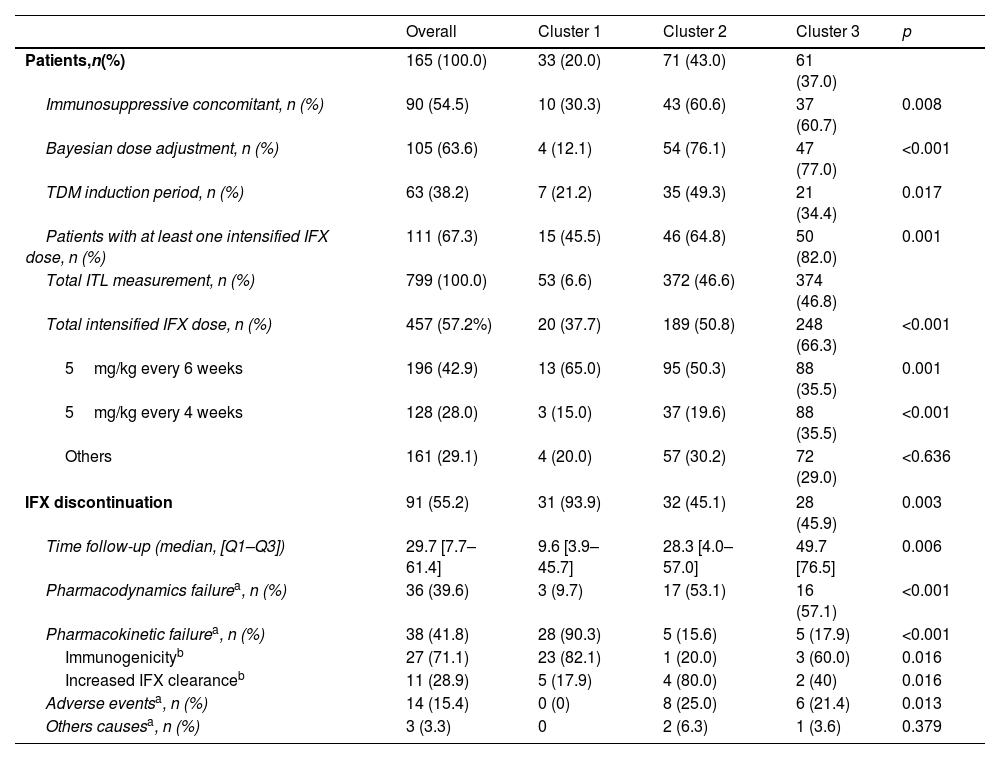
Regarding the dose adjustment method specific to each cluster, it was observed that the Bayesian approach was significantly less frequent in Cluster 1 (12.1%) than in Clusters 2 (76.1%) and 3 (77.0%; p<0.001). The TDM induction period was more common in Cluster 2 (49.3%) compared to Clusters 1 (21.2%) and 3 (34.4%; p=0.017). A total of 457 out of 799 measurements of ITLs (57.2%) resulted in intensified IFX dose, affecting 67.3% of patients, with Cluster 3 showing the highest rate at 82.0%, compared to 45.5% in Cluster 1 (p<0.001). The most common intensified regimens were 5mg/kg every 6 weeks (24.5%) and every 4 weeks (16.08%) (Table 2).
Associations of variables related to TDM methods and IFX discontinuation in identified groups influencing ITL trajectories.
| Overall | Cluster 1 | Cluster 2 | Cluster 3 | p | |
|---|---|---|---|---|---|
| Patients,n(%) | 165 (100.0) | 33 (20.0) | 71 (43.0) | 61 (37.0) | |
| Immunosuppressive concomitant, n (%) | 90 (54.5) | 10 (30.3) | 43 (60.6) | 37 (60.7) | 0.008 |
| Bayesian dose adjustment, n (%) | 105 (63.6) | 4 (12.1) | 54 (76.1) | 47 (77.0) | <0.001 |
| TDM induction period, n (%) | 63 (38.2) | 7 (21.2) | 35 (49.3) | 21 (34.4) | 0.017 |
| Patients with at least one intensified IFX dose, n (%) | 111 (67.3) | 15 (45.5) | 46 (64.8) | 50 (82.0) | 0.001 |
| Total ITL measurement, n (%) | 799 (100.0) | 53 (6.6) | 372 (46.6) | 374 (46.8) | |
| Total intensified IFX dose, n (%) | 457 (57.2%) | 20 (37.7) | 189 (50.8) | 248 (66.3) | <0.001 |
| 5mg/kg every 6 weeks | 196 (42.9) | 13 (65.0) | 95 (50.3) | 88 (35.5) | 0.001 |
| 5mg/kg every 4 weeks | 128 (28.0) | 3 (15.0) | 37 (19.6) | 88 (35.5) | <0.001 |
| Others | 161 (29.1) | 4 (20.0) | 57 (30.2) | 72 (29.0) | <0.636 |
| IFX discontinuation | 91 (55.2) | 31 (93.9) | 32 (45.1) | 28 (45.9) | 0.003 |
| Time follow-up (median, [Q1–Q3]) | 29.7 [7.7–61.4] | 9.6 [3.9–45.7] | 28.3 [4.0–57.0] | 49.7 [76.5] | 0.006 |
| Pharmacodynamics failurea, n (%) | 36 (39.6) | 3 (9.7) | 17 (53.1) | 16 (57.1) | <0.001 |
| Pharmacokinetic failurea, n (%) | 38 (41.8) | 28 (90.3) | 5 (15.6) | 5 (17.9) | <0.001 |
| Immunogenicityb | 27 (71.1) | 23 (82.1) | 1 (20.0) | 3 (60.0) | 0.016 |
| Increased IFX clearanceb | 11 (28.9) | 5 (17.9) | 4 (80.0) | 2 (40) | 0.016 |
| Adverse eventsa, n (%) | 14 (15.4) | 0 (0) | 8 (25.0) | 6 (21.4) | 0.013 |
| Others causesa, n (%) | 3 (3.3) | 0 | 2 (6.3) | 1 (3.6) | 0.379 |
ITL: infliximab trough levels; SD: standard deviation; UA: unity activity; TDM: therapeutic drug monitoring.
Treatment discontinuation was observed in 91 individuals (55.2%) out of the total patients. Notably, in cluster 1, 93.9% of patients experienced IFX discontinuation, while in clusters 2 and 3 were 45.1% and 43.3%, respectively (p<0.001). The reasons for IFX discontinuation were pharmacokinetic failure (41.8%), of which 71.1% mediated by antibodies, pharmacodynamic failure (29.7%), and adverse effects (15.4%) (Table 2). Class 1 had the highest incidence of pharmacokinetic failure at 90.3%, significantly higher than Class 2 and Class 3 (15.6% and 17.9%, respectively). This high level of antibody formation in Class 1 is strongly associated with the elevated rate of treatment discontinuation in this group, primarily driven by the presence of anti-IFX antibodies, which affected 82.1% of the patients in Class 1. In contrast, Class 2 and Class 3 were characterized by pharmacodynamic failure as the leading cause of discontinuation, responsible for 37.5% and 53.6% of cases, respectively. The adverse effects observed included infections (2 patients), dermatological causes (11 patients), and arthralgia (1 patient).
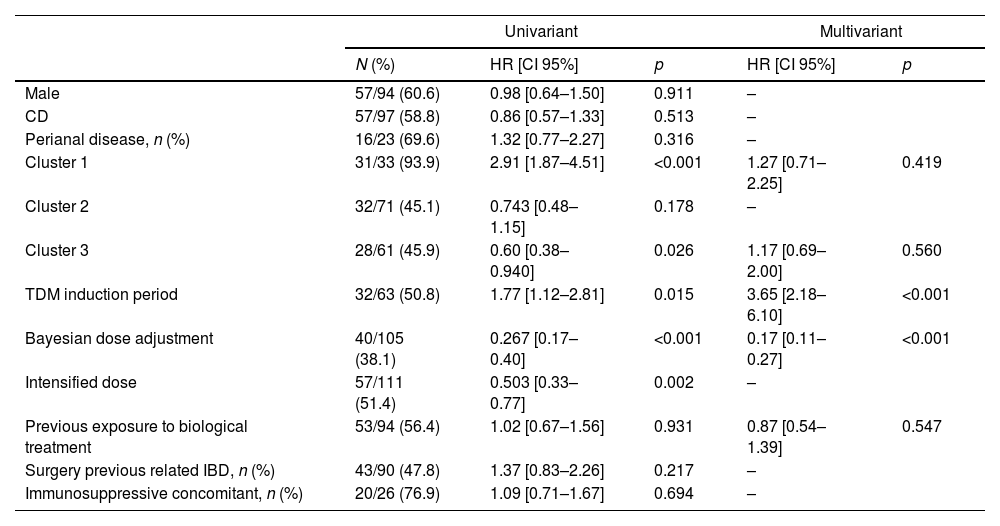
The median follow-up time was significantly longer in cluster 3 (49.7 months [9.2–76.5]) compared to cluster 1 (9.6 months [3.9–45.7]) and cluster 2 (28.3 months, [8.7–57.0]; p=0.006). The univariate Cox regression analysis identified several significant factors associated with IFX discontinuation. Specifically, belonging to cluster 1 was significantly associated with a higher risk of IFX discontinuation (HR=2.91, 95% CI [1.87–4.51]), as was TDM during the induction period (HR=1.77, 95% CI [1.12–2.81]). Conversely, cluster 3 was associated with a lower risk of discontinuation therapy (HR=0.60, 95% CI [0.38–0.94]), and Bayesian dose adjustment showed a strong association with a reduced risk of failure (HR=0.267, 95% CI [0.17–0.40]). In the multivariate analysis, TDM during the induction period remained significantly associated with a higher risk of discontinuation therapy (HR=3.65, 95% CI [2.18–6.10]), and Bayesian dose adjustment continued to show a protective effect (HR=0.17, 95% CI [0.11–0.27]) (Table 3). To further illustrate these findings, Kaplan–Meier survival curves for the significant variables (subgroups of ITL trajectories, Bayesian dose adjustment, and TDM induction period) are presented in Fig. 2.
Univariate and multivariate Cox regression analysis of factors associated with IFX discontinuation.
| Univariant | Multivariant | ||||
|---|---|---|---|---|---|
| N (%) | HR [CI 95%] | p | HR [CI 95%] | p | |
| Male | 57/94 (60.6) | 0.98 [0.64–1.50] | 0.911 | – | |
| CD | 57/97 (58.8) | 0.86 [0.57–1.33] | 0.513 | – | |
| Perianal disease, n (%) | 16/23 (69.6) | 1.32 [0.77–2.27] | 0.316 | – | |
| Cluster 1 | 31/33 (93.9) | 2.91 [1.87–4.51] | <0.001 | 1.27 [0.71–2.25] | 0.419 |
| Cluster 2 | 32/71 (45.1) | 0.743 [0.48–1.15] | 0.178 | – | |
| Cluster 3 | 28/61 (45.9) | 0.60 [0.38–0.940] | 0.026 | 1.17 [0.69–2.00] | 0.560 |
| TDM induction period | 32/63 (50.8) | 1.77 [1.12–2.81] | 0.015 | 3.65 [2.18–6.10] | <0.001 |
| Bayesian dose adjustment | 40/105 (38.1) | 0.267 [0.17–0.40] | <0.001 | 0.17 [0.11–0.27] | <0.001 |
| Intensified dose | 57/111 (51.4) | 0.503 [0.33–0.77] | 0.002 | – | |
| Previous exposure to biological treatment | 53/94 (56.4) | 1.02 [0.67–1.56] | 0.931 | 0.87 [0.54–1.39] | 0.547 |
| Surgery previous related IBD, n (%) | 43/90 (47.8) | 1.37 [0.83–2.26] | 0.217 | – | |
| Immunosuppressive concomitant, n (%) | 20/26 (76.9) | 1.09 [0.71–1.67] | 0.694 | – | |
CD: Crohn's disease; TDM: therapeutic drug monitoring; IBD: inflammatory bowel disease.
 subgroups of ITL trajectories, (b) Bayesian dose adjustment, and (c) TDM induction period.")
In order to explore potential baseline differences between patients with and without TDM during the induction phase, we performed a sensitivity analysis comparing these two subgroups (Supplementary Table S3). Patients who underwent TDM during induction had significantly higher rates of prior exposure to biologic therapies (100% vs. 30.4%, p<0.001) and more frequent use of concomitant immunosuppressants (73.0% vs. 43.1%, p<0.001). No significant differences were found in sex, disease type, perianal disease, or prior surgery.
A sensitivity analysis was performed to assess the potential impact of changes in clinical practice over time (Supplementary Appendix, Table S4). Patients were stratified into two cohorts based on the year of treatment initiation (2010–2016 vs. 2017–2023). A significantly higher proportion of patients treated in the earlier period were classified in Cluster 1 (32.0% vs. 14.8%, p=0.011) and experienced treatment discontinuation (70.0% vs. 48.7%, p=0.011). This group also had lower rates of Bayesian TDM (44.0% vs. 72.2%, p<0.001), TDM during induction (0.0% vs. 54.8%, p<0.001), and immunosuppressive co-treatment (30.0% vs. 65.2%, p<0.001). No significant differences were observed in baseline disease characteristics.
DiscussionIn this study, three distinct clusters were identified among IBD patients following unique trajectories in ITL during the follow-up period. To the best of our knowledge, we are the first to apply LCMMs to characterize latent patient heterogeneity using infliximab trough level data. This innovative approach has enabled us to uncover previously unrecognized patterns in the evolution of infliximab concentrations over time, providing valuable insights into the heterogeneity within the IBD patient population.
Among the three identified clusters, Cluster 1, representing 20.6% of the patients, exhibited an unfavorable pharmacokinetic profile, with ITL levels consistently below the optimal thresholds (>3μg/ml in CD and >5μg/ml in UC).19 An exploratory comparison of baseline characteristics revealed that patients in this group were more likely to have a history of intestinal surgery, to be on IFX monotherapy, and to have received neither TDM during induction nor Bayesian-guided dose adjustment. These findings suggest that certain clinical features present at treatment initiation may help identify patients at higher risk of developing suboptimal exposure profiles. Although the cluster classification was based solely on longitudinal ITL trajectories and was not designed as a predictive tool, the associations observed underscore the potential utility of early risk stratification and proactive TDM to prevent therapeutic failure in high-risk subgroups.
In our study, disease-specific thresholds were applied: >3μg/ml for CD and >5μg/ml for UC, consistent with the evidence available at the time. However, current recommendations from the GETECCU group suggest trough levels>5μg/ml for clinical remission and 7–10μg/ml for endoscopic healing.24 This evolution in therapeutic targets must be taken into account when interpreting our findings, particularly given that our cohort spans the period 2010–2023.
In our study, treatment discontinuation occurred in 55.2% of patients, indicating a substantial rate of therapeutic failure. This percentage was notably higher in Cluster 1, where treatment discontinuation reached 93.9%, while in Clusters 2 and 3, it was 45%. In the PANTS study, the treatment failure rate was 28.8% at one year, increasing to 45.9% at three years.6,7 The primary causes of IFX discontinuation identified in our study were pharmacokinetic failure, observed in 41.8% of patients, with 71.1% of these cases mediated by anti-IFX antibodies, highlighting the significant role of immunogenicity in treatment discontinuation. Specifically, in Cluster 1, pharmacokinetic failure accounted for more than 90% of the cases, with immunogenicity being present in over 80% of these pharmacokinetic failure cases.
Many studies have demonstrated the relationship between low levels of IFX and the development of antibodies, which can lead to the loss of response to treatment and, ultimately, therapeutic failure.4,3,5–7 In our study, it was observed that 16.4% (27 out of 165) of the patients developed anti-IFX antibodies. It is important to note that this prevalence is lower compared to previous studies. However, it is crucial to consider that these differences can be primarily attributed to disparities between assays (drug-sensitive/drug-tolerance), the timing of anti-drug antibody testing, as well as differences in the study design, which could have contributed to the observed fluctuations.23
Our results align with previous research that emphasizes the utility of Bayesian approaches in optimizing IFX dosing for patients with IBD. The PRECISION trial,10 for instance, demonstrated the effectiveness of a Bayesian dashboard for IFX dosing in maintenance treatment, showing a significantly higher proportion of patients maintaining clinical remission during one year of follow-up compared to standard dosing. Similarly, Dubinsky et al.11 highlighted the importance of a pharmacokinetic dashboard during induction, indicating that early optimization of dosing can enhance IFX durability and reduce immunogenicity. Additionally, Santacana et al.12 confirmed that IFX therapeutic drug monitoring combined with Bayesian forecasting improved short-term clinical responses in real-world IBD patients. Finally, in a study conducted by our group, a dosing strategy utilizing the Bayesian method resulted in markedly higher optimal infliximab levels compared to an algorithm-based strategy.13 These findings underscore the importance of adopting Bayesian adjustment methods in clinical practice, emphasizing their significant capacity to improve clinical outcomes and reduce complications in patients with IBD, both in the initial stages and throughout the follow-up phases of infliximab treatment.14,15,25,26
A sensitivity analysis based on treatment initiation period (2010–2016 vs. 2017–2023) showed that patients treated in the earlier years had a significantly higher rate of IFX discontinuation and were more frequently classified in the low-exposure pharmacokinetic cluster. These patients also received less proactive TDM and fewer immunosuppressive co-treatments, reflecting the more limited therapeutic tools and monitoring strategies available at that time. Although this temporal variability could represent a potential confounding factor, it also highlights the positive clinical impact of the progressive adoption of model-informed TDM strategies on IFX exposure and long-term treatment outcomes.
In our study, Cox regression analysis showed that TDM during the induction phase was associated with reduced IFX persistence. This finding could be attributed to the fact that TDM in the induction phase enables the early identification of primary non-responders, whether due to pharmacokinetic or pharmacodynamic factors.27 By detecting these patients early, it becomes possible to switch drugs or therapeutic targets in a timely manner, thereby avoiding unnecessary administration of IFX and reducing exposure to an ineffective treatment. Additionally, a comparative analysis of baseline characteristics between patients with and without TDM during induction revealed a significantly higher frequency of prior biologic exposure and use of concomitant immunosuppressants in the TDM group. These differences suggest a potential indication bias, as early TDM was more frequently applied in patients with higher clinical complexity, which could partially explain the observed lower persistence.
The limitations of this study include its retrospective design, which may introduce observational biases. Therefore, the obtained results should not be interpreted as causal and could be influenced by such biases. Despite this limitation, the identified clusters in this study serve as valuable tools for understanding the diverse patterns within the IBD patient population and are not intended for predictive purposes or as components of a risk assessment score. This limitation underscores the need for future research to identify and consider additional variables that could impact treatment trajectories in patients with inflammatory bowel disease. Another limitation of this study is the variability in treatment initiation years among patients, ranging from 2010 to 2023. This temporal disparity may introduce confounding factors, as changes in clinical practices and treatment guidelines over time could influence treatment response and persistence, potentially affecting the comparability of results across different patient cohorts. Lastly, another limitation of our study is the lack of activity indices and fecal calprotectin data at different study periods, which prevented us from comprehensively evaluating the response to treatment. However, we consider that the use of drug persistence as a measure to evaluate treatment response can be a valid approach, as it reflects real-world effectiveness by considering both the therapeutic benefit and the tolerability of the medication over time.
In conclusion, this study has demonstrated the exceptional utility of latent class analysis in identifying distinct trajectories in infliximab serum levels ITL among IBD. The group with a poor pharmacokinetic profile was associated with a low frequency of TDM during the induction phase and a lower proportion of adjustments made through Bayesian methods. To validate the benefits of proactive TDM, further prospective studies are essential.
Ethical considerationsThe study was approved by Research Ethics Committee of Area VII (Murcia-East) of the Murcian Health Service.
FundingNone.
Conflict of interestCIN declares that he have received fees from Janssen for participating as a speaker at scientific events RGE has received speaker fees from Amgen, Takeda and Janssen. INP has received speaker fees from Amgen and Takeda. The other authors declare no conflict of interests.
We would like to express our heartfelt gratitude to Dr. Manuel Madrigal Torres for his invaluable and selfless contribution to the statistical analysis and interpretation of results. His expertise and dedication have been instrumental in shaping the analytical framework of this study. Dr. Madrigal Torres's unparalleled commitment to advancing the field of statistics has greatly enriched the quality of our research. We are deeply appreciative of his guidance, which has significantly enhanced the depth and precision of our findings.
The followings are the supplementary data to this article: