


Inexpensive blood tests have been well established as alternatives to liver biopsies to evaluate liver fibrosis in CHB patients. Here, we aim to compare their diagnostic accuracy in assessing liver fibrosis and necroinflammation.
Patients and methodsA retrospective study was performed to evaluate the predictive value of non-invasive models in chronic hepatitis B patients with liver fibrosis by the area under receiver operating characteristic curve (AUROC). The clinical data of 160 patients were collected from medical records.
ResultsOf the 160 consecutive treatment-naïve CHB patients, 29 (16%) had significant fibrosis and 34 (21%) had severe necroinflammation. The AUROC of the gamma-glutamyl transpeptidase to platelet ratio (GPR) (0.761, 95% CI 0.671–0.850) for predicting significant fibrosis was significantly higher than that of the aspartate transaminase-to-platelet ratio index (APRI) (0.680, 95% CI 0.585–0.774, p=0.034), but comparable with the fibrosis index based on four factors (Fib-4) (0.746, 95% CI 0.656–0.836, p=0.703), while for predicting severe necroinflammation, the performance of the GPR (AUROC=0.869, 95% CI 0.800–0.937) was better than the APRI (AUROC=0.816, 95% CI 0.740–0.892, p=0.085) and Fib-4 (0.792, 95% CI 0.711–0.873, p=0.023).
DiscussionGPR is a satisfactory model to stage liver fibrosis and to grade necroinflammation activity, representing a convenient non-invasive alternative to liver biopsy in China.
los análisis de sangre asequibles se han consolidado como alternativas a la biopsia hepática para evaluar la fibrosis hepática en pacientes con HBC. En este caso, nuestro objetivo es comparar su precisión diagnóstica en la evaluación de la fibrosis hepática y en la necroinflamación.
Pacientes y métodosse realizó un estudio retrospectivo para evaluar el valor pronóstico de los modelos no invasivos en pacientes con hepatitis B crónica con fibrosis hepática en el área bajo la curva de rendimiento diagnóstico (AUROC). Se recopilaron los datos clínicos de 160 pacientes a partir de las historias clínicas.
ResultadosDe 160 pacientes HBC que no habían recibido tratamiento consecutivo, 29 (16%) presentaron una importante fibrosis y 34 (21%), necroinflamación grave. La AUROC de la gammaglutamiltranspeptidasa respecto a la proporción de plaquetas (GPR) (0,761; IC95%: 0,671-0,850) para pronosticar una fibrosis importante fue considerablemente más alta que el índice de relación aspartato-transaminasa-plaquetas (APRI) (0,680; IC95%: 0,585-0,774; p=0,034), pero comparable con el índice de fibrosis basado en cuatro factores (Fib-4) (0,746; IC95%: 0,656-0,836; p=0,703), mientras que para el pronóstico de la necroinflamación grave, el rendimiento de GPR (AUROC=0,869; IC95%: 0,800-0,937) fue mejor que el de APRI (AUROC=0,816; IC95%: 0,740-0,892; p=0,085) y el de Fib-4 (0,792; IC95%: 0,711-0,873; p=0,023).
Discusiónel GPR es un modelo satisfactorio para clasificar la fibrosis hepática y para calificar la actividad de la necroinflamación, y representa una alternativa práctica y no invasiva a la biopsia hepática en China.
Chronic infection of hepatitis B virus (HBV) remains a major health problem affecting more than 250 million people worldwide who are at increased risk of developing fibrosis, cirrhosis and hepatocellular carcinoma.1 Identification of individuals with significant HBV-related liver disease and subsequent initiation of treatment with antiviral drugs are crucial to reduce the disease burden. Liver biopsy is currently the gold standard for determining the histological severity of liver damage, and therefore plays an important role in determining whether a patient need antiviral treatment in some conditions, but it is limited by its high cost and risk as an invasive procedure. Thus, economical and non-invasive methods to assess liver fibrosis are needed. Aspartate transaminase (AST)-to-platelet ratio index (APRI) and fibrosis index based on four factors (Fib-4) scores are frequently engaged methods of this kind and were recommended by some CHB management guidelines.2–4 However, APRI and Fib-4 were originally developed in hepatitis C virus (HCV) infection or HCV and human immunodeficiency virus (HIV) co-infection patients and were revealed not suitable for evaluating liver fibrosis according to Ishak stage.5,6 The recently proposed non-invasive models-red cell distribution width (RDW) to platelet ratio (RPR) and gamma-glutamyl transpeptidase (GGT) to platelet ratio (GPR),7–9 though have favorable performance in reported patients cohort, remain needs external validation. In addition, whether they are suitable to evaluate liver necroinflammation needs further assessment. Therefore, we here aim to compare their diagnostic accuracy in assessing liver fibrosis and necroinflammation in the present study.
Patients and methodsPatients and data collectionFrom May 2013 to May 2015, 337 consecutive CHB patients who underwent liver biopsy to evaluate the severity of fibrosis and necroinflammation at Huashan Hospital, Fudan University were enrolled in the study. CHB (defined as chronic necroinflammatory disease of the liver caused by persistent infection with HBV) is diagnosed according to the Asian-Pacific clinical practice guidelines on the management of hepatitis B.2 Demographic and laboratory data of all subjects were collected from the medical records within 3 days of liver biopsy. The exclusion criteria in this study include: co-infection of HCV, hepatitis D virus or HIV; coexistence of alcoholic liver disease, autoimmune hepatitis, drug-induced liver injury, metabolic liver disease, hepatocellular carcinoma (HCC); liver transplantation. Patients who received anti-HBV treatment were also excluded. The study was approved by the Ethical Committee of Huashan Hospital, Fudan University.
Liver biopsyPercutaneous liver biopsy was performed using 16G biopsy needle and guided by ultrasonography after written informed consent. Scheuer's scoring system was adopted to assess the degree of liver necroinflammation activity and fibrosis stage. Significant liver fibrosis was defined as fibrosis stage >S2 while severe necroinflammation activity was defined as necroinflammation grade >G2.
Noninvasive model calculationsFib-4=(Age (years)×AST (IU/L))/(platelets count (109/L)×(ALT (IU/L))1/2)
APRI=(AST (IU/L)/ULN)×100/platelets count (109/L)
GPR=(GGT (IU/L)/ULN)×100/platelets count (109/L)
RPR=RDW (%)/platelets count (109/L)
Statistical analysisData analysis was performed by using SPSS version 19.0 software. Continuous variables were presented as mean±standard deviation. Categorical variables were expressed as frequency and percentage. Comparisons between groups were performed using Student's t-test for continuous variables and the Chi-square test for categorical variables. The correlation coefficients (r) were assessed by Spearman correlation. The performance of non-invasive models was evaluated and compared by receiver operating characteristic (ROC) curves and the area under the ROC curves (AUROCs), Youden index was engaged to determine the optimal cut-off. P values <0.05 were considered statistically significant.
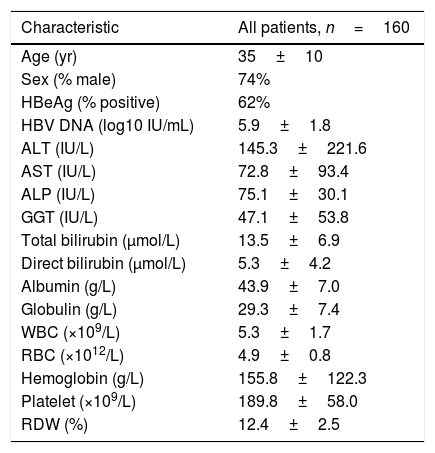
ResultsPatient characteristicsA total of 337 chronic hepatitis patients who had undergone liver biopsy were enrolled in the study. After exclusion of patients with prior or current antiviral treatment (n=101), hepatitis C virus co-infection (n=54), insufficient data (n=12), HCC (n=5), autoimmune hepatitis (n=3) and alcoholic liver disease (n=2), 160 patients were finally subjected to further analysis, thirty-eight of the patients had a fibrosis stage of S0, 42 had S1, 51 had S2, 14 had S3, and 13 had S4; for necroinflammation grade, 15 had G0, 46 had G1, 65 had G2, 31 had G3, and 3 had G4. The baseline characteristics for all subjects are shown in Table 1. Next, a comparison of baseline characteristics between patients who meet the criteria with either S>2 or G>2 and those who do not meet the criteria were performed (Table S1). The results revealed that in patients who meet the criteria, the levels of AST (114.7±120.1 vs 60.1±80.1IU/L, p=0.013), ALP (89.8±41.6 vs 70.7±24.2IU/L, p=0.011), GGT (85.0±68.4 vs 35.7±42.8IU/L, p=0.000) and total bilirubin (15.9±8.7 vs 12.8±6.1μmol/L, p=0.045) were significantly higher than that in patients who do not meet the criteria, while the levels of albumin (40.9±7.7 vs 44.7±6.6g/L, p=0.003), RBC (4.6±0.9 vs 4.9±0.7 1012/L, p=0.030) and platelet (167.7±65.8 vs 196.5±54.0 109/L, p=0.007) were significantly higher in patients who do not meet the criteria than that in patients who meet the criteria. However, HBV DNA levels between the two groups had no significant difference.
Characteristics of patients at baseline.
| Characteristic | All patients, n=160 |
|---|---|
| Age (yr) | 35±10 |
| Sex (% male) | 74% |
| HBeAg (% positive) | 62% |
| HBV DNA (log10 IU/mL) | 5.9±1.8 |
| ALT (IU/L) | 145.3±221.6 |
| AST (IU/L) | 72.8±93.4 |
| ALP (IU/L) | 75.1±30.1 |
| GGT (IU/L) | 47.1±53.8 |
| Total bilirubin (μmol/L) | 13.5±6.9 |
| Direct bilirubin (μmol/L) | 5.3±4.2 |
| Albumin (g/L) | 43.9±7.0 |
| Globulin (g/L) | 29.3±7.4 |
| WBC (×109/L) | 5.3±1.7 |
| RBC (×1012/L) | 4.9±0.8 |
| Hemoglobin (g/L) | 155.8±122.3 |
| Platelet (×109/L) | 189.8±58.0 |
| RDW (%) | 12.4±2.5 |
ALT, alanine transaminase; AST, aspartate transaminase; ALP, alkaline phosphatase; GGT, gamma-glutamyl transpeptidase; WBC, white blood cell count; RBC, red blood cell count; RDW, red cell distribution width.
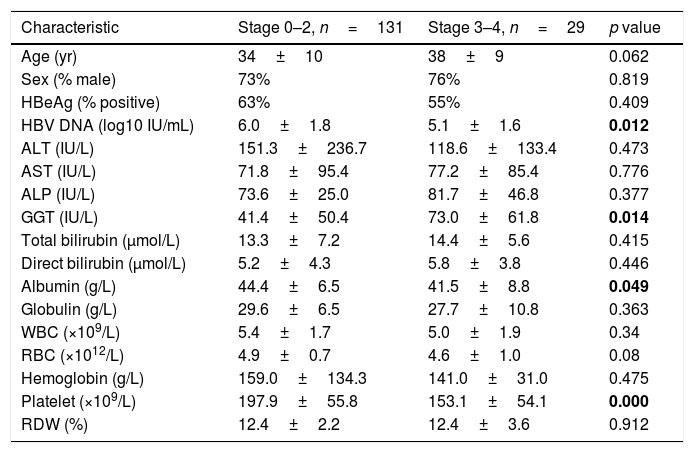
Table 2 shows a comparison of factors between patients (n=131, 82%) with absence or mild fibrosis (Stage 0–2) and patients (n=29, 18%) with significant fibrosis (Stage 3–4). In patients with absence or mild fibrosis, the levels of HBV DNA (6.0±1.8 vs 5.1±1.6 log10 IU/mL, p=0.012), albumin (44.4±6.5 vs 41.5±8.8g/L, p=0.049) and platelet count (197.9±55.8 vs 153.1±54.1 109/L, p<0.001) were significantly higher than that in patients with significant fibrosis, while the GGT level in patients with significant fibrosis was higher than that in patients with absence or mild fibrosis (73.0±61.8 vs 41.4±50.4IU/L, p=0.014). For established non-invasive fibrosis models, a higher score of Fib-4 (1.08±0.81 vs 2.15±1.82, p=0.004), GPR (0.39±0.49 vs 0.90±0.81, p=0.003) and RPR (0.07±0.03 vs 0.09±0.04) was observed in patients with significant fibrosis, while the APRI score showed no significant difference between the two groups.
Analysis for factors associated with the presence of significant fibrosis.
| Characteristic | Stage 0–2, n=131 | Stage 3–4, n=29 | p value |
|---|---|---|---|
| Age (yr) | 34±10 | 38±9 | 0.062 |
| Sex (% male) | 73% | 76% | 0.819 |
| HBeAg (% positive) | 63% | 55% | 0.409 |
| HBV DNA (log10 IU/mL) | 6.0±1.8 | 5.1±1.6 | 0.012 |
| ALT (IU/L) | 151.3±236.7 | 118.6±133.4 | 0.473 |
| AST (IU/L) | 71.8±95.4 | 77.2±85.4 | 0.776 |
| ALP (IU/L) | 73.6±25.0 | 81.7±46.8 | 0.377 |
| GGT (IU/L) | 41.4±50.4 | 73.0±61.8 | 0.014 |
| Total bilirubin (μmol/L) | 13.3±7.2 | 14.4±5.6 | 0.415 |
| Direct bilirubin (μmol/L) | 5.2±4.3 | 5.8±3.8 | 0.446 |
| Albumin (g/L) | 44.4±6.5 | 41.5±8.8 | 0.049 |
| Globulin (g/L) | 29.6±6.5 | 27.7±10.8 | 0.363 |
| WBC (×109/L) | 5.4±1.7 | 5.0±1.9 | 0.34 |
| RBC (×1012/L) | 4.9±0.7 | 4.6±1.0 | 0.08 |
| Hemoglobin (g/L) | 159.0±134.3 | 141.0±31.0 | 0.475 |
| Platelet (×109/L) | 197.9±55.8 | 153.1±54.1 | 0.000 |
| RDW (%) | 12.4±2.2 | 12.4±3.6 | 0.912 |
ALT, alanine transaminase; AST, aspartate transaminase; ALP, alkaline phosphatase; GGT, gamma-glutamyl transpeptidase; WBC, white blood cell count; RBC, red blood cell count; RDW, red cell distribution width. The bold data were considered statistically significant.
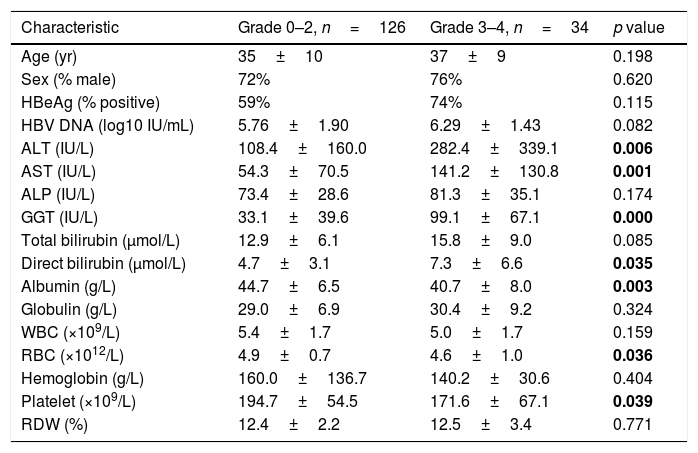
A similar comparison of factors between subjects with low necroinflammation activity (Grade 0–2, n=126, 79%) and severe necroinflammation activity (Grade 3–4, n=34, 21%) is shown in Table 3. Patients with severe necroinflammation activity presented a higher level of ALT (282.4±339.1 vs 108.4±160.0IU/L, p=0.006), AST (141.2±130.8 vs 54.3±70.5IU/L, p=0.001), GGT (99.1±67.1 vs 33.1±39.6IU/L, p<0.001) and direct bilirubin (7.3±6.6 vs 4.7±3.1μmol/L, p=0.035), while a lower level of albumin (40.7±8.0 vs 44.7±6.5g/L, p=0.003), red cell count (4.6±1.0 vs 4.9±0.7 1012/L, p=0.036) and platelet count (171.6±67.1 vs 194.7±54.5 109/L, p=0.039). In addition, all the scores of APRI (2.26±2.06 vs 0.79±1.24, p<0.001), Fib-4 (2.24±1.76 vs 1.02±0.71, p<0.001), GPR (1.10±0.79 vs 0.31±0.39, p<0.001) and RPR (0.08±0.04 vs 0.07±0.03, p=0.044) were higher in patients with severe necroinflammation activity.
Analysis for factors associated with the presence of severe necroinflammation activity.
| Characteristic | Grade 0–2, n=126 | Grade 3–4, n=34 | p value |
|---|---|---|---|
| Age (yr) | 35±10 | 37±9 | 0.198 |
| Sex (% male) | 72% | 76% | 0.620 |
| HBeAg (% positive) | 59% | 74% | 0.115 |
| HBV DNA (log10 IU/mL) | 5.76±1.90 | 6.29±1.43 | 0.082 |
| ALT (IU/L) | 108.4±160.0 | 282.4±339.1 | 0.006 |
| AST (IU/L) | 54.3±70.5 | 141.2±130.8 | 0.001 |
| ALP (IU/L) | 73.4±28.6 | 81.3±35.1 | 0.174 |
| GGT (IU/L) | 33.1±39.6 | 99.1±67.1 | 0.000 |
| Total bilirubin (μmol/L) | 12.9±6.1 | 15.8±9.0 | 0.085 |
| Direct bilirubin (μmol/L) | 4.7±3.1 | 7.3±6.6 | 0.035 |
| Albumin (g/L) | 44.7±6.5 | 40.7±8.0 | 0.003 |
| Globulin (g/L) | 29.0±6.9 | 30.4±9.2 | 0.324 |
| WBC (×109/L) | 5.4±1.7 | 5.0±1.7 | 0.159 |
| RBC (×1012/L) | 4.9±0.7 | 4.6±1.0 | 0.036 |
| Hemoglobin (g/L) | 160.0±136.7 | 140.2±30.6 | 0.404 |
| Platelet (×109/L) | 194.7±54.5 | 171.6±67.1 | 0.039 |
| RDW (%) | 12.4±2.2 | 12.5±3.4 | 0.771 |
ALT, alanine transaminase; AST, aspartate transaminase; ALP, alkaline phosphatase; GGT, gamma-glutamyl transpeptidase; WBC, white blood cell count; RBC, red blood cell count; RDW, red cell distribution width. The bold data were considered statistically significant.
The associations between established models and liver fibrosis stages or necroinflammation grades were analyzed using Spearman test. Box plots of serum markers in relation to fibrosis stage and necroinflammation grade are presented in Figs. 1 and 2. Statistically significant positive correlations were observed between fibrosis stage and GGT (r=0.401, p<0.001), AST (r=0.339, p<0.001), RDW (r=0.286, p<0.001), GPR (r=0.444, p<0.001), APRI (r=0.424, p<0.001), RPR (r=0.286, p<0.001), Fib-4 (r=0.444, p<0.001), while a negative correlation with fibrosis stage was found in platelet count (r=−0.288, p<0.001). Similarly, necroinflammation grades were positively correlated with GGT (r=0.483, p<0.001), AST (r=0.542, p<0.001), RDW (r=0.402, p<0.001), GPR (r=0.499, p<0.001), APRI (r=0.585, p<0.001), RPR (r=0.314, p<0.001), Fib-4 (r=0.453, p<0.001) but negatively related to platelet count (r=−0.295, p<0.001).
, aspartate transaminase (AST), red cell distribution width (RDW), platelet (Plt), GGT to platelet ratio (GPR), aspartate transaminase-to-platelet ratio index (APRI), RDW to platelet ratio (RPR), and fibrosis-4 index (Fib-4) according to fibrosis stage. r is the correlation coefficient.")
Box plots of gamma-glutamyl transpeptidase (GGT), aspartate transaminase (AST), red cell distribution width (RDW), platelet (Plt), GGT to platelet ratio (GPR), aspartate transaminase-to-platelet ratio index (APRI), RDW to platelet ratio (RPR), and fibrosis-4 index (Fib-4) according to fibrosis stage. r is the correlation coefficient.
, aspartate transaminase (AST), red cell distribution width (RDW), platelet (Plt), GGT to platelet ratio (GPR), aspartate transaminase-to-platelet ratio index (APRI), RDW to platelet ratio (RPR), and fibrosis-4 index (Fib-4) according to necroinflammation grade. r is the correlation coefficient.")
Box plots of gamma-glutamyl transpeptidase (GGT), aspartate transaminase (AST), red cell distribution width (RDW), platelet (Plt), GGT to platelet ratio (GPR), aspartate transaminase-to-platelet ratio index (APRI), RDW to platelet ratio (RPR), and fibrosis-4 index (Fib-4) according to necroinflammation grade. r is the correlation coefficient.
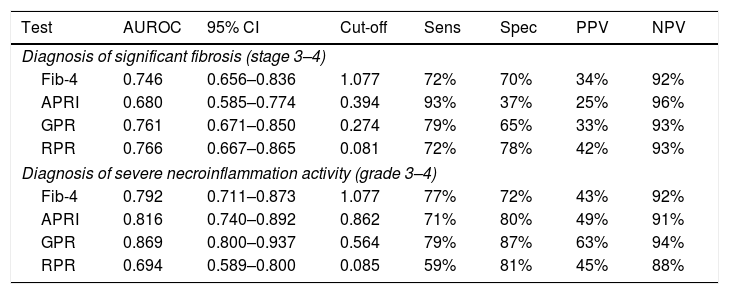
For predicting significant fibrosis, AUROC of GPR (0.761, 95% CI 0.671–0.850) was significantly higher than that of APRI (0.680, 95% CI 0.585–0.774, p=0.034), but comparable with RPR (0.766, 95% CI 0.667–0.865, p=0.906) and Fib-4 (0.746, 95% CI 0.656–0.836, p=0.703) (Table 4). The optimal cut-off value of GPR for the prediction of significant fibrosis was 0.274 (Table 4). Further analyses revealed that AUROC of GPR (0.726, 95% CI 0.607–0.846) was comparable with Fib-4 (0.728, 95% CI 0.606–0.850) and RPR (0.736, 95% CI 0.583–0.889) for predicting significant fibrosis in HBeAg positive patients, but in HBeAg negative patients, GPR (0.827, 95% CI 0.705–0.948) had the best performance (Table S2). For predicting severe necroinflammation activity, the performance of GPR (AUROC=0.869, 95% CI 0.800–0.937) was better than APRI (AUROC=0.816, 95% CI 0.740–0.892, p=0.085), RPR (AUROC=0.694, 95% CI 0.589–0.800, p<0.001) and Fib-4 (0.792, 95% CI 0.711–0.873, p=0.023) with the optimal cut-off value of 0.564 (Table 4). Further analyses confirmed that both in HBeAg positive (0.888, 95% CI 0.796–0.979) and negative (0.828, 95% CI 0.716–0.939) patients, GPR had the best performance for predicting severe necroinflammation activity (Table S2).
Assessment of diagnostic performance of non-invasive scores for significant fibrosis and severe necroinflammation activity.
| Test | AUROC | 95% CI | Cut-off | Sens | Spec | PPV | NPV |
|---|---|---|---|---|---|---|---|
| Diagnosis of significant fibrosis (stage 3–4) | |||||||
| Fib-4 | 0.746 | 0.656–0.836 | 1.077 | 72% | 70% | 34% | 92% |
| APRI | 0.680 | 0.585–0.774 | 0.394 | 93% | 37% | 25% | 96% |
| GPR | 0.761 | 0.671–0.850 | 0.274 | 79% | 65% | 33% | 93% |
| RPR | 0.766 | 0.667–0.865 | 0.081 | 72% | 78% | 42% | 93% |
| Diagnosis of severe necroinflammation activity (grade 3–4) | |||||||
| Fib-4 | 0.792 | 0.711–0.873 | 1.077 | 77% | 72% | 43% | 92% |
| APRI | 0.816 | 0.740–0.892 | 0.862 | 71% | 80% | 49% | 91% |
| GPR | 0.869 | 0.800–0.937 | 0.564 | 79% | 87% | 63% | 94% |
| RPR | 0.694 | 0.589–0.800 | 0.085 | 59% | 81% | 45% | 88% |
Fib-4, fibrosis index based on four factors; APRI, aspartate transaminase (AST)-to-platelet ratio index; GPR, gamma-glutamyl transpeptidase (GGT)-to-platelet ratio; RPR, red cell distribution width (RDW)-to-platelet ratio; AUROC, area under receiver operating characteristic curve; Sens, sensitivity; Spec, specificity; PPV, positive predictive value; NPV, negative predictive value.
To assess the influence of liver inflammatory activity on diagnostic performance, a comparison between patients with ALT below or above 5× ULN was performed. As shown in Table S3, all of the non-invasive tests performed better in patients with ALT below 5× ULN than in those with ALT above 5× ULN for predicting either significant fibrosis or severe necroinflammation activity. In addition, GPR had the largest AUROC for predicting either significant fibrosis (0.809, 95% CI 0.715–0.903) or severe necroinflammation activity (0.858, 95% CI 0.762–0.954) in patients with ALT below 5× ULN.
DiscussionLiver fibrosis and cirrhosis are at the epicenter of clinical hepatology. Although potent antifibrotic agents remain unavailable, evaluating the severity of fibrosis in CHB patients is critical to identifying those who need antiviral treatment. As the gold standard, liver biopsy is expensive and invasive with some complications. Thus, some simple, non-invasive and inexpensive biochemical markers were developed in recent years.
APRI was firstly proposed to identify significant fibrosis and cirrhosis in CHC patients evaluated by Ishak scoring system,5 while Fib-4 was originally developed in HCV and HIV co-infection patients for predicting liver fibrosis and was proven to be concordant with Fibro Test results.6 Recent studies showed that APRI and Fib-4 have moderate sensitivity and accuracy in identifying either HCV or HBV-related cirrhosis.10,11 In another report, APRI showed lower performances than Fib-4 for the diagnosis of fibrosis in patients with CHB or CHC.12 In addition, a recent investigation revealed that extensive overlap in the distribution of APRI and Fib-4 scores across Ishak stages prevented accurate determination of fibrosis.13 Therefore, APRI and Fib-4 may not be favorable non-invasive markers for assessing liver fibrosis according to Ishak stage in CHB patients.
Red cell distribution width (RDW), one of the routine blood test parameters, has been proposed as a prognostic factor in various conditions including chronic lymphocytic leukemia, breast cancer, esophageal carcinoma and acute heart failure.14–17 In leukoaraiosis, RDW was associated with disease severity.18 For patients with CHB, it has been revealed that RDW values increased with progressive liver fibrosis and inflammation and may serve as a potential marker for predicting histopathological stages and grades.19 In addition, RDW to platelet ratio (RPR) was also related to the histological severity of primary biliary cirrhosis as well as hepatic fibrosis and cirrhosis in CHB.7,8
Lemoine et al.9 recently identified that gamma-glutamyl transpeptidase (GGT) to platelet ratio (GPR) was able to accurately predict liver fibrosis (according to METAVIR score) in chronic HBV infection patients in West Africa. In HBV/HIV coinfected population, GPR was not recommended for diagnosing advanced fibrosis and cirrhosis (according to METAVIR score) in West Africa due to insufficient positive predictive value,20 while in France, GPR showed a favorable predictive performance.9 In China, GPR showed no advantages than APRI and Fib-4 in predicting significant fibrosis and cirrhosis (according to METAVIR score) in CHB patients.21 However, recent studies revealed that GPR performs well in diagnosing liver fibrosis and cirrhosis staged by Scheuer's scoring system.22,23
In the current CHB patient cohort, grading of inflammation and staging of fibrosis were performed as per the Scheuer's scoring system. Previously, it has been reported that elevated serum GGT can predict advanced histological liver damage in CHB patients according to the Scheuer's scoring system. Here we found a statistically significant positive correlation between GPR and Scheuer's fibrosis stage and inflammation grade, and the correlation coefficient was higher than GGT or platelet alone (r=0.444, p<0.001; r=0.499, p<0.001, respectively). Our results showed that among established non-invasive models, GPR exhibited favorable diagnostic accuracy for advanced fibrosis (AUROC=0.761, 95% CI 0.671–0.850) and cirrhosis (AUROC=0.836, 95% CI 0.759–0.913). For predicting advanced fibrosis the cut-off of GPR was 0.274 with a sensitivity of 79% and a specificity of 65%. While for the prediction of cirrhosis, the sensitivity and specificity were 100% and 63%, respectively with the same cut-off. In addition, the AUROC of GPR to predict high inflammation activity was 0.869 (95% CI 0.800–0.937), and using the optimal cut-off (0.564) determined, the sensitivity and specificity were 79% and 87%, respectively.
Our study has limitations. First, as a retrospective investigation, potential selective bias may lead to less accurate performance assessment. Second, we excluded conditions that may cause GGT or platelet count alteration, including excessive alcohol consumption, HIV or HCV co-infection. Consequently, diagnostic accuracy of these serum models needs further validation in patients with such conditions. Finally, in view of the small sample size and the absence of HBV genotyping, multicenter studies with enough sample size are needed.
In summary, among established non-invasive models, our study proposes that GPR may serve as a convenient and relative accurate alternative to liver biopsy in assessing liver fibrosis and inflammation activity in treatment-naïve Chinese CHB patients, especially in patients with ALT below 5× ULN. However, further validations are needed before it can be generalized in clinical practice.
Conflicts of interestNone declared.
This work was supported by the Natural Science Foundation of China under Grant 81770565, 81101240 and 81371821.
The following are the supplementary data to this article: