


There are few scales with prospective validation for the assessment of the upper gastrointestinal mucosal cleanliness during an esophagogastroduodenoscopy (EGD). The aim of this study was to develop a valid and reproducible cleanliness scale for use during an EGD.
MethodsWe developed a cleanliness scale (Barcelona scale) with a score (0–2 points) of five segments of the upper gastrointestinal tract with thorough cleaning techniques (esophagus, fundus, body, antrum, and duodenum). First, 125 photos (25 of each area) were assessed, and a score was assigned to each image by consensus among 7 experts endoscopists. Subsequently, 100 of the 125 images were selected and the inter- and intra-observer variability of 15 previously trained endoscopists was evaluated using the same images at two different times.
ResultsIn total, 1500 assessments were performed. In 1336/1500 observations (89%) there was agreement with the consensus score, with a mean kappa value of 0.83 (0.45–0.96). In the second evaluation, in 1330/1500 observations (89%) there was agreement with the consensus score, with a mean kappa value of 0.82 (0.45–0.93). The intra-observer variability was 0.89 (0.76–0.99).
ConclusionsThe Barcelona cleanliness scale is a valid measure and reproducible with minimal training. Its application in clinical practice is a significant step to standardize the quality of the EGD.
Existen pocas escalas validadas prospectivamente para evaluar la limpieza de la mucosa esofagogastroduodenal durante la endoscopia digestiva alta (EDA). El objetivo de este estudio fue desarrollar una escala válida y reproducible para su uso en la realización de una EDA.
MétodosDesarrollamos una escala de limpieza (escala Barcelona) en la que se aplicó una puntuación de 0 a 2 a cinco áreas del tracto digestivo superior (esófago, fundus, cuerpo, antro y duodeno) después de haber realizado todas las maniobras de lavado necesarias. Inicialmente, se evaluaron 125 fotos (25 de cada área) y se asignó una puntuación (de 0 a 2) a cada una por consenso entre siete endoscopistas. Posteriormente, se seleccionaron 100 de las 125 fotografías y se evaluó la variabilidad inter e intraobservador de 15 endoscopistas previamente formados utilizando las mismas imágenes en dos momentos diferentes.
ResultadosSe efectuaron un total de 1.500 observaciones. En 1.336/1.500 de ellas (89%) hubo coincidencia con la puntuación del consenso, siendo el valor medio de kappa de 0,83 (0,45-0,96). En la segunda evaluación, en 1.330/1.500 observaciones (89%) hubo coincidencia con la puntuación del consenso, siendo el valor medio de kappa de 0,82 (mínimo 0,45 y máximo 0,93). La variabilidad intraobservador fue de 0,89 (0,76-0,99).
ConclusionesLa escala de limpieza Barcelona es una medida válida y reproducible con un mínimo entrenamiento. Su uso en la práctica clínica podría ser un paso significativo para estandarizar la calidad de la EDA.
Esophagogastroduodenoscopy (EGD) is the gold standard for the diagnosis of upper gastrointestinal cancer and precursor lesions. To achieve a good diagnostic accuracy of EGD, a meticulous visibility of mucosa of the esophagus, stomach and duodenum is required, which makes the cleansing of the mucosa a key element of the procedure. An inadequate cleansing of the gastrointestinal mucosa may result in failure to detect lesions beneath the mucus or bile, may prolong the procedure and requires repeat examinations at shorter intervals.1 For instance, missed gastric neoplasms in previous EGDs can be partly explained because the precancerous gastric lesions are practically imperceptible, for which reason a meticulous and detailed examination is essential and, therefore, cleaning must be optimal.2 In Asian countries, a mucolytic-antifoam solution is routinely administered to improve mucosal visualization,3 however it has not been shown to improve the detection rate of lesions.4
There has been a growing interest in improving the quality of the EGD. In 2006, the first guideline for the quality of upper gastrointestinal endoscopy was published, with the proposal of several quality standards by the American Society for Gastrointestinal Endoscopy and the American College of Gastroenterology.5,6 Subsequently, other societies such as the European Society of Gastrointestinal Endoscopy and the United European Gastroenterology have published their own.7,8 Some of the general recommendations are appropriate photo-documentation of the lesions, minimum examination time of 7 min, description of lesions according to international definitions/classifications, and cleaning of all saliva/detritus. In the same line, the recent position document of the Spanish Association of Gastroenterology, the Spanish Society of Digestive Endoscopy, and the Spanish Society of Anatomical Pathological recommends reporting of the degree of cleanliness and quality of visualization of the gastric mucosa.9
Despite these recommendations, and in contrast to colonoscopy, there are few prospectively validated cleanliness scales which are not used in clinical setting during the EGD.10 For colonoscopy, the most widely and validated used scale is the Boston scale,11 which is a semiquantitative assessment of the presence of stools and the visibility of the mucosa after all necessary cleansing maneuvers. However, the scales currently available for the EGD are designed to assess the efficacy of cleansing agents, so they evaluate a score before performing cleansing maneuvers and removing the fluids in the stomach.
Given all the above, the aim of our study was to develop a novel mucosal cleanliness scoring scale for the esophagus, stomach and duodenum, to be applied during the EGD, after all cleansing maneuvers are completed by the endoscopist.
Patients and methodsProspective and multicenter study divided in two phases (Fig. 1): development of the scale and assessment of its applicability. The protocol was approved by the Ethics and Research Committee of the Hospital Clínic of Barcelona (HCB/2020/1436).

Two expert endoscopists (>10,000 EGD performed and with exclusive dedication to gastrointestinal endoscopy during more than 10 years) selected images of 5 different segments of the upper gastrointestinal tract (esophagus, fundus, body, antrum, and duodenum) showing several degrees of cleanliness and applied a score from 0 to 2 points for each of them. The assessment of the cardias was included in the fundus images performed in retroflexion. The photographs were performed using high-definition endoscopes (GIF-H185, GIF-HQ190 and EVIS EXERA III video processor, Olympus Europe, Hamburg, Germany). The images were obtained after all cleansing maneuvers with instillation of water and/or mucolytic. The images did not contain patient identification data, medical record number, or scan date. The assigned scores correspond to the following descriptions (Fig. 2):
- -
0: non aspirable solid or semisolid, presence of bile or foam which does not allow to visualize most part of the mucosa.
- -
1: small amount of semisolid, bile or foam, which allow to visualize most part of the mucosa.
- -
2: absence of any rests, so the visualization of the mucosa is near 100%.
")
The partial scores were added to obtain a global score (minimum of 0 and maximum of 10). In this regard, the maximum score reflected perfect cleanliness without any solid contents or residual fluids.
Assessment of the applicability of the scaleThis phase was divided in 4 stages:
Stage 0: prospectively, a selection of 125 new images was made, 25 of each segment, which were evaluated by 7 expert endoscopists from 3 Spanish hospitals who individually applied a score from 0 to 2 according to the description above. Subsequently, the images were evaluated by consensus and a final score was assigned according to the following criteria: (a) for the images with score agreement of six or more endoscopists, this was given as the final score and (b) for the images with agreement of 5 or fewer endoscopists, they were evaluated together and a new score was assigned by consensus. Eight images were excluded because were of poor quality. The degree of agreement between the endoscopists for the assigned by consensus final score was calculated. The final consensus score was considered the gold standard for the following stages 2 and 3.
Stage 1: Training. A 15-min educational video was recorded and sent to 15 endoscopists from 13 Spanish hospitals who had not participated in the previous stage of the study. The video was narrated and contained representative images of the different scores in the different segments. These images were different from those selected for the assessment set.
Stage 2: The 15 endoscopists assessed 100 images (20 for each segment) in order to keep a uniform and homogeneous distribution of the number of images by segments. The scores were compared with those obtained by consensus and the inter-observer variability was calculated.
Stage 3: Reassessment of the 100 images one month later to calculate the intra-observer variability. In order to reduce the possibility that the previously assigned score could be remembered, the images were submitted in a different order.
All the images of stages 0, 2 and 3 were submitted and scored through a Google Forms. The images did not contain patient identification data, medical record number, or scan date.
Statistical analysisQualitative variables are shown as absolute values and their percentages, while continuous variables are presented as the mean value±standard deviation. Chi-squared test was used to assess the difference among the proportions and the t-Student was used for the quantitative variables. To assess the inter and intra-observer agreement, we calculated the kappa value (kappa values ≤0 as indicating no agreement and 0.01–0.20 as none to slight, 0.21–0.40 as fair, 0.41–0.60 as moderate, 0.61–0.80 as substantial, and 0.81–1.00 as almost perfect agreement). All statistical tests were conducted using SPSS V22 (IBM, Armonk, NY, United States).
ResultsStage 0In 83 of the 117 images (70.9%), six or more endoscopists assigned the same score (esophagus 15/21, 71.4%; fundus 19/24, 79.2%; body 16/25, 64%; antrum 17/23, 73.9% and duodenum 16/24, 66.7%).
Regarding the consensus score, in 63 of the 117 images (53%) the seven endoscopists agreed with the final score (Table 1). The overall kappa index of the 7 endoscopists versus final consensus was 0.68 (95% CI, 0.61–0.77).
Agreement between the individual score of each expert endoscopist and the final consensus Stage 0. The column number corresponds to the number of endoscopists who agreed with the final consensus.
| Number of endoscopists and concordances | |||||||
|---|---|---|---|---|---|---|---|
| Image segment | 7 | 6 | 5 | 4 | 3 | 2 | 1 |
| Esophagus | 10 (47.6%) | 5 (23.8%) | 1 (4.7%) | 4 (19%) | 0 (0%) | 1 (4.7%) | 0 |
| Fundus | 12 (50%) | 7 (29.1%) | 2 (8.33%) | 0 (0%) | 2 (8.33%) | 1 (4.1%) | 0 |
| Body | 15 (60%) | 1 (4%) | 3 (12%) | 3 (12%) | 2 (8%) | 1 (4%) | 0 |
| Antrum | 14 (60.8%) | 2 (8.6%) | 5 (21.7%) | 2 (8.6%) | 0 | 0 | 0 |
| Duodenum | 12 (50%) | 3 (12.5%) | 2 (8.33%) | 3 (12.5%) | 1 (4.16%) | 2 (8.33%) | 1 (4.16%) |
| Total agreement of endoscopists and consensus | 63 (53%) | 18 (15.3%) | 13 (11.1%) | 12 (10.25%) | 5 (4.27%) | 5 (4.27%) | 1 (0.85) |
Of the total of 1500 observations, there was an agreement with the consensus scores in 1336 (89%): 87% in the esophagus (261/300), 88% in the fundus (265/300), 93% in the body (278/300), 92% in the antrum (277/300), and 85% in the duodenum (255/300). The inter-observer agreement was 0.83 (0.45–0.96). Of the 100 images evaluated by each endoscopist, thirteen or more endoscopists agreed on 82% of the observations respect to the consensus (esophagus 18/20, 90%; fundus 17/20, 85%; body 18/20, 90%; antrum 18/20, 90% and duodenum 11/20, 55%) (Fig. 3).
Stage 3")
In 1330/1500 observations (89%) there was agreement with the consensus score (254/300, 84%, in the esophagus; 268/300, 89.3%, in the fundus; 275/300, 91.6%, in the body 275/300, 91.4%, in the antrum, and 258/300, 86%, in the duodenum). At this stage, the mean kappa value of agreement between each endoscopist and the final score was 0.82 (0.45–0.93). Of the 100 images, thirteen or more endoscopists agreed on 80% of the observations with respect to the consensus (esophagus 15/20, 75%; fundus 16/20, 80%; body 18/20, 90%; antrum 18/20, 90% and duodenum 13/20, 65%) (Fig. 4). The mean kappa value of the intra-observer variability was 0.89 (range, 0.76–0.99) (Table 2).
.")
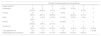
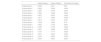
Weighted Kappas for the stages 2, 3 and individual intra-observer of the 15 endoscopists.
| Kappa Stage 2 | Kappa Stage 3 | Intraobserver Kappa | |
|---|---|---|---|
| Endoscopist 1 | 0.954 | 0.54 | 0.93 |
| Endoscopist 2 | 0.859 | 0.828 | 0.843 |
| Endoscopist 3 | 0.845 | 0.813 | 0.907 |
| Endoscopist 4 | 0.832 | 0.908 | 0.893 |
| Endoscopist 5 | 0.907 | 0.923 | 0.954 |
| Endoscopist 6 | 0.877 | 0.892 | 0.985 |
| Endoscopist 7 | 0.816 | 0.815 | 0.937 |
| Endoscopist 8 | 0.446 | 0.449 | 0.76 |
| Endoscopist 9 | 0.862 | 0.752 | 0.861 |
| Endoscopist 10 | 0.848 | 0.762 | 0.828 |
| Endoscopist 11 | 0.831 | 0.892 | 0.878 |
| Endoscopist 12 | 0.757 | 0.777 | 0.924 |
| Endoscopist 13 | 0.847 | 0.833 | 0.924 |
| Endoscopist 14 | 0.876 | 0.923 | 0.923 |
| Endoscopist 15 | 0.876 | 0.861 | 0.861 |
We have developed a valid and reproducible scale to assess EGD cleanliness that requires a minimal training. The basic principles of the Barcelona cleanliness scale for the EGD are similar to those used in the development of the Boston scale for colonoscopy, which facilitates its implementation. The Barcelona scale assesses the entire EGD and analyzes the cleansing of 5 segments: esophagus, fundus, body, antrum and duodenum. We chose the evaluation only on 3 points (0, 1, 2) to simplify its use and avoid a tiresome assessment. Probable disadvantages are that values 1 or 2 could be difficult to differentiate and that clinical differences might not be seen when evaluating the number of lesions.
The EGD is the gold standard for diagnosis of many gastrointestinal pathologies, including gastric cancer (GC) and the precancerous lesions (PLGC). The quality of EGD during the procedure depends on several factors, and a thorough examination is essential. For this reason, the degree of cleanliness and the quality of gastric mucosa visibility are of paramount importance. However, the degree of gastric cleanliness is not routinely reported. The scale proposed by Kuo and later modified by Chang12–14 is the most widely used in the studies carried out to evaluate the effect of premedication on gastric cleanliness. Therefore, this scale is not applied after washing but before. It assesses the stomach in four segments (antrum, lower gastric body, upper gastric body and fundus) and gives a score from 1 to 4.
Very recently, two new EGD cleaning scales were published to assess the quality of preparation: the POLPREP, and the TUGS (Toronto Upper Gastrointestinal Cleaning Score).15,16 The former evaluates the degree of cleanliness of the esophagus, stomach (in its entirety and not by segments) and duodenum with a score from 0 to 3 (4-point scale). For its development, 18 images (6 of each segment) were evaluated by 12 endoscopists. The inter- and intra-observer agreement was 0.80 and 0.64 respectively, the latter being much lower than that obtained with the Barcelona scale. This could be because in the POLPREP scale there are 4 possible scores, while in the Barcelona scale there are only 3, which would facilitate the consistency of the observations. On the other hand, the very recently published TUGS scale was designed using the Delphi method among a group of 14 international experts representing all continents, including experts in development methodology and research experience. After three rounds an agreement was reached, in which it was proposed to evaluate 4 segments: fundus, antrum, body, and duodenum, with a cleanliness classification ranging from 0 to 3. Subsequently, they validated the scale scoring 55 videos and obtained an inter- and intra-observer agreement of 0.79 and 0.64, respectively. As with the Barcelona scale, the lowest agreements were obtained in the duodenum, a possible explanation being that we are not used to properly cleaning and evaluating the duodenal mucosa, or that a different assessment scale is needed only for this segment.
The strength of our study is that it was evaluated among a large number of endoscopists and that all segments of the upper gastrointestinal tract were considered, in addition to dividing the stomach into different segments. Furthermore, to facilitate the implementation of the scale, we have considered only three possible scores. For all these reasons, and for the results obtained, we believe that our scale could be used in all EGDs.
The limitation of the study is that the descriptions of the degree of mucosal cleanliness/visibility are inherently subjective. To overcome this issue, a consensus was made between 7 expert endoscopists from 3 different hospitals, and the final score assigned to each image was considered the gold standard.
In conclusion, the Barcelona scale for the EGD cleanliness assessment is a valid and reproducible tool that requires minimal training, and its application in clinical practice could be a significant step to standardize the quality of the EGD. However, future studies should assess the validity of the Barcelona scale in clinical practice settings, verify its reliability across the full spectrum of scores, and examine the relationship between the degree of cleanliness and the detection of esophagogastroduodenal lesions.
FundingGrant from the Esophagus-Stomach-Duodenum Workgroup of the Spanish Association of Gastroenterology in June 2021.
Conflicts of interestNone declared.