


This study aims at analyzing the relationship between determinant factors of disclosure of information on environmental impacts of Brazilian companies. A descriptive, documental and quantitative research was conducted through a sample of 97 Brazilian companies. In the Sustainability Reports and in the Annual Reports information, five environmental aspects were collected: emissions, effluents, wastes, products and services; and transport, which were used to measure the degree of environmental disclosure. This concludes that there is a relationship between the variables investigated in all analyzed years. The size, audit and Global Reporting Initiative (GRI) are associated with disclosure and the Corporate Sustainability Index (CSI), Pollution Potential (POTEN), governance, stocks, Return on Assets (ROA) and Return on Equity (ROE) are not.
El objetivo de este estudio es analizar la relación entre los factores determinantes de la divulgación de información sobre los impactos ambientales de las empresas brasileñas. Para esto, una investigación descriptiva, documental y cuantitativa se llevó a cabo con una muestra de 97 empresas de Brasil. En las memorias de sostenibilidad y en la información de los informes anuales en cinco aspectos ambientales se recogió: emisiones, efluentes, residuos, productos y servicios, y el transporte, que se utiliza para medir el grado de divulgación del medio ambiente. Con esto se concluye que existe una relación entre las variables investigadas en todos los años analizados. El tamaño, auditoría y el Global Reporting Initiative (GRI) se asocian con la divulgación, mientras que el Índice de Sustentabilidad Empresarial (CSI), la Contaminación Potencial (POTEN), gobierno, acciones, Retorno sobre Activos (ROA) y Rentabilidad sobre Recursos Propios (ROE) no lo están.
O objetivo do estudo é analisar a relação entre os determinantes da divulgação de informações sobre os impactos ambientais das empresas brasileiras. Para isso, um estudo descritivo, documental e pesquisa quantitativa foi realizado com uma amostra de 97 empresas do Brasil. Em relatórios de sustentabilidade e informações em cinco relatórios anuais, os aspectos ambientais recolhidos foram: emissões, efluentes, resíduos, produtos e serviços, e transporte, que foram usados para medir o grau de divulgação ambiental. Este conclui que existe uma relação entre as variáveis investigadas em todos os anos analisados. O tamanho, a auditoria e o Global Reporting Initiative (GRI) estão associados com a divulgação, enquanto o Índice de Sustentabilidade Empresarial (ISE), a Poluição Potencial (Poten), as ações, o governo, o Retorno sobre ativos (ROA) e a Rentabilidade sobre Recursos Próprios (ROE) não o estão.
In the last 30 years, the impact of companies on the environment has become a growing concern among environmentalists, legislators, customers, public authorities and society in general. Thus, 15 years ago companies began to emphasize more on environmental strategies in the light of institutional pressures. These strategies are reported by using indicators and can be classified according to the environmental commitment they represent (Albertini, 2013).
The Legitimacy Theory provides explanations on the motivation of the administration to disseminate information regarding the environment in environmental reports (Wilmshurst & Frost, 2000). In this sense, Magness (2006) points out that one of the principles of the Legitimacy Theory is that companies use the disclosure to transmit information on how they deal with the environment. For Kuo and Chen (2013), in recent years, this theory has become dominant in research about environmental disclosure, since the environmental legitimacy discloses the company as environmentally responsible.
Nossa (2002) emphasizes that awareness and concern with the environment are increasingly present in society. That is why companies invest in environmental programs, because they discover that polluting is the same as wasting, not being efficient and not being able to compete. After all, society pressures government and companies regarding the preservation of the environment, and this pressure increases as the pollution caused by the activities of organizations increases. This is when companies set goals to minimize environmental impacts on emissions of liquid and gaseous effluents, recycling of materials, among others, in order to legitimize their activities.
This study assumes that the environmental performance, transparency and economic performance lead companies to disclose information on the environmental impacts. This expectation is also verified in studies conducted by Hackston and Milne (1996), Zeng, Xu, Dong, and Tam (2010), Bouten, Everaert, and Roberts (2012), Wegener, Elayan, Felton, and Li (2013), Rosa, Guesser, Hein, Pfitscher, and Lunkes (2013) and Rosa, Lunkes, Hein, Vogt, and Degenhart (2014), who have specifically investigated the factors that lead companies to evidence, from the perspective of the Theory of Legitimacy. From the perspective of the Theory of Disclosure, Braga, Oliveira, and Salotti (2009) and Murcia and Santos (2009) also found some factors that lead a company to disclosure. However, none of these studies in particular used the three factors seen in this study.
Several scientific researches have been done in the global context in order to verify the environmental disclosure issue from the perspective of the Theory of Legitimacy. Few of these studies have examined the determinant factors and variables of the disclosure of information on the environmental impacts of companies, used in this study. Research gaps have been identified in relation to (i) measuring the degree of environmental disclosure; (ii) the relationship between the variables of environmental performance factors, transparency and economic performance with the degree of environmental disclosure; and (iii) the relationship between the economic performance factor and the degree of environmental disclosure moderated by the environmental performance and transparency factors.
Given the aforementioned context the question that guides this research emerges: what is the relationship between determinants factors of information disclosure on the environmental impacts of Brazilian companies listed in Brazil Index 100 (IBrX-100) Stock Exchange, Commodities and Future Market of São Paulo (BM&FBovespa). In this sense, in order to answer that question, the objective of this study is to analyze the relationship between determinants of disclosure of information on the environmental impacts of Brazilian companies listed on the IBrX-100 BM&FBovespa.
The research is justified by the possibility of investigating the variables that showed conflicting results in the literature, since some authors have identified a relationship with positive influence between such relationships, and some others, a negative relationship. Therefore, it is expected that the findings of this research contribute to the existing knowledge on the subject and to provide evidence for further studies.
One aspect that contributes to the originality of the work is the use of the multi-criteria method Trade-Off Decision Analysis (T-ODA), unprecedented in environmental disclosure theme in research conducted in national and international level. From this method, it was possible to measure the degree of environmental disclosure and the relation between the determining factors and variables with this degree. Nossa (2002) stresses that companies must convince society that their environmental practices are not harmful to their profitability, let alone to the environment. Therefore, the identified factors will contribute to the expectations of society, since population can, from these factors that have been shown to be related to increased environmental disclosure, evaluate the company.
To achieve this goal, the paper is organized as follows: in the second section there is a review of the literature; the third section describes the used methodology; the fourth section presents the results. Finally, in the last section there are the conclusions and suggestions for future research.
2Theoretical backgroundThe theoretical framework is divided into three subsections. Initially it focuses on the Theory of Legitimacy. Following, we present the Environmental Disclosure and finally, the assumptions that were based on the main authors related to the theme, which enables to base the methodology adopted in this study.
2.1Legitimacy theoryAccording to Buhr (1998) and Czesnat and Machado (2012), the legitimacy of a company is achieved when they show that their organizational activities comply with their social values. Thus, to Neu, Warsame, and Pedwell (1998) the fact that there is the need for companies to operate in a competitive global economy, legitimacy becomes increasingly important, but it is always more difficult to achieve.
Therefore for the company to achieve or maintain legitimacy, it must act in favor of what society establishes, disclosing the measures that were taken. However, in society, there are groups of individuals that are usually identified as stakeholders. It is from the Legitimacy Theory and stakeholders that the company's managers should communicate to these groups their ways of achieving or protecting legitimacy (Cormier, Gordon, & Magnan, 2004).
The Legitimacy Theory is the lens that interprets a series of studies on the reports and on the environmental performance of companies. This theory is used as an explanation for the reactions of companies to threats of their legitimacy. Environmental disclosure is a communication mechanism that companies use to meet the external pressure and to adapt to socially accepted norms (Mobus, 2005).
Companies achieve legitimacy from the moment they demonstrate that they are acting according to the values, rules and beliefs that are set by society. Disclosure is one of the means to achieve this end (Boff, 2007; Czesnat & Machado, 2012).
Lu and Abeysekera (2014) argue that this theory focuses on what society in general expects from companies, since companies that are more likely to be subject to public scrutiny, such as large companies, disclose more social and environmental information to meet the expectations of society.
In short, the Legitimacy Theory focuses on society, taking the social contract as a link between the company and society. However, society is composed of different groups that have different power between one other to influence companies and other groups (Aburaya, 2012). Therefore, we believe that the disclosure of more information can contribute to the legitimacy of companies, increasing its reputation and recognition of society.
2.2Environmental disclosureThe number of companies that voluntarily disclose their social responsibility activities in their reports is increasing (Hackston & Milne, 1996). According to Deegan and Rankin (1997), the fact that managers voluntarily report environmental data is due to the fact that they consider the information relevant to users. Society may cancel their social contract with the company, unless it commits to the provision of certain information to combat or even offset the negative news exposed to the public. The disclosure is defined as a set of information related to the activities of an organization, its performance and financial implications that are associated to it. In recent years environmental disclosure expanded worldwide significantly (Wang & Bernell, 2013).
By the early twentieth century there was little concern from companies regarding to the preservation and restoration of the environment. This is because at that time the natural resources were considered abundant and managers were using these resources as an inexhaustible source of raw material at a very low cost or even zero (Costa, 2006).
From the moment that the effects of the damage to the environment began to manifest in the form of air pollution, contamination of rivers, seas and soils, degradation of fertile areas, among other consequences, society began asking organizations for greater environmental responsibility. The market selected companies that were committed to the preservation, maintenance and restoration of the environment, whereas the others would jeopardize the future of the planet (Costa, 2006).
In the scientific literature there are social, annual, and sustainability reports, among others. In general, environmental reports include information that is related to the company's management toward the environment and society. It is a right and a duty of society to require from companies the responsibility with the environment (Boff, 2007). The Annual Report of companies is seen as their business card, since it is intended to express the company's image (Daub, 2007). At first, there had been few detailed environmental information in annual reports (Harte & Owen, 1991).
On the other hand, the term Sustainability Report (SR) has become a linguistic loan from the term Sustainability (Daub, 2007). Over the past decade, Sustainability Reports have been adopted by more and more companies around the world (Lozano & Huisingh, 2011). Science discusses the best way for companies to demonstrate their environmental information. Several scientific studies are carried out to promote the evaluation of the environmental information performance which is also called environmental disclosure (Rosa, Ensslin, & Ensslin, 2009). Social and environmental disclosure can add value to businesses. However, it is not the same reality in all organizations, which hinders its standardization between them and the evaluation of information by stakeholders (Borges, Rosa, & Ensslin, 2010).
Even if environmental disclosure was supposed to always take place in Brazil, the law does not require companies to disclose information. There is a global trend in which investors seek companies that are socially responsible, sustainable and profitable to apply their resources (Oliveira, Machado, & Beuren, 2012). While companies are responsible for economic development, they are also criticized because of the negative impact they cause through emissions and misuse of natural resources (Suave, Boff, Kroetz, Rosa, & Lunkes, 2012).
The global concern for the environment increases more and more, as does the need for more studies on the establishment of environmental disclosure value to stakeholders. After all, environmental responsibility can be seen as a strategy that companies adopt to meet the expectations of stakeholders (Aburaya, 2012).
The challenge of environmental preservation has increased and forced companies to improve their disclosure of policies and also their environmental actions. In recent decades, the environmental variables have come to represent the competitive advantage in building relationships with stakeholders in the long run. Therefore, companies around the world need to worry about environmental preservation and restoration (Trierweiller, Peixe, Tezza, Bornia, & Campos, 2013).
One of the factors that can influence the company's ability to obtain environmental awards is their level of environmental disclosure (Hassan & Ibrahim, 2012). The level of disclosure of environmental information reflects on the degree of corporate environmental responsibility of the companies. Due to information asymmetry between stakeholders and senior executives, information on environmental practices can be easily manipulated, which results in impressions management (Meng, Zeng, Tam, & Xu, 2013).
In this context, the voluntary disclosure of social and environmental information is an example of the rules and structures that are implemented by companies to respond to social pressures. These pressures, together with the increasing acceptance of the dissemination of structures like the Global Reporting Initiative (GRI), encourage companies to disclose more information on sustainability. Traditionally, environmental disclosure is incorporated broadly in university curricula and is the object of extensive academic research (Villiers, Low, & Samkin, 2014).
Finally, Silva, Vicente, Pfitscher, and Rosa (2013) explain that the disclosure is understood as a way in which companies meet the demands of their users about the environmental information. Therefore, this information is usually disclosed in the companies’ websites or through reports (Annual Report, Sustainability Report, and others). Legitimacy is built and maintained by symbolic actions that structure the company's image. Adopting the disclosure is a method of managing the impressions of society, ensuring business continuity.
2.3HypothesisOnce the importance of the discussion of the factors that influence the environmental disclosure of Brazilian companies is recognized, the hypothesis that this research aims to test are presented. To support the developed hypotheses, some results obtained in previous studies worldwide on the subject were listed – which presented controversial results.
Thus, three research hypotheses about the determining factors were established (environmental performance, transparency and economic performance) and nine sub-hypotheses of the variables that make up these factors, which help to analyze the relationship of the determining factors of the disclosure of information on the environmental impacts of Brazilian companies. Regarding the environmental performance factor, Ashcroft (2012) points out that the concern of society for environmental issues has been present for several decades and companies face increasing pressure to demonstrate their environmental performance. Usually companies with good environmental performance are those that disclose more information on the environment (Al-Tuwaijri, Christensen, & Hughes, 2004).
The results obtained from the studies of Rosa et al. (2013, 2014) and Iatridis (2013) revealed that the environmental disclosure of Brazilian companies was positively related to environmental performance. Thus, given that this study analyzed another period and Brazilian companies belonging to the IBrX-100, the first hypothesis of this research emerges and their due sub-hypothesis:H1 There is a relationship between the environmental performance factor and the degree of environmental disclosure of Brazilian companies Analysis of Variance (ANOVA). The Corporate Sustainability Index (CSI) positively influences the degree of environmental disclosure. The pollution potential positively influences the degree of environmental disclosure. The Global Reporting Initiative (GRI) positively influences the degree of environmental disclosure.
Some studies have been conducted in order to identify the transparency and the variables that comprise it. To Aburaya (2012), the disclosures are defined as the process of disclosure of information on the impacts of economic activities of the company to the environment and this process can be considered as a means of ensuring corporate governance, which integrates transparency in their environmental performance. The GRI guidelines are an international framework to support the reporting standards, which increases even more the degree of transparency and consistency that is necessary to make information relevant and reliable to the market and society in general (GRI, 2013). From this context, it was possible to elaborate the second hypothesis tested in the present study and their sub-hypothesis:H2 There is a relationship between the transparency factor and the degree of environmental disclosure of Brazilian companies (ANOVA). Environmental audit positively influences the degree of environmental disclosure. Corporate governance positively influences the degree of environmental disclosure.
Several researchers have conducted studies in order to identify the variables that make up the economic performance related to the degree of environmental disclosure. According to Groppelli and Nikbakht (2002), investors, stakeholders and financial managers are always attentive to the profitability of organizations.
For Gitman (2004) there are several measures of profitability and these allow the analyst to assess the company's profits considering their sales, assets or amount of capital invested by the owners. Among these profitability measures is the Return on Assets (ROA) and Return on Equity (ROE). Without profits no company can attract capital (Ferreira, 2005; Gitman, 2004).
To Assaf Neto and Lima (2009), profitability indicators are intended to assess the results of a company in respect to certain parameters that reveal their dimensions in the best way. Precisely, the indicators often exert significant influences on the decisions involving the company that is being analyzed. From this context, the third hypothesis of this study is presented and other sub-hypothesis:H3 There is a relationship between the economic performance factor and the degree of environmental disclosure of Brazilian companies (ANOVA). The size positively influences the degree of environmental disclosure. The stocks positively influence the degree of environmental disclosure. The Return on Assets (ROA) positively influences the degree of environmental disclosure. Return on Equity (ROE) positively influences the degree of environmental disclosure.
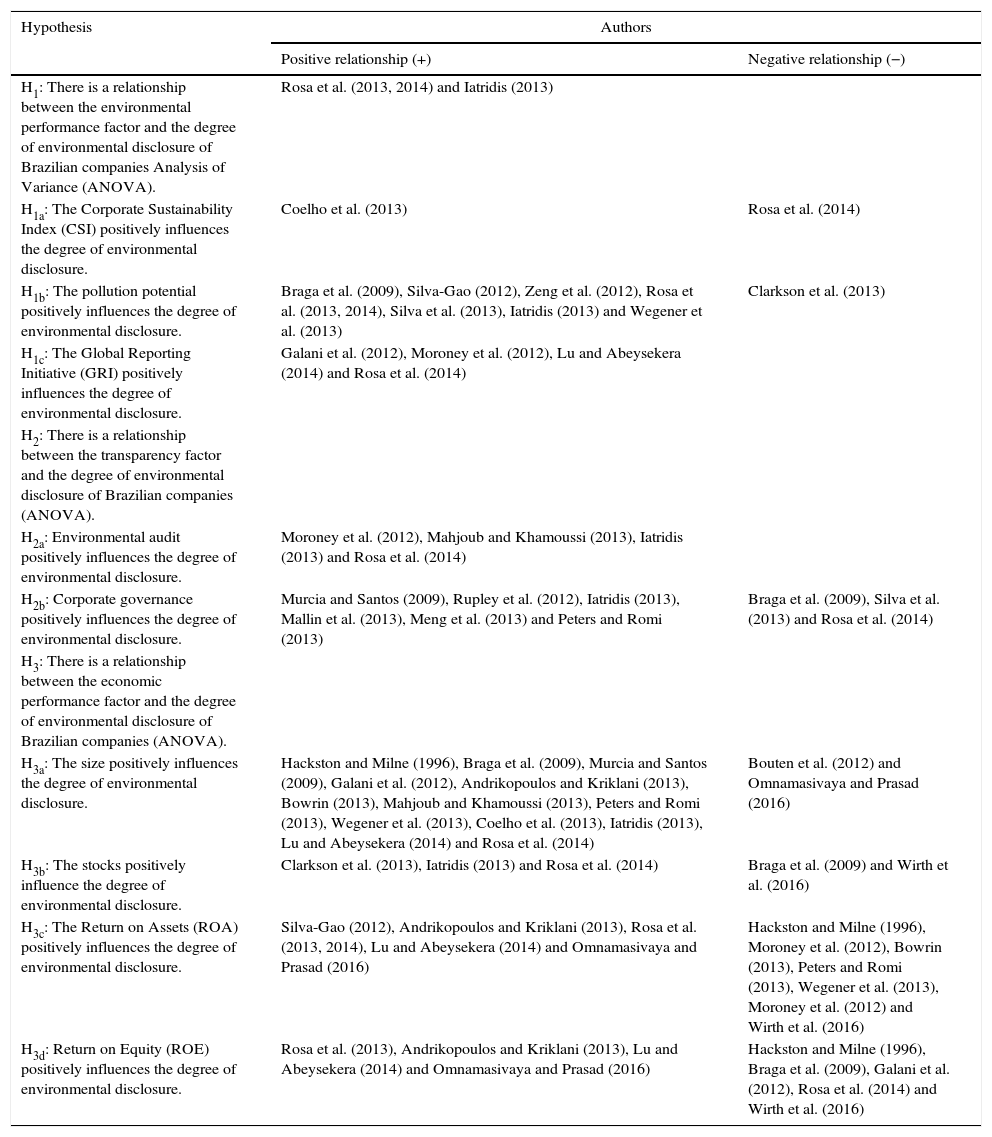
In Table 1 has a summary of the results obtained by other authors on the relationship (positive/negative) verified through hypotheses in this study.
Summary of results from previous studies.
Source: Own elaboration.
It is noteworthy that even if the studies have been conducted in various parts of the world, environmental disclosure is seen as one of the strategies that companies use to seek acceptance and approval of their activities on society anywhere. It is an important tool for the legitimization of the companies, as they can be used to establish, or maintain legitimacy as the Legitimacy Theory suggests that environmental disclosure provides an important way to communicate and convince stakeholders that the company complies your expectations. Nevertheless, reports play an important role in achieving corporate legitimacy (Branco, Eugénio, & Ribeiro, 2008).
3MethodologyAs to the research objectives, this study is characterized as descriptive. Regarding the procedures adopted in this study, it can be considered a documentary research. Regarding the research approach to the problem, this study is classified as quantitative.
3.1Population and sampleThe study population includes all companies belonging to the IBrX-100 listed on the BM&FBovespa, which comprises a total of 100 companies. IBrX-100 companies were chosen because this is a price index that measures the return on a theoretical portfolio that consists of 100 stocks selected among the most actively traded at BM&FBovespa, both in terms of number of trades, and in terms of financial volume (BM&FBovespa, 2014).
The study sample was composed of 97 companies listed on the Stock Exchange of São Paulo, belonging to the IBrX-100 index, taking in consideration that the companies Bradesco, Klabin, and Oi have been listed twice.
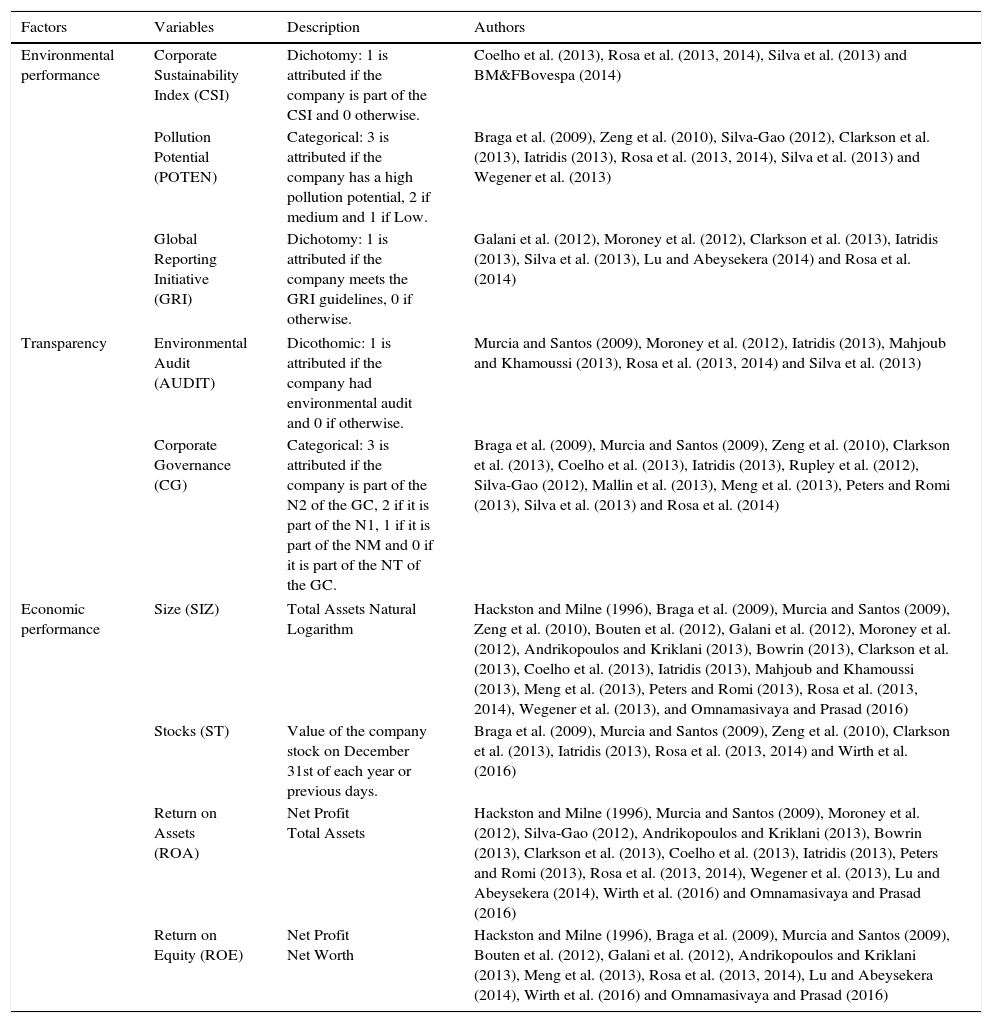
3.2Construct researchAccording to Martins and Theóphilo (2007), the construct is a variable or a set of terms, concepts and variables. From Table 2, the construct that shows the variables used in the study are shown to represent the environmental performance, transparency and economic performance factors, according to a survey conducted in the literature. In this figure, besides the factors and variables selected for the research, the description of each of these and their authors who used these variables in their research are presented.
Research construct.
Source: Own elaboration.
All data used in this study are secondary because the variables Corporate Sustainability Index and Corporate Governance were collected on the website of BM&FBovespa. The variable Pollution Potential was verified based on the Law 10.165/2010. Reports Annual and Sustainability were downloaded directly from the website for companies in the IBrX-100. In these reports, it was found that the companies follow the guidelines of the GRI, if they have the environmental audit and, furthermore, disclosure of the information was verified on all aspects that were examined in this study (emissions, effluents, waste, products and services and transportation).
The other variables were collected in the database Economática® and are the ones that make up the economic performance factor: Size, stocks, return on assets and return on equity, which are also characterized as the secondary data because they could already have found stored in a database.
For the period of analysis, given that the publication of the Sustainability Report occurs more often in the companies analyzed in recent years, the period between 2010 and 2013 was selected for the study. It is important to highlight that data collection was conducted in the months of March and April of 2014, and refer to the period from 2010 to 2012, and in the months of October and November 2014, the 2013 year reports were downloaded.
3.4Data analysis procedureInitially, to measure the degree of environmental disclosure of Brazilian companies listed on the IBrX-100 BM&FBovespa, the aspects presented by the GRI (2013) were verified in each Annual and Sustainability Report of each year, for the period after that, it was possible to measure the level of environmental disclosure of companies.
In all the reports disclosed by the companies in the sample in the period between 2010 and 2013 it was possible to verify the information presented on emissions, effluents, waste, products/services and transport, either in the annual report or in the sustainability report. The collected data were inserted into Excel spreadsheets from the interpretation of the GRI guidelines on every analyzed aspect, which leads, in the end, to every aspect of every company, a level of information on environmental disclosure. Then, the degree of environmental disclosure of each of the companies in the sample was measured, taking in consideration all of the analyzed aspects.
In Fig. 1 the environmental disclosure indicators, and the five aspects checked and their criteria and sub-criteria are presented.
.")
Environmental disclosure indicators.
Source: Adapted from the GRI (2013).
From Fig. 1 it is possible to verify the analyzed aspects in order to reach the degree of environmental disclosure for each company and analyzed year. These criteria and sub-criteria have different scales to express order between levels, according to the performance to be measured for each criterion, which enables the attribution of up to eight different levels. It is important to highlight that the levels and scales have been created from the interpretation of all information submitted on each aspect analyzed in GRI (2013) guidelines. The scales used range from 1 to maximum 8, depending on the analyzed aspect, as some of the aspects and criteria and sub-criteria require scales differentiated from each other, since they are separate information.
From the degree of environmental disclosure obtained through the T-ODA it was possible to verify the relationship between the variables of environmental performance, transparency and economic performance factors with the degree of environmental disclosure of Brazilian companies listed on the IBrX-100 BM&FBovespa and also the relationship between the economic performance factor and the degree of environmental disclosure moderated by the environmental performance and transparency factors. This relationship was obtained through the analysis of multiple linear regression performed from the Statistical Package for Social Sciences (SPSS) software.
First, a single list of variables with the degree of disclosure of companies was obtained. After, there was a new analysis from the technical linear regression, in which the variables that make up the economic performance factor (size, shares, ROA and ROE), due to the fact that they are monetary values, different from other factors, moderated by the variables that belong to the environmental performance factor and after, tempered with the transparency factor variables were used. Moderation was carried out by multiplying the variables of economic performance with all other used in the study to if the factors when related to economic performance, would increase the level of analyzed companies’ environmental disclosure.
4Presentation and analysis of resultsIn order to meet the overall objective of the research, initially is shown the list of businesses and analyzed their reports found each year. Following it was the degree of environmental disclosure and its classification of companies. After it was held the relationship of variables and factors. Finally, the results of the research are discussed.
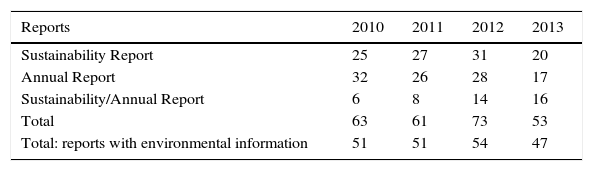
4.1Degree of environmental disclosure and the ranking of companiesTable 3 shows the number of reports (Sustainability Report and Annual Report and unified report) released by the companies analyzed in four years.
In Table 3, it can be seen that the year in which more companies showed their reports was 2012. However, 2013 was the year in which there was the least amount of published reports. The same result was observed at the same time that information on the five environmental aspects to reach the degree of environmental disclosure was found in the reports, because in 2013, the number of companies that had at least some environmental information was lower among all of the analyzed years.
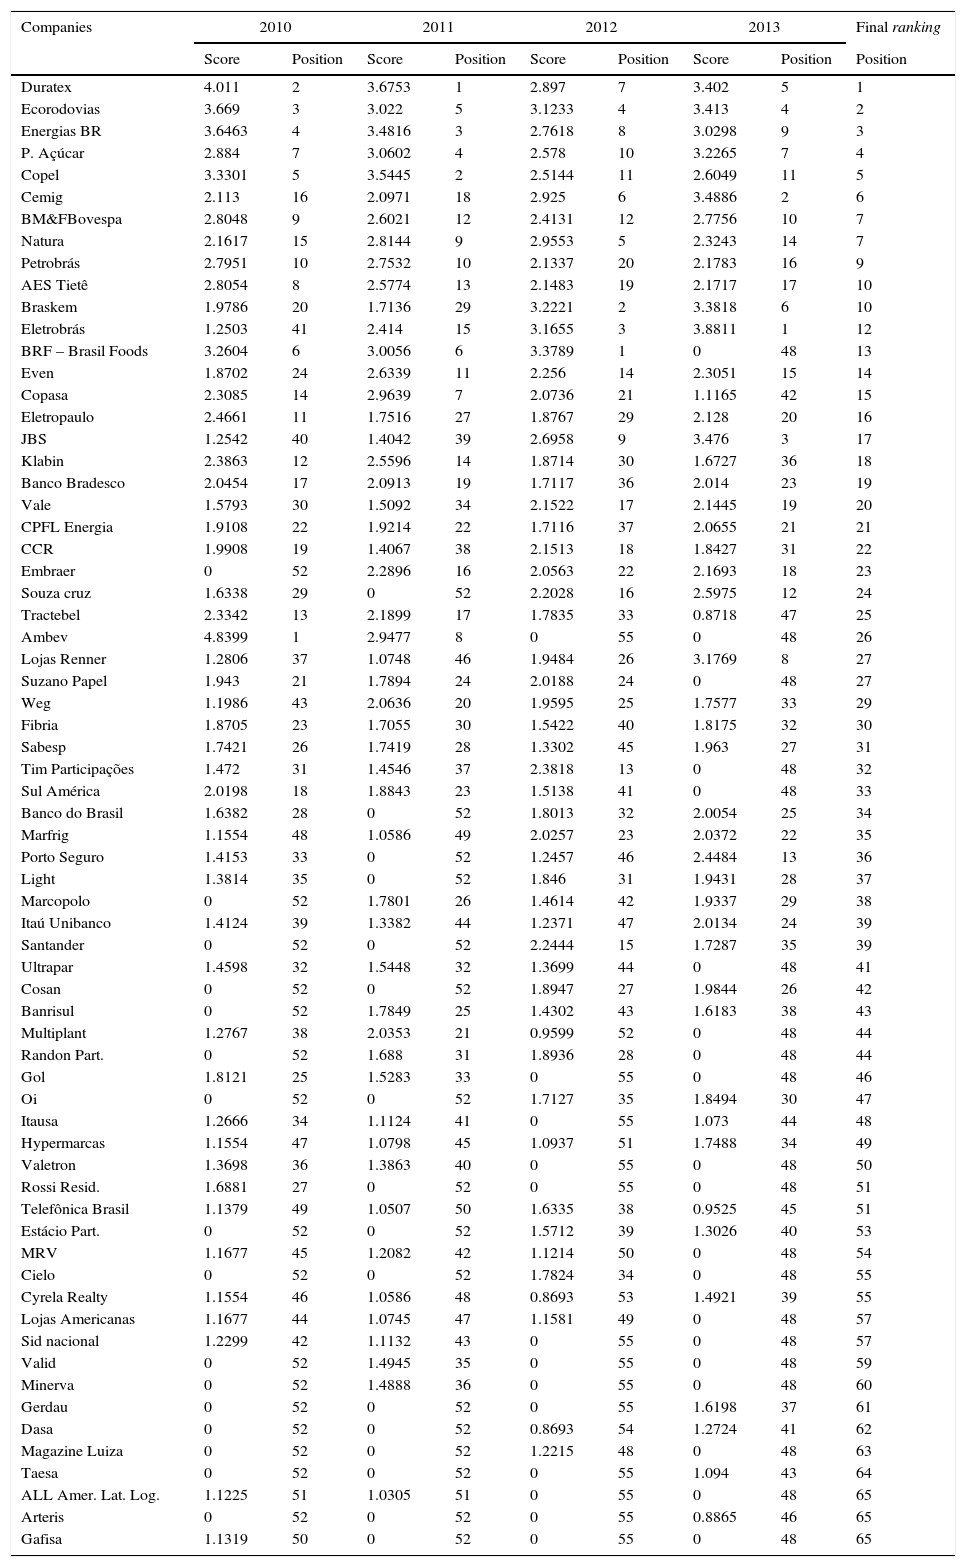
From the scores of the companies in each year it was possible to establish the ranking of environmental disclosure. In addition to the annual rankings, a general ranking in the degree of disclosure of the analyzed companies and the period was established. To provide this overall ranking from the partial (annual) rankings, there was the evolution of organizations during the four years analyzed using a system of consecutive points. Table 4 shows the degree of environmental disclosure (score) of the analyzed Brazilian companies and their position in the ranking in the four years analyzed.
Degree of environmental disclosure and ranking of Brazilian companies analyzed.
| Companies | 2010 | 2011 | 2012 | 2013 | Final ranking | ||||
|---|---|---|---|---|---|---|---|---|---|
| Score | Position | Score | Position | Score | Position | Score | Position | Position | |
| Duratex | 4.011 | 2 | 3.6753 | 1 | 2.897 | 7 | 3.402 | 5 | 1 |
| Ecorodovias | 3.669 | 3 | 3.022 | 5 | 3.1233 | 4 | 3.413 | 4 | 2 |
| Energias BR | 3.6463 | 4 | 3.4816 | 3 | 2.7618 | 8 | 3.0298 | 9 | 3 |
| P. Açúcar | 2.884 | 7 | 3.0602 | 4 | 2.578 | 10 | 3.2265 | 7 | 4 |
| Copel | 3.3301 | 5 | 3.5445 | 2 | 2.5144 | 11 | 2.6049 | 11 | 5 |
| Cemig | 2.113 | 16 | 2.0971 | 18 | 2.925 | 6 | 3.4886 | 2 | 6 |
| BM&FBovespa | 2.8048 | 9 | 2.6021 | 12 | 2.4131 | 12 | 2.7756 | 10 | 7 |
| Natura | 2.1617 | 15 | 2.8144 | 9 | 2.9553 | 5 | 2.3243 | 14 | 7 |
| Petrobrás | 2.7951 | 10 | 2.7532 | 10 | 2.1337 | 20 | 2.1783 | 16 | 9 |
| AES Tietê | 2.8054 | 8 | 2.5774 | 13 | 2.1483 | 19 | 2.1717 | 17 | 10 |
| Braskem | 1.9786 | 20 | 1.7136 | 29 | 3.2221 | 2 | 3.3818 | 6 | 10 |
| Eletrobrás | 1.2503 | 41 | 2.414 | 15 | 3.1655 | 3 | 3.8811 | 1 | 12 |
| BRF – Brasil Foods | 3.2604 | 6 | 3.0056 | 6 | 3.3789 | 1 | 0 | 48 | 13 |
| Even | 1.8702 | 24 | 2.6339 | 11 | 2.256 | 14 | 2.3051 | 15 | 14 |
| Copasa | 2.3085 | 14 | 2.9639 | 7 | 2.0736 | 21 | 1.1165 | 42 | 15 |
| Eletropaulo | 2.4661 | 11 | 1.7516 | 27 | 1.8767 | 29 | 2.128 | 20 | 16 |
| JBS | 1.2542 | 40 | 1.4042 | 39 | 2.6958 | 9 | 3.476 | 3 | 17 |
| Klabin | 2.3863 | 12 | 2.5596 | 14 | 1.8714 | 30 | 1.6727 | 36 | 18 |
| Banco Bradesco | 2.0454 | 17 | 2.0913 | 19 | 1.7117 | 36 | 2.014 | 23 | 19 |
| Vale | 1.5793 | 30 | 1.5092 | 34 | 2.1522 | 17 | 2.1445 | 19 | 20 |
| CPFL Energia | 1.9108 | 22 | 1.9214 | 22 | 1.7116 | 37 | 2.0655 | 21 | 21 |
| CCR | 1.9908 | 19 | 1.4067 | 38 | 2.1513 | 18 | 1.8427 | 31 | 22 |
| Embraer | 0 | 52 | 2.2896 | 16 | 2.0563 | 22 | 2.1693 | 18 | 23 |
| Souza cruz | 1.6338 | 29 | 0 | 52 | 2.2028 | 16 | 2.5975 | 12 | 24 |
| Tractebel | 2.3342 | 13 | 2.1899 | 17 | 1.7835 | 33 | 0.8718 | 47 | 25 |
| Ambev | 4.8399 | 1 | 2.9477 | 8 | 0 | 55 | 0 | 48 | 26 |
| Lojas Renner | 1.2806 | 37 | 1.0748 | 46 | 1.9484 | 26 | 3.1769 | 8 | 27 |
| Suzano Papel | 1.943 | 21 | 1.7894 | 24 | 2.0188 | 24 | 0 | 48 | 27 |
| Weg | 1.1986 | 43 | 2.0636 | 20 | 1.9595 | 25 | 1.7577 | 33 | 29 |
| Fibria | 1.8705 | 23 | 1.7055 | 30 | 1.5422 | 40 | 1.8175 | 32 | 30 |
| Sabesp | 1.7421 | 26 | 1.7419 | 28 | 1.3302 | 45 | 1.963 | 27 | 31 |
| Tim Participações | 1.472 | 31 | 1.4546 | 37 | 2.3818 | 13 | 0 | 48 | 32 |
| Sul América | 2.0198 | 18 | 1.8843 | 23 | 1.5138 | 41 | 0 | 48 | 33 |
| Banco do Brasil | 1.6382 | 28 | 0 | 52 | 1.8013 | 32 | 2.0054 | 25 | 34 |
| Marfrig | 1.1554 | 48 | 1.0586 | 49 | 2.0257 | 23 | 2.0372 | 22 | 35 |
| Porto Seguro | 1.4153 | 33 | 0 | 52 | 1.2457 | 46 | 2.4484 | 13 | 36 |
| Light | 1.3814 | 35 | 0 | 52 | 1.846 | 31 | 1.9431 | 28 | 37 |
| Marcopolo | 0 | 52 | 1.7801 | 26 | 1.4614 | 42 | 1.9337 | 29 | 38 |
| Itaú Unibanco | 1.4124 | 39 | 1.3382 | 44 | 1.2371 | 47 | 2.0134 | 24 | 39 |
| Santander | 0 | 52 | 0 | 52 | 2.2444 | 15 | 1.7287 | 35 | 39 |
| Ultrapar | 1.4598 | 32 | 1.5448 | 32 | 1.3699 | 44 | 0 | 48 | 41 |
| Cosan | 0 | 52 | 0 | 52 | 1.8947 | 27 | 1.9844 | 26 | 42 |
| Banrisul | 0 | 52 | 1.7849 | 25 | 1.4302 | 43 | 1.6183 | 38 | 43 |
| Multiplant | 1.2767 | 38 | 2.0353 | 21 | 0.9599 | 52 | 0 | 48 | 44 |
| Randon Part. | 0 | 52 | 1.688 | 31 | 1.8936 | 28 | 0 | 48 | 44 |
| Gol | 1.8121 | 25 | 1.5283 | 33 | 0 | 55 | 0 | 48 | 46 |
| Oi | 0 | 52 | 0 | 52 | 1.7127 | 35 | 1.8494 | 30 | 47 |
| Itausa | 1.2666 | 34 | 1.1124 | 41 | 0 | 55 | 1.073 | 44 | 48 |
| Hypermarcas | 1.1554 | 47 | 1.0798 | 45 | 1.0937 | 51 | 1.7488 | 34 | 49 |
| Valetron | 1.3698 | 36 | 1.3863 | 40 | 0 | 55 | 0 | 48 | 50 |
| Rossi Resid. | 1.6881 | 27 | 0 | 52 | 0 | 55 | 0 | 48 | 51 |
| Telefônica Brasil | 1.1379 | 49 | 1.0507 | 50 | 1.6335 | 38 | 0.9525 | 45 | 51 |
| Estácio Part. | 0 | 52 | 0 | 52 | 1.5712 | 39 | 1.3026 | 40 | 53 |
| MRV | 1.1677 | 45 | 1.2082 | 42 | 1.1214 | 50 | 0 | 48 | 54 |
| Cielo | 0 | 52 | 0 | 52 | 1.7824 | 34 | 0 | 48 | 55 |
| Cyrela Realty | 1.1554 | 46 | 1.0586 | 48 | 0.8693 | 53 | 1.4921 | 39 | 55 |
| Lojas Americanas | 1.1677 | 44 | 1.0745 | 47 | 1.1581 | 49 | 0 | 48 | 57 |
| Sid nacional | 1.2299 | 42 | 1.1132 | 43 | 0 | 55 | 0 | 48 | 57 |
| Valid | 0 | 52 | 1.4945 | 35 | 0 | 55 | 0 | 48 | 59 |
| Minerva | 0 | 52 | 1.4888 | 36 | 0 | 55 | 0 | 48 | 60 |
| Gerdau | 0 | 52 | 0 | 52 | 0 | 55 | 1.6198 | 37 | 61 |
| Dasa | 0 | 52 | 0 | 52 | 0.8693 | 54 | 1.2724 | 41 | 62 |
| Magazine Luiza | 0 | 52 | 0 | 52 | 1.2215 | 48 | 0 | 48 | 63 |
| Taesa | 0 | 52 | 0 | 52 | 0 | 55 | 1.094 | 43 | 64 |
| ALL Amer. Lat. Log. | 1.1225 | 51 | 1.0305 | 51 | 0 | 55 | 0 | 48 | 65 |
| Arteris | 0 | 52 | 0 | 52 | 0 | 55 | 0.8865 | 46 | 65 |
| Gafisa | 1.1319 | 50 | 0 | 52 | 0 | 55 | 0 | 48 | 65 |
Table 4 shows the analyzed companies that presented some data in the years analyzed. The last 30 companies were not evident as they were in the same position, i.e., in the 68th place. This was due to the fact that they presented a score of zero in all of the analyzed years, staying last in the ranking of environmental disclosure. It is inferred that the number of companies that do not show any environmental information is high. It is important for companies to disclose, because society and government charge higher social and environmental responsibility from companies.
It can be noticed that for the year 2010, Ambev was leading the ranking of companies with the highest degree of environmental disclosure, followed by Duratex, Ecorodovias, Energias BR, Copel and BRF – Brazil Foods. In 2011, this scenario changed a bit since Duratex achieved the first place in the ranking. In 2012, BRF – Brazil Foods that was in the sixth position in 2010 and 2011, went on to lead the disclosure ranking. Eletrobras, which in 2011 occupied the 15th position, moved to third in 2012 and led the ranking in 2013.
It is important to highlight that Duratex, Ecorodovias, Energias BR and Pão de Açúcar, were among the best classified in the ranking every year. AES Tietê, BM&FBovespa and Petrobras fell in positions in a year's ranking to the other. However, in 2013 all had a small improvement. Another company that is worth mentioning is Braskem which occupied the 20th place in the ranking in 2010 and achieved the second position in 2012. In addition, Copel, which was in fifth placed in 2010, scored the second position in 2011 and in 2012, and in 2013 it declined and occupied the eleventh position. On the other hand, BRF – Brazil Foods was well placed in the ranking for the first three years. It occupied the sixth place in 2010 and 2011 and moved to the first place in 2012. In 2013 it dropped to the 48th position.
It is also important that some companies, from one year to the other, have totally different degrees of environmental disclosure, which certainly make the ranking different from one year to the next.
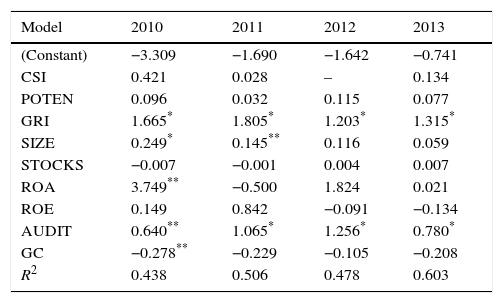
4.2Relationship between the variablesAfter the conditions are met, a multiple linear regression was performed for each year, in order to verify the relationship of the variables with the degree of environmental disclosure. Table 5 shows the summary of the model and the multiple linear regression.
Summary of the model and multiple linear regression.
| Model | 2010 | 2011 | 2012 | 2013 |
|---|---|---|---|---|
| (Constant) | −3.309 | −1.690 | −1.642 | −0.741 |
| CSI | 0.421 | 0.028 | – | 0.134 |
| POTEN | 0.096 | 0.032 | 0.115 | 0.077 |
| GRI | 1.665* | 1.805* | 1.203* | 1.315* |
| SIZE | 0.249* | 0.145** | 0.116 | 0.059 |
| STOCKS | −0.007 | −0.001 | 0.004 | 0.007 |
| ROA | 3.749** | −0.500 | 1.824 | 0.021 |
| ROE | 0.149 | 0.842 | −0.091 | −0.134 |
| AUDIT | 0.640** | 1.065* | 1.256* | 0.780* |
| GC | −0.278** | −0.229 | −0.105 | −0.208 |
| R2 | 0.438 | 0.506 | 0.478 | 0.603 |
Source: Research data.
Table 5 presents the model in a global way, and if this is effective to predict the relationship between the variables of environmental performance, transparency and economic performance with the degree of environmental disclosure of the companies analyzed. According to Fávero, Belfiore, Silva, and Chan (2009), from the regression R2, also known as adjustment coefficient or explanation is that it is possible to examine the explanatory capacity of the model. It can be noticed that in 2010 the value of R2 was 0.438, which shows that the independent variables of the study account for 43.80% of the variation in the degree of environmental disclosure. In addition, one can see that in 2013 this amount was the largest of all the years analyzed, i.e., 0.603. Thus, the variables of environmental performance, transparency and economic performance are responsible for 60.30% of the variation in the degree of disclosure of the companies in this period.
It is important to emphasize that the model was significant at a level of 5%, whereas a value of 0.000 was obtained in all the years analyzed. There is a significance level of 1%, and there is strong evidence that the independent variables in this study significantly influence the level of environmental disclosure.
According to data presented in Table 4, it is possible to observe that from the environmental performance, transparency and economic performance variables, at least one variable of each factor had a positive and significant relationship at 5% (p-value <0.05) with the degree of environmental disclosure of Brazilian companies belonging to the IBrX-100 index of the BM&FBovespa in the four years analyzed.
It is important to note that in 2012, the CSI variable showed no value. This was due to the fact that this variable does not show variance between the companies in the sample, since none of the companies analyzed in this year was listed on the Corporate Sustainability Index, indicating that they have not adopted specific rules to disclosure social and environmental information. Thus, by not presenting variation between companies in the sample factor, it had to be removed so that the linear regression could be conducted.
It appears that in 2010 the GRI variables, size, ROA, environmental audit and corporate governance were related, i.e., they influenced the degree of disclosure of the companies analyzed, which shows that these variables help increase the level of environmental disclosure. However, corporate governance had a negative effect.
The corporate governance variable presented a negative and significant relationship only in 2010, at the level of 5%. Thus, it can be understood that companies that do not adhere to best corporate governance levels or are not listed on any level, disclosure more environmental information than companies that are listed on the best levels of governance, such as the Novo Mercado. Ambev is an example of it, which is listed in the traditional level of corporate governance in 2010 and that presented the highest environmental disclosure. It is understood that the fact that the company is listed in any of the levels of governance does not mean that the company shows more environmental information.
In 2011, the significant variables decreased. Only the GRI, size and environmental audit showed a relationship with the degree of environmental disclosure. However, in 2012 and 2013 the GRI and audit variables, which were already significant in other years, showed significance again.
The GRI variable showed significance in all the analyzed years to the level of 1% (p-value <0.01). Therefore, companies that follow the GRI guidelines help increase the degree of environmental disclosure. AES Tietê, Copel, Ecorodovias, Duratex, Energias BR and Pão de Açúcar are examples of companies which followed the GRI guidelines in the four years analyzed and are among the companies that have the greatest degree of environmental disclosure. GRI's guidelines help companies in preparing sustainability reports, and assist companies around the world (GRI, 2013).
Similarly, the variable environmental audit showed to be significant in all the years, but in 2010 it was significant at the level of 5%, unlike other years, during which it was significant at the level of 1%. This shows that companies that have environmental audit help the degree of environmental disclosure to increase. Duratex was the company that stood out, as they have an environmental audit and is among the companies that disclosured environmental information in the four years analyzed.
It was also possible to see the size variable, which was significant at the level of 1% in 2010 and 5% in 2011. From these results it is understood that the larger the size of the examined company, the greater the degree of environmental disclosure. To Patten (2002), larger organizations are more concerned with their image in society and begin to disclosure more environmental information than the others. By analyzing the larger firms, which disclose more environmental information, it was found that Petrobras is among the companies with the highest degree of environmental disclosure.
The ROA was significant at the level of 5% in 2010, which shows that there is a relation with the degree of environmental disclosure of the companies analyzed. Thus, the higher the return on assets, the greater is the degree of disclosure of environmental information. In addition to Assaf Neto and Lima (2009) this is one of the most important indicators of profitability of an organization. Among the companies that have a higher Return on Assets is Ambev, which in 2010 was one of the companies which disclosed the most environmental information.
Among the variables that have shown a positive coefficient, but were not significant, there is the pollution potential, which belongs to the environmental performance factor and to the stock variable, and the ROE, which belongs to the economic performance factor. As for the ROA variables, stocks and corporate governance, they presented a positive relation. However, it was not significant in all the years analyzed. Therefore, it would be necessary to conduct further studies to verify this relationship, since in the present study there was no significant relationship.
It can be noted that the transparency and environmental performance factors in all the years analyzed had at least one significant variable, such as the GRI, which belongs to the environmental performance factor, and the environmental audit and corporate governance variables, which belong to the transparency factor. According to this result, the arguments of Al-Tuwaijri et al. (2004) are used, that state that companies with better environmental performance are the ones that disclose the most environmental information, since as stated by Freedman and Patten (2004), a negative environmental performance makes society pressure even more these organizations so that they change their performance. The GRI, which has guidelines for the elaboration of reports, increases even more the degree of transparency and consistency (GRI, 2013). As for transparency, Rosa et al. (2014) state that companies’ decisions are influenced by forces related to accountability, which concedes that transparency is highlighted in the international arena.
The economic performance variable (size) was significant, but not in all the years analyzed. In this case, it is important that all companies, regardless of their size, worry about the environment and disclose more environmental information in their reports. According to Assaf Neto and Lima (2009), profitability indicators aim at assessing the results of a company in relation to parameters that reveal the best of its dimensions. Size is considered an important factor for organizations because the larger companies, the more they care about their image in society and greater is the disclosure of environmental information (Patten, 2002).
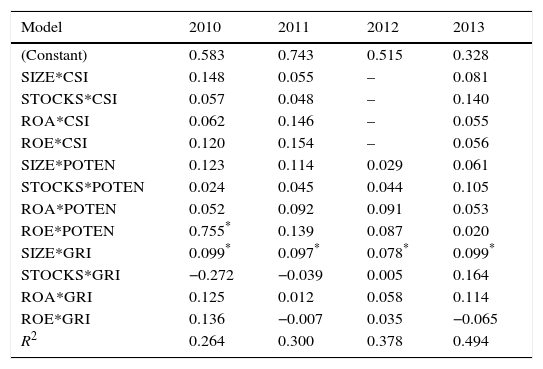
4.3Relation between factorsAfter meeting the conditions, a linear regression was conducted to verify the relation between the moderated factors. Table 6 presents a summary of the model and the multiple linear regression.
Summary of the model and the multiple linear regression of the economic performance moderated by the environmental performance.
| Model | 2010 | 2011 | 2012 | 2013 |
|---|---|---|---|---|
| (Constant) | 0.583 | 0.743 | 0.515 | 0.328 |
| SIZE*CSI | 0.148 | 0.055 | – | 0.081 |
| STOCKS*CSI | 0.057 | 0.048 | – | 0.140 |
| ROA*CSI | 0.062 | 0.146 | – | 0.055 |
| ROE*CSI | 0.120 | 0.154 | – | 0.056 |
| SIZE*POTEN | 0.123 | 0.114 | 0.029 | 0.061 |
| STOCKS*POTEN | 0.024 | 0.045 | 0.044 | 0.105 |
| ROA*POTEN | 0.052 | 0.092 | 0.091 | 0.053 |
| ROE*POTEN | 0.755* | 0.139 | 0.087 | 0.020 |
| SIZE*GRI | 0.099* | 0.097* | 0.078* | 0.099* |
| STOCKS*GRI | −0.272 | −0.039 | 0.005 | 0.164 |
| ROA*GRI | 0.125 | 0.012 | 0.058 | 0.114 |
| ROE*GRI | 0.136 | −0.007 | 0.035 | −0.065 |
| R2 | 0.264 | 0.300 | 0.378 | 0.494 |
Source: Research data.
From Table 6 it is possible to see that if, in a global way, the model is able to predict the relationship between the economic performance factor and the degree of environmental disclosure, moderated by the environmental performance factor. In 2013 we obtained the highest value of R2, i.e., 0.494. This shows that the independent variables are responsible for 49.40% of the variation in the degree of environmental disclosure.
It is important to highlight that the ANOVA test was significant at 5%, and there is strong evidence that the independent variables of the study significantly influence the level of environmental disclosure for companies in the sample.
From the data presented in Table 6 it can be verified that from the economic performance variables that were moderated with the environmental performance variables, only the ROE which was moderated by the pollution potential variable in 2010 and the size which was moderated by the GRI variable presented in all of years a statistical significance at the level of 1% (p-value <0.01), which shows that there is a relationship between the economic performance factor and the degree of environmental disclosure moderated by the environmental performance factor, however, only with these two moderations.
In 2010 the variable Return on Equity moderated by the Pollution Potential (ROE*POTEN) presented relation to the degree of environmental disclosure. It is understood that companies with higher return on equity and higher pollution potential seek to disclose more environmental information, which increases the degree of disclosure. An example of it is Ecorodovias, which in 2010 got the third position in the ranking of environmental disclosure among the 97 companies analyzed, which means that they had the third best degree of disclosure, a high ROE and a high potential of pollution and consequently disclosed more.
In this respect, another moderate variable that is correlated with the degree of environmental disclosure is the size, which when moderated by the GRI was significant in all the years analyzed. In the individual relationship with the degree of disclosure was significant only in two years. An explanation for this significance is the variable that moderated it, i.e., GRI. Thus, it is understood that there is a positive and significant relationship in all the years analyzed between the company's size and the degree of environmental disclosure, when moderated by the GRI.
In this context, there is Copel, because this company is among the 20 with the highest degree of environmental disclosure in all the years analyzed, and it is among the largest companies analyzed when the size is assessed. Also, every year, it has followed GRI's guidelines for elaborating their reports.
It was possible to verify that moderate variables (SIZE*CSI, STOCKS*CSI, CSI*ROA, ROE*CSI, SIZE*POTEN, STOCKS*POTEN, ROA*POTEN, STOCKS*GRI, ROA*ROE AND GRI*GRI) presented a positive relation but not significant. Thus, it appears that the variables of economic performance, when moderated by the CSI do not present statistical significance in any of the years analyzed due to the fact that few companies adhere to this index. However, when analyzing the CSI compared individually with the degree of environmental disclosure, this variable was not significant. It is necessary to conduct further studies to verify this relationship, since in this case the prevalence was not found significant.
Similarly, the ROA and stocks variables that belong to the economic performance factor failed to gain strength in moderation with the pollution potential and the GRI and present significant relationship with the degree of environmental disclosure. Size, moderated by the pollution potential and ROE moderated by GRI were also not significant. Furthermore, among these moderations, the variables stocks and ROE moderated by GRI showed negative coefficient. Therefore, it is necessary to conduct further studies to verify this relationship, since in this study there was no significant positive relationship.
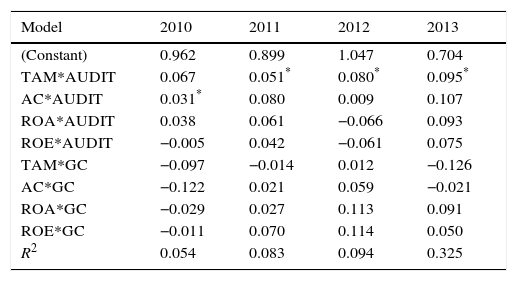
Table 7 shows the summary of the model and the multiple linear regression with the coefficient obtained in each year and, if it was significant at 1% (*) or 5% (**).
Summary of the model and the multiple linear regression of the economic performance moderated by transparency.
| Model | 2010 | 2011 | 2012 | 2013 |
|---|---|---|---|---|
| (Constant) | 0.962 | 0.899 | 1.047 | 0.704 |
| TAM*AUDIT | 0.067 | 0.051* | 0.080* | 0.095* |
| AC*AUDIT | 0.031* | 0.080 | 0.009 | 0.107 |
| ROA*AUDIT | 0.038 | 0.061 | −0.066 | 0.093 |
| ROE*AUDIT | −0.005 | 0.042 | −0.061 | 0.075 |
| TAM*GC | −0.097 | −0.014 | 0.012 | −0.126 |
| AC*GC | −0.122 | 0.021 | 0.059 | −0.021 |
| ROA*GC | −0.029 | 0.027 | 0.113 | 0.091 |
| ROE*GC | −0.011 | 0.070 | 0.114 | 0.050 |
| R2 | 0.054 | 0.083 | 0.094 | 0.325 |
Source: Research data.
According to the data presented in Table 6, it is possible to notice that the model, in a global way, is able to predict the relationship between the economic performance factor and the degree of environmental disclosure, moderated by the transparency factor. In 2013, the highest R2 value was obtained: 0.325 – which show that the independent variables are responsible for 32.50% of the degree variation of environmental disclosure in this period. It is important to highlight that the ANOVA test showed significance at the level of 5% and there is strong evidence that the independent variables which were analyzed significantly influence the degree of environmental disclosure.
The data revealed that, in 2010, only the stocks variable moderated with the audit variable presented a relation with the degree of environmental disclosure. From this result, it is possible to understand that the higher the stocks and in case the company has environmental audit, higher will be the companies’ disclosure in that year. One example of it is Petrobrás and Natura since, in the ranking of environmental disclosure, they were in 10th and 15th position respectively in 2010, and they presented the highest values in relation to the Stocks and the environmental audit.
Apart from this significant moderation, the variable size, moderated with the audit variable presented a positive and significant relation to the environmental disclosure in the years of 2011, 2012 and 2013. The bigger the company is and in case the company has environmental audit, higher will be the degree of environmental disclosure. Duratex is an example of it, because it has been among the biggest companies in the last four years, it follows the rules of the GRI, and it is first in the ranking of environmental disclosure in the years of 2011, 2012 and fifth in 2013.
No variable related to economic development has shown to be significant when moderated with Corporate Governance. Besides, the variables of Return on Total Asset and Return on Equity, moderate by the variable environmental audit and size, stocks ROA and ROE moderated by the Corporate Governance in at least one of the analyzed years presented a negative relation. However, it is not significant. Thus, new research is necessary to verify this relationship, since that, in this study, there was no significant relation.
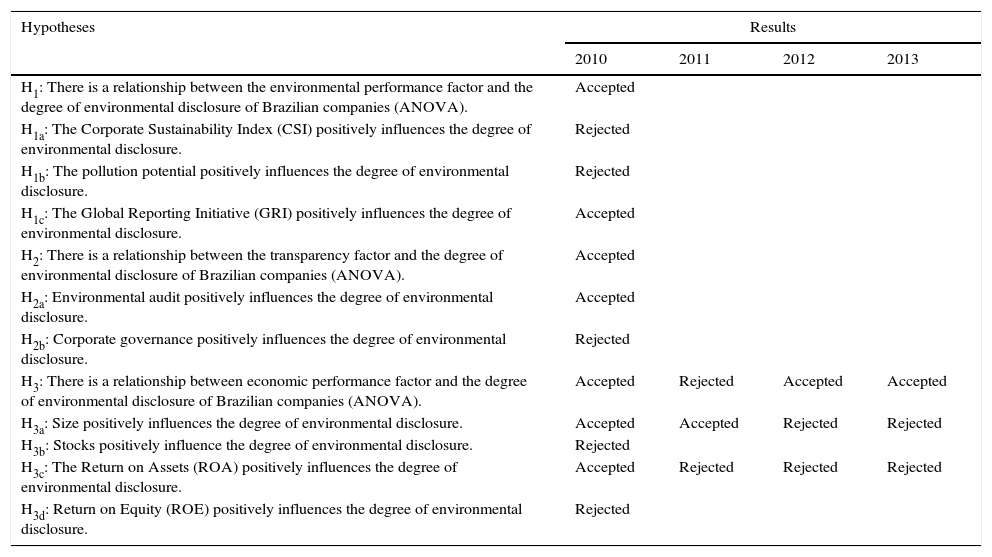
4.4Discussion of the resultsAccording to the data obtained initially, the hypotheses of the study and its results are presented in Table 8.
Summary of the results of research hypotheses.
| Hypotheses | Results | |||
|---|---|---|---|---|
| 2010 | 2011 | 2012 | 2013 | |
| H1: There is a relationship between the environmental performance factor and the degree of environmental disclosure of Brazilian companies (ANOVA). | Accepted | |||
| H1a: The Corporate Sustainability Index (CSI) positively influences the degree of environmental disclosure. | Rejected | |||
| H1b: The pollution potential positively influences the degree of environmental disclosure. | Rejected | |||
| H1c: The Global Reporting Initiative (GRI) positively influences the degree of environmental disclosure. | Accepted | |||
| H2: There is a relationship between the transparency factor and the degree of environmental disclosure of Brazilian companies (ANOVA). | Accepted | |||
| H2a: Environmental audit positively influences the degree of environmental disclosure. | Accepted | |||
| H2b: Corporate governance positively influences the degree of environmental disclosure. | Rejected | |||
| H3: There is a relationship between economic performance factor and the degree of environmental disclosure of Brazilian companies (ANOVA). | Accepted | Rejected | Accepted | Accepted |
| H3a: Size positively influences the degree of environmental disclosure. | Accepted | Accepted | Rejected | Rejected |
| H3b: Stocks positively influence the degree of environmental disclosure. | Rejected | |||
| H3c: The Return on Assets (ROA) positively influences the degree of environmental disclosure. | Accepted | Rejected | Rejected | Rejected |
| H3d: Return on Equity (ROE) positively influences the degree of environmental disclosure. | Rejected | |||
Source: Research data.
According to the results of research hypotheses presented in Table 7, it appears that there is a relation between the environmental performance factor and the degree of environmental disclosure of Brazilian companies belonging to the IBrX-100 index listed on the BM&FBovespa, in the years of 2010, 2011, 2012 and 2013 due to the fact that the ANOVA was significant, i.e., the environmental performance was related to the degree of environmental disclosure, which allows us to accept the H1 hypothesis for the four years analyzed.
The relationship between environmental performance and the degree of environmental disclosure was found in the studies of Iatridis (2013) and Rosa et al. (2013, 2014) and the results of those studies corroborate to the results of the present study, since it concluded that the environmental performance was positively associated with the level of environmental disclosure obtained through the Sustainability and Annual Reports.
With regard to the first sub-hypothesis of the research, designed to verify if the Corporate Sustainability Index (CSI) positively influences the degree of environmental disclosure, it was found that in none of the analyzed years did the CSI positively influence the degree of disclosure and, thus, the hypothesis H1a is rejected. These findings corroborate the results of Rosa et al. (2014), which found that the CSI was not positively related to the level of environmental disclosure and contradict the results found by Coelho, Ott, Pires, and Alves (2013), since they found that the CSI significantly influenced the level of disclosure.
The second research sub-hypothesis searched to ascertain whether the pollution potential positively influences the degree of environmental disclosure. The results found reject sub-hypothesis H1b, because in none of the four examined years the potential influenced the degree of disclosure, which corroborates the results of the studies conducted by Clarkson, Fang, Li, and Richardson (2013). However, it goes against the findings of Braga et al. (2009), Silva-Gao (2012), Zeng et al. (2010), Rosa et al. (2013, 2014), Silva et al. (2013), Iatridis (2013) and Wegener et al. (2013), which showed through their results that potentially polluting companies have positive relationship with the level of environmental disclosure.
Regarding the third sub-hypothesis, which had the aim of verifying if the Global Reporting Initiative (GRI) positively influenced the degree of environmental disclosure, the results indicated that there is a positive influence of the GRI to the degree of environmental disclosure in all of the analyzed years and thus the sub-hypothesis H1c can be accepted. This result is in agreement with the findings of Galani, Gravas, and Stavropoulos (2012), Moroney, Windsor, and Aw (2012), Lu and Abeysekera (2014) and Rosa et al. (2014), which also found that the GRI had positive relationship with the degree of environmental disclosure, i.e., companies that follow the GRI guidelines, prepare their reports in accordance with the rules, have greater commitment to environmental protection and have a higher degree of environmental disclosure.
The second hypothesis of the study was related to investigating the relationship between the transparency factor and the degree of environmental disclosure of the Brazilian companies. Therefore, the hypothesis H2 can be accepted, because a relationship was found in all of the years analyzed in the study, according to the ANOVA test which was performed. Transparency in this study was tested from the Environmental Audit and Corporate Governance.
The first sub-hypothesis regarding the transparency factor was to check whether the Audit positively influences the degree of environmental disclosure. From the results obtained in the study it was possible to accept the hypothesis H2a, as the Audit exerted influence in all of the analyzed years on the degree of environmental disclosure, that is, companies that have environmental audit have a higher degree of environmental disclosure. Given the above results, the findings of Moroney et al. (2012), Mahjoub and Khamoussi (2013), Iatridis (2013) and Rosa et al. (2014) corroborate the results obtained in the present study, in relation to the audit factor. It is important to highlight that many of the companies that have environmental audit only have this information in their reports, however, do not explain how it is performed.
The second sub-hypothesis related to the transparency factor examined whether the Corporate Governance positively influences the degree of environmental disclosure. From the results, it was found that H2b is rejected, as in none of the analyzed years did Governance positively influence the degree of disclosure. Only in 2010 there was some influence, however, negative. The results obtained in this study differ from the findings of Murcia and Santos (2009), Rupley, Brown, and Marshall (2012), Mallin, Michelon, and Raggi (2013), Meng et al. (2013) and Peters and Romi (2013). In this case, only the first study is developed in Brazil. However, the results of the studies of Braga et al. (2009), Silva et al. (2013) and Rosa et al. (2014), held in Brazil, are consistent with those findings.
The third hypothesis of the study aimed to determine whether there is a relationship between the economic performance factor and the degree of environmental disclosure of Brazilian companies. The hypothesis was rejected only in 2011, since there was no link between economic performance and the degree of environmental disclosure. However, in the years of 2010, 2012 and 2013 there was a relationship. One explanation for this would be, according to Andrikopoulos and Kriklani (2013) the increase of profitability, and that this is related to the Company Size, Stocks, ROA and ROE, and that it weakens the incentives for companies to achieve their legitimacy by alternative means, such as the Sustainability Report.
Regarding the first sub-hypothesis related to the economic performance factor, it was found that the size positively influences the degree of environmental disclosure of companies. From the results found one can accept H3a for the years of 2010 and 2011 and rejected it in 2012 and 2013. Only in 2010 and 2011 the size of the analyzed companies positively influenced the degree of environmental disclosure.
Thus, the finding is consistent with the results obtained by Hackston and Milne (1996), Braga et al. (2009), Murcia and Santos (2009), Galani et al. (2012), Andrikopoulos and Kriklani (2013), Bowrin (2013), Mahjoub and Khamoussi (2013), Peters and Romi (2013), Wegener et al. (2013), Coelho et al. (2013), Iatridis (2013), Lu and Abeysekera (2014) and Rosa et al. (2014). In this period the result was in line with the finding of Bouten et al. (2012), who found that the size only influences the decision to disclosure, but it does not influence the degree of environmental disclosure, which may have happened in the study for the years 2012 and 2013, since in those two years the hypothesis was rejected. However, it differs from the findings of Bouten et al. (2012) and Omnamasivaya and Prasad (2016).
The second sub-hypothesis related to economic performance aims at verifying if the stocks positively influence the degree of environmental disclosure. From the results found, H3b is rejected, since the actions of the analyzed companies did not influence it in any of the analyzed years. This finding is consistent with the results of Braga et al. (2009) and Wirth, Kulczycka, Hausner, and Koński (2016). Goes against the findings of Clarkson et al. (2013), Iatridis (2013) and Rosa et al. (2014) who found that the stocks are positively related to the degree of environmental disclosure of companies.
Regarding the third sub-hypothesis of the economic performance factor, it sought to verify if the Return on Assets (ROA) positively influenced the degree of environmental disclosure. From the results found, H3c was accepted for the year of 2010 and was discarded for the years of 2011–2013. Only in 2010 the return on assets of the analyzed companies positively influenced the degree of environmental disclosure.
Given this finding, it can be seen that the results of Hackston and Milne (1996), Bowrin (2013), Peters and Romi (2013), Wegener et al. (2013), Moroney et al. (2012) and Wirth et al. (2016), are in line with the results found in this study. The results identified by Silva-Gao (2012), Andrikopoulos and Kriklani (2013), Rosa et al. (2013, 2014) and Lu and Abeysekera (2014) go against the findings of this study, as these authors found that the companies with a higher ROA are more likely to disclose environmental information.
Finally, the fourth sub-hypothesis of the study, in relation to economic performance, aims to verify if the return on equity (ROE) positively influences the degree of environmental disclosure. From the results it was found that in all the analyzed years ROA did not influence the degree of disclosure of the companies. Thus the H3d hypothesis is rejected.
Therefore, studies of Hackston and Milne (1996), Braga et al. (2009), Galani et al. (2012), Rosa et al. (2014) and Wirth et al. (2016) corroborate the findings of this research. However, studies by Rosa et al. (2013), Andrikopoulos and Kriklani (2013), Lu and Abeysekera (2014) and Omnamasivaya and Prasad (2016) go against the results of this study, since it found that there was a positive influence of ROE to the degree of environmental disclosure.
Regarding the moderate variables, when looking at the relationship between economic performance factor and the degree of moderate environmental disclosure by the environmental performance factors and the transparency of Brazilian companies listed on the IBrX-100 BM&FBovespa, as a results, it was found that only in 2010 the ROE variable, moderated by the potential of pollution, presented a relationship to the degree of environmental disclosure. Thus, the greater the ROE of the analyzed companies in this year was and the greater the pollution potential was, the greater the degree of environmental disclosure obtained.
Another variable that was related to the degree of environmental disclosure was the size, moderate with the GRI, in all the years that were analyzed. The Corporate Sustainability Index (CSI) was not associated with the degree of environmental disclosure, not when analyzed individually and not so even at the time that was used to moderate other variables. This can be explained by the fact that few companies are listed in this index and, in 2012, none were listed.
It is also important to highlight that there was a relationship between size (economic performance) and the environmental audit (transparency) in the years of 2011–2013 and, a relation between with moderate Stocks with the Audit in 2010. It is understood that the higher the company size is in this period and if the company has environmental audit, the greater the degree of environmental disclosure. Similarly, the higher the stocks were in 2010 and if the company possessed environmental audit, the greater the degree of disclosure was.
Given the degree of environmental disclosure of the analyzed companies, it is important to notice that these companies: Duratex, Ecorodovias, BR Energias and Pão de Açúcar, which were listed in the four analyzed years among the companies that disclosed information, were also among the companies presented in the study conducted by Rosa et al. (2014) as the ones that stood out for their level of environmental disclosure in the Annual Reports.
5Final considerationsIn response to the question study of the problem and the general objective of the research, to analyze the relationship between determinants of information disclosure on the environmental impacts of Brazilian companies, there was a relationship between the information disclosure of determinant factors in all of the years analyzed, because the ANOVA test has shown relationship (statistically significant at 5%) to the degree of environmental disclosure of the companies analyzed.
It was possible to conclude that the variables that have shown to be more related, both individually, and when being analyzed in a moderated way by others are the variable of size, which belongs to the economic performance factor, the GRI, which belongs to the environmental performance factor and the environmental audit, that comprises the transparency factor. Therefore, there was one variable from each factor. Thus, it is understood that the larger the size of the companies, if they follow the GRI guidelines, with regard to environmental disclosure in their reports and if they have environmental audit, the greater the degree of environmental disclosure in relation to the aspects of: Emissions, Effluents, Waste, Products and Services, and Transportation of Brazilian companies analyzed, belonging to Brazil 100 Index (IBrX-100) listed on the BM&FBovespa.
It is noteworthy that from the moderation it was possible to relate the variables of economic performance factor to the degree of environmental disclosure, moderated by the variables that make up the transparency factors and environmental performance, to make it possible, check the factors and variables that are related and increase the degree of environmental disclosure of analyzed Brazilian companies, which was shown from the results obtained in this study.
Companies can increase the degree of environmental disclosure if they disclose more information in their reports on their actions on the environment, especially on the aspect of Transportation, since few of the analyzed companies have this information in their reports. Thus, they will transmit an even better image to society, which in turn will help the company, as investors will see the company through a better perspective and will invest more in these organizations.
Still, it is possible to emphasize that there is a pattern of disclosure in the corporate reports of these companies on environmental information, because, they behave differently from each other and disclose information different from one period to another, which indicates selection of information for environmental disclosure. It is understood that the level of disclosure is insufficient and some of the causes for that are the lack of disclosure of environmental practices, the inefficiency of controls and the lack of motivation for dissemination, which is a research gap.
Although such relationships can be identified in this study, it has also been able to verify that it is important for companies to advertise a greater amount of information to be legitimized in society. This happens at the time when they present their activities in favor of the environment and comply with the values and rules established by society. Importantly, it is increasingly difficult for organizations to achieve legitimacy. Therefore, if companies disclosure as much information about their environmental actions in the Sustainability Reports and Annual Reports, they will be able to achieve the desired of legitimizing faster, which reflect the financial results.
Limitations of this study may be related to the selection of the population and sample, the set of indicators that were used and the techniques for data analysis. It is suggested for future research the application of this research in another sample that includes all companies listed on the BM&FBovespa and even, companies listed on stock exchanges in other countries as well as the use of other features, variables and factors. It is also suggested to carry the work on to analyze the level of disclosure in the coming years. Another recommendation would be to use other moderations and another method, which could bring different results.
Conflict of interestsThe authors declare that they have no conflict of interest.

