


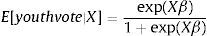
The decision of voter enrollment among Chilean youth is re-examined in this paper. Geographical and gender differences regarding what determines voter-registration rate among youth are also explored. Electoral and socioeconomic data are collected from 272 Chilean counties in order to estimate the fractional-response and the random-effects Tobit models. The results indicate that the voter registration rate is higher among lower-income youth, which differs from earlier studies, and redefines the implications of a class-biased electorate in Chile. Furthermore, the evidence suggests an increasing political disaffection among indigenous youth that reside in rural counties.
La decisión de inscripción electoral entre la juventud chilena es reexaminada en esta investigación. Igualmente, se exploran las diferencias de género y geográficas en la tasa de inscripción electoral. Dado lo anterior, se recopila información electoral y socioeconómica para 272 comunas con el fin de estimar modelos de respuesta-fraccional y Tobit con efecto-aleatorio. Los resultados evidencian una mayor inscripción electoral entre la juventud con menores ingresos, lo que difiere de estudios previos, reformulando las implicaciones de un electorado con sesgo de clase en Chile. Adicionalmente, la evidencia sugiere una creciente desafección política entre la juventud indígena que reside en zonas rurales.
A decisão de inscrição eleitoral entre a juventude chilena é reexaminada nesta pesquisa. Igualmente, exploram-se as diferenças de gênero e geográficas na taxa de inscrição eleitoral. Dado o anterior, se recopila informação eleitoral e socioeconómica para 272 comunas com o fim de estimar modelos de resposta fraccionaria e Tobit com efeito aleatório. Os resultados evidenciam una maior inscrição eleitoral entre a juventude com rendimento mais baixo, o que difere de estudos prévios, reformulando as implicações de um eleitorado com sesgo de classe no Chile. Adicionalmente, a evidencia sugere uma crescente desafeição política na juventude indígena que reside em áreas rurais.
Political apathy among youth has sharply increased over the last decade in Western democracies with a voluntary voting rule. In fact, the European Union has suffered the brunt of this lack of electoral participation in parliamentary elections with turnout rates falling below fifty percent in 2004 (Esser & de Vreese, 2007). In France, the rate of non-registered voters has remained steady around 10% between 1983 and 2001. Nevertheless, the abstention rate increased from 21.6 to 32.7% in the same period, with the young population having the lowest levels of voter enrollment (Pan Ke Shon, 2004). Low turnout among British youth has even motivated the modification of educational curriculum by including citizenship lessons in every secondary school (Kimberlee, 2002). On the other hand, a higher turnout rate has been reported for the youngest or first-time voters in some Scandinavian countries. For instance, in the Danish mayoral election held in 2009, turnout was 57% among 18-year-olds and 42.6% for 21-year-olds (Bhatti, Hansen, & Wass, 2012; Wass, 2007).
In the United States, politicians and scholars have shown concern about the low turnout rates. This has motivated some government and private efforts to encourage electoral participation, such as the National Voter Registration Act (NVRA) of 19931 and Rock the Vote organization. For instance, 21% of citizens aged 18–24 went to the polling stations in the election held in November 2010 (Brandon, 2012). According to the Center for Information and Research on Civic Learning and Engagement (2013), this trend seems to have been broken in the 2012 presidential election where youth turnout was 45%. However, this figure was below 30% in three states: Texas, Oklahoma, and West Virginia.
On the other hand, mandatory voting has increased turnout in several European and Latin American countries (Jackman, 2001; Krasa & Polborn, 2009). Chile joined this group of countries in 1988 by introducing a peculiar voting rule where enrollment was voluntary, but voting was mandatory. The return to democracy in this country member of the Organisation for Economic Co-operation and Development (OECD) prompted a mass of young people to register in the electoral roll; nonetheless, this pattern was not the norm in the last decade (Carlin, 2006; Navia, 2004). In fact, the youth-vote to electoral-roll ratio in Chile has declined from 36% in 1988 to 9.71% in 2005 (Toro, 2007). Furthermore, the enrollment rate of Chilean youth has experienced a striking downturn from 90.7% in 1988 to 17.5% in 2011.
Despite this lack of electoral engagement among Chilean youth, the National Congress of Chile passed a new voting rule: automatic enrollment and voluntary voting. The primal goal of the Act No. 20,568 was to encourage electoral engagement. Nevertheless, its debut was inauspicious in the 2012 mayoral election; the overall abstention rate rose to sixty percent, which has been interpreted by some political analysts as a potential threat to the legitimacy of Chilean democracy. Few works (Corvalán & Cox, 2013; Toro, 2007) have addressed the voter apathy among the young Chilean population despite its negative impact on the renewal of the electoral register and the sustainability of Chilean democracy. These studies offer appealing remarks, but they do not address the economic rationale behind the voter registration decision.
This paper re-examines the decision of voter registration among Chilean youth (ages 18–29) and explores the effects of the gender and geographical differences that determine the voter-registration rate. In this context, the theoretical framework for voter enrollment assumes compulsory voting and allows for the outlining of an empirical model from the aggregation of citizens’ optimal decisions. The longitudinal study uses electoral and socio-economic data from 272 Chilean counties in order to estimate fractional-response and random-effects Tobit models. The new evidence suggests that voter registration is higher among lower-income youth, which differs from earlier studies and restarts the discussion about the implications of a class-biased electorate in Chile.
The rest of the paper is organized as follows: Section 2 briefly reviews the literature on voting behavior and political engagement among the young population. Section 3 outlines the model for the voter enrollment decision where democracy is treated as a public good under a mandatory voting rule. Section 4 describes the data and the empirical strategy. Section 5 discusses the main findings. Section 6 concludes the paper.
2Literature reviewThe first studies on voting behavior were carried out by Downs (1957), Buchanan and Tullock (1962), and Riker and Ordeshook (1968). In this classical approach, it was considered irrational that individuals would renounce their civic duties and jeopardize the viability of the political system. Thus, the potential electorate should value the common good, although a marginal vote may not be decisive in an election's outcome. The literature was mainly developed in the 1970s based on these insights. Preliminary work in this field (Barzel & Silberberg, 1973; Ferejohn & Fiorina, 1974; Frey, 1971; May & Martin, 1975; Tollison & Willett, 1973) focused on giving a theoretical background to electoral participation, and the use of assumptions closely linked to economic rationality allowed one to address major electoral questions.
Initial empirical work (Settle & Abrams, 1976; Silberman & Durden, 1975; Tollison, Crain, & Pautler, 1975) focused primarily on the American presidential and senatorial elections. Most of these electoral studies used aggregated-level data in order to address the determinants of political participation, where demographic, racial, gender, and economic (e.g., income, unemployment) variables were used to explain voter turnout. Matsusaka and Palda (1993) argued that previous empirical studies suffered from the ecological fallacy. Using individual and aggregated level data from Canadian national elections, they found evidence against the victory margin (or closeness) effect and remarked that aggregation bias was present in macro-level estimates.2
Since then, voting behavior literature has diversified its scope. During the last decade, several studies have been conducted on youth vote in a variety of political and cultural contexts. Kimberlee (2002) claimed that there is not a single explanation for political disaffection among British youth. He grouped several explanations for this phenomenon into four approaches: youth, politics, alternative values, and generational characteristics of young people. The evidence reported by Wass (2007) for Finland and Esser and de Vreese (2007) for the United States and the European Union, for instance, could be classified in the first and fourth approaches identified by Kimberlee (2002).
Experiments in political engagement among youth were carried out by Blais and Young (1999) and Xenos and Kyoung (2008). An experiment conducted by Michelson (2006) aimed at assessing the effectiveness of Latino and non-Latino canvassers on voter turnout in the 2002 gubernatorial election. The experiment was carried out in Fresno, California, and the results suggested that the effect of canvasser ethnicity on youth turnout was not statistically significant. These findings supported the notion that non-Latino canvassers could be hired to reach young Latino voters. Although the canvassing effect on Latino turnout was low for non-voters in the short term, it is expected that future door-to-door efforts will turn them into systematic voters.
On the other hand, a theoretical discussion on youth vote was addressed by Gersbach and Kleinschmidt (2009). The authors presented a theoretical model where voters from different age groups (i.e., young and old people) interact in order to build a sustainable democratic system.
In general, the economic study of electoral engagement in Chile has not been prolific. To our knowledge, most of the Chilean electoral studies have addressed the impact of macroeconomic performance on election outcomes. Engel and Araos (1989) and Panzer and Paredes (1991) analyzed the role of economic variables and political ideologies on the presidential referendum held in 1988. They found evidence that the unemployment rate played a key role in reducing the probability of an incumbent's re-election, in this case the prolongation of General Augusto Pinochet in power. More recent investigation from Cerda and Vergara (2007, 2008) supports the idea that, despite the prevailing economic scenario, the granting of government subsidies benefits presidential re-election.
In particular, an issue that deserves attention is the sharp downturn in voter registration and turnout rates experienced in Chile throughout the last fifteen years. Recent evidence (Carlin, 2006; Contreras & Navia, 2013) suggests that lower voter turnout has been associated with a generational change in the Chilean electorate. In this regard, the decision of voter registration among the young Chilean population has been studied by Toro (2007) and Corvalán and Cox (2013). Toro (2007) used the 2005 Youth and Politics survey to address the political behavior of adults aged 18–24 years.3 According to his results, the enrollment probability is influenced by education, age, poverty rate, civic participation, political socialization inside family and peer groups, and motivational variables. Corvalán and Cox (2013) used micro-level data from the Latin American Public Opinion Project (LAPOP) and found evidence that the low registration rate of Chilean youth (i.e., ages 18–29) has been due to income inequalities and decreasing political interest. The authors remarked that the resulting class-biased electorate constitutes a threat to the legitimacy of Chilean democracy because wealthier youth are willing to participate more in politics than their poorer counterparts. Both electoral studies used micro-level data and offered appealing remarks; however, their empirical approach does not state explicitly the economic rationale behind voter registration, a topic that this paper aims to address.
3Theoretical frameworkThe current work uses the theoretical framework proposed by Acuña-Duarte (2017) in order to address the decision of voter registration among Chilean youth.4 The economic rationale behind the enrollment decision is outlined in the following assumptions and relationships.
Suppose that a democratic society allows voluntary voter registration, but mandatory voting. Therefore, abstention is not allowed in this society, which is populated by n citizens that have preferences over a consumption good, leisure, and democracy.
The private demand for the consumption good is denoted by x and its price is given by px. The available time can be distributed as follows: each citizen (i) can allocate a fraction to work (hi) in the labor market and earn a nominal wage (w). On the other hand, the individual can assign a fraction to enjoy leisure (li) in the form of costless activities that are linked to civic participation. Thus, the time constraint is: li+hi=1.
As highlighted by Acuña-Duarte (2017), the concept of democracy used in the model has been restricted to electoral participation.5 Furthermore, the model recovers the classical notion argued by Downs (1957) that democracy is a public good. In this framework, citizens value the democratic institutions that prevail in the society in order to guarantee the stability of the political system and democratic legitimacy. Thus, citizens can contribute to strengthening democracy, d, by being part of the electoral roll and performing their civic duties. Therefore, the utility function for citizen i is given by:
where u(·) is a continuous, increasing, and at least twice differentiable function in the consumption good, x, leisure time, l, and democracy, d.
Regarding civic participation, each individual must decide whether to be part of the electoral roll or not. This decision is represented by ri. If citizen i decides to be enrolled in the voter register, then ri will be equal to one, and zero otherwise. Moreover, the enrollment decision implies a nominal cost cr, which summarizes all the costs related to voting such as transportation costs, a fine for not attending to vote, or a poll tax.6 Thus, each citizen has to face the following budget constraint in real terms:
where δ=cr/px is the real cost of being enrolled as a voter and ω=w/px is the real wage. Note that if automatic enrollment is assumed, as it is in the new Chilean voting rule of 2012, then the voter registration decision, ri, could be interpreted as the voting decision. In this case, the key implication of the model remains the same. That is, the reduction or removal of voting (or registration) costs will not guarantee larger turnout rates or avoid a crisis of representation, especially if democracy is heterogeneously valued by citizens.
The population's willingness to actively participate in the democratic system can be reflected in the electoral roll, R, which is composed of the sum of individuals that decided to be enrolled in it. Given that democracy d is treated as a public good, assume that d is a function of the electoral register, R. That is, d=f(R), where f(·) is a continuous, increasing, and at least twice differentiable function.
To sum up, each citizen i must solve the following problem:
where xi≥0, li and hi∈[0, 1], ri=0, 1, R≥0, and d≥0.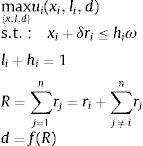
On the other hand, Downs (1962) argued that democratic governments’ actions are motivated by the public interest. Consequently, in this model the policy maker must search for the common good, which implies solving a problem that can be outlined as follows:
where xi≥0, li and hi∈[0;1], ri=0, 1, R≥0, and d≥0. Combining the first-order necessary conditions from the policy maker's problem, we have that:
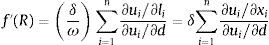
The above equilibrium condition yields the optimal values for the demand of the consumption good, xi*, leisure time, li*, labor supply, hi*, enrollment status, ri*, supply of democracy, d*, and the electoral roll, R*. From these values, the following concepts can be defined. The voter registration rate, ν, is given by:

In addition, the model allows us to address civic participation among the population. That is to say, citizens can devote leisure time to traditional forms of civic participation, which are assumed to be costless. In that regard, volunteering, sports activities, religious organizations, student organizations, and union membership can be classified as civic participation activities. Therefore, the civic participation rate, κ, is defined as follows:

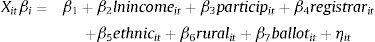
Notice that an empirical model can be derived from Eq. (5) after assuming specific functional forms for democracy and utility functions (see Appendix for details). In particular, the voter-registration rate, ν, can be estimated from the following empirical specification:
where ω is the real wage, κ is the civic participation rate, δ is the real cost of voter registration, β represents the parameters to be estimated, ¿ the error term, and i might be a county, region, state, or country. Furthermore, the empirical model defined in Eq. (8) exhibits two main characteristics: first, it is consistent with the classical empirical literature on voting behavior (Silberman & Durden, 1975; Tollison et al., 1975). And second, it was outlined from the aggregation of citizens’ optimal responses. The next section describes the empirical strategy used in the current electoral study.4Empirical strategy and data4.1Data
The electoral study was focused on the Chilean youth vote. It used electoral and socio-economic data that was obtained from the Chilean Electoral Service (SERVEL), National Institute of Statistics (INE), and the household survey of National Socioeconomic Characterization (CASEN) carried out in 2000, 2003, 2006, 2009 and 2011.7
Preliminary analysis of Chilean electoral data suggests that the youth vote has lost more than 580,000 voters between 2000 and 2011. Moreover, the youth electorate has lost more male than female voters during this period. As shown in Fig. 1, the enrollment rate of the former dropped 25.4-percentage points, while the latter fell 20.2-percentage points over the same period.
, period 2000–2011.")
The geographical disaggregation revealed that voter registration among youth has experienced a dramatic downturn in some regions. As illustrated in Fig. 2, the lowest enrollment rates in 2011 were reported in northern regions, such as Antofagasta (11.9%), Coquimbo (13.2%), and Atacama (14.8%). In addition, the Metropolitana region, where 40% of the Chilean population is concentrated, had an enrollment rate of 15.3% in the same year.

The electoral study included only 272 out of 346 Chilean counties for the following reasons: first, four counties were created in 2004; therefore, they were not part of CASEN 2000 and 2003 surveys.8 Second, 68 counties were not included in the CASEN survey of the years 2000, 2003, or 2011.9 Finally, Easter Island and Juan Fernandez were not considered in the design of CASEN survey until 2011.
Moreover, each county was classified as urban or rural based on the criteria defined by OECD (2011) which categorizes the regions of a country as predominantly rural, intermediate, or predominantly urban. This typology considers as classification criteria the population density, rural population, and the presence of urban centers.10
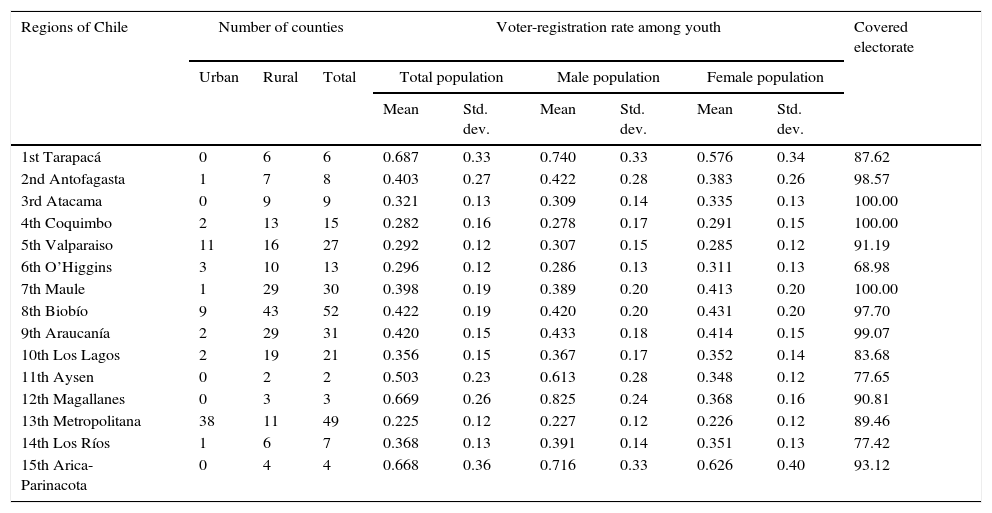
In that regard, Table 1 details the geographical composition of the sample's regional means and standard deviations for voter-registration rate among youth, including the percentage of the young electorate that was covered by the sample. From this table it can be inferred that the most densely populated regions (i.e., Metropolitana, Biobío, and Valparaíso) have, on average, an electorate covered by the sample of greater than 90%, while O’Higgins region has the lowest coverage. Accordingly, all the counties included in the sample represented a 93.2% of youth vote in 2000 and 89.8% in 2011. In addition, extreme regions of Chile exhibit marked gender differences in the rate of voter registration among young population, e.g., the northern regions of Tarapacá and Arica-Parinacota.
Sample composition and descriptive indicators at the regional level, years 2000–2011.
| Regions of Chile | Number of counties | Voter-registration rate among youth | Covered electorate | |||||||
|---|---|---|---|---|---|---|---|---|---|---|
| Urban | Rural | Total | Total population | Male population | Female population | |||||
| Mean | Std. dev. | Mean | Std. dev. | Mean | Std. dev. | |||||
| 1st Tarapacá | 0 | 6 | 6 | 0.687 | 0.33 | 0.740 | 0.33 | 0.576 | 0.34 | 87.62 |
| 2nd Antofagasta | 1 | 7 | 8 | 0.403 | 0.27 | 0.422 | 0.28 | 0.383 | 0.26 | 98.57 |
| 3rd Atacama | 0 | 9 | 9 | 0.321 | 0.13 | 0.309 | 0.14 | 0.335 | 0.13 | 100.00 |
| 4th Coquimbo | 2 | 13 | 15 | 0.282 | 0.16 | 0.278 | 0.17 | 0.291 | 0.15 | 100.00 |
| 5th Valparaiso | 11 | 16 | 27 | 0.292 | 0.12 | 0.307 | 0.15 | 0.285 | 0.12 | 91.19 |
| 6th O’Higgins | 3 | 10 | 13 | 0.296 | 0.12 | 0.286 | 0.13 | 0.311 | 0.13 | 68.98 |
| 7th Maule | 1 | 29 | 30 | 0.398 | 0.19 | 0.389 | 0.20 | 0.413 | 0.20 | 100.00 |
| 8th Biobío | 9 | 43 | 52 | 0.422 | 0.19 | 0.420 | 0.20 | 0.431 | 0.20 | 97.70 |
| 9th Araucanía | 2 | 29 | 31 | 0.420 | 0.15 | 0.433 | 0.18 | 0.414 | 0.15 | 99.07 |
| 10th Los Lagos | 2 | 19 | 21 | 0.356 | 0.15 | 0.367 | 0.17 | 0.352 | 0.14 | 83.68 |
| 11th Aysen | 0 | 2 | 2 | 0.503 | 0.23 | 0.613 | 0.28 | 0.348 | 0.12 | 77.65 |
| 12th Magallanes | 0 | 3 | 3 | 0.669 | 0.26 | 0.825 | 0.24 | 0.368 | 0.16 | 90.81 |
| 13th Metropolitana | 38 | 11 | 49 | 0.225 | 0.12 | 0.227 | 0.12 | 0.226 | 0.12 | 89.46 |
| 14th Los Ríos | 1 | 6 | 7 | 0.368 | 0.13 | 0.391 | 0.14 | 0.351 | 0.13 | 77.42 |
| 15th Arica-Parinacota | 0 | 4 | 4 | 0.668 | 0.36 | 0.716 | 0.33 | 0.626 | 0.40 | 93.12 |
The electoral study used three econometric approaches in order to address the fact that the dependent variable (i.e., voter-registration rate among youth) belongs to the unit interval [0,1]. The first approach consisted of the fractional-response-variable model proposed by Papke and Wooldridge (1996). In this regard, the youth vote ratio was modeled through the following pooled fractional logit (PFL) regression:
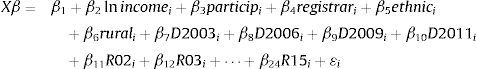
In this empirical specification, the dependent variable youthvote was given by the youth-vote-to-population ratio (i.e., 18–29-year-olds) at the county level.11 This indicator was also computed for the male and female electorates using available data at SERVEL.
As described in previous section, the empirical model was outlined from the aggregation of optimal decisions made by citizens who act rationally in politics. That specification suggested the use of three regressors (real income, civic participation rate, and the real cost of voter registration), which were computed as follows: the real income, lnincome, was measured by the natural logarithm of the average real income at the county level, expressed in Chilean pesos of 2015. This regressor was obtained from the CASEN survey using the variable YAUTAJ that considers the autonomous income and excludes subsidies from the government. The rate of civic engagement, particip, for county i was computed from the questions P18, R18, T18A, and R9, that were included in the CASEN survey carried out in 2000, 2003, 2009, and 2011.12 Since this sort of questions was excluded from CASEN 2006, then the gap was filled with the 2003–2009 average.13 The number of voter registrar's offices, registrar, in county i was used as a proxy for the cost of voter registration. During the 2000–2011 period, 56 new registrar's offices were created, reaching 564 voter-enrollment places by the end of the year 2011.
Moreover, the rate of ethnic population, ethnic, and the share of rural population, rural, were used as control variables. The rate of ethnic population in county i, ethnic, considered those ethnic groups recognized by the Chilean Indigenous Act and listed in the CASEN survey, that is: Aymara, Rapa-nui, Quechua, Mapuche, Atacameño, Coya, Kawesqar, Yagan, and Diaguita. Finally, in the above empirical model, D2003, D2006, D2009, and D2011 are year dummies; R01, R02, R03, R04, …, and R15 are regional dummies; and ¿ is the error term.
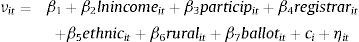
In the second approach, the empirical strategy adopted the panel-data approach in the form of a two-limit random effects Tobit (2LRET) model.14 Thus, under the corner-solution specification, the empirical model can be stated as follows:
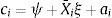
where youthvoteit denotes the voter-registration rate, i.e. youth vote ratio, in county i at time t, rj is the enrollment decision of a citizen j that resides in a county populated by n individuals, and νit is given by:where the variables lnincome, particip, registrar, ethnic, and rural are defined as above. In this second empirical specification, year dummies were replaced with the binary variable ballot in order to control the effect of an impending election on voter registration. That is, the variable ballot takes the value of one if an election is held in time t and zero otherwise. During the sample period, three elections were held in Chile: the 2000 mayoral election, and the 2009 presidential and congressional elections. Finally, ci is the unobserved heterogeneity and ηit the idiosyncratic error, where ci and ηit are independent, ci|X∼N(0,σc2), and ηit|X,ci∼N(0,ση2).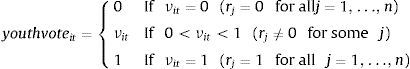
And for the third approach, the electoral study followed Papke and Wooldridge (2008) in order to broaden the panel-data approach. The technique was developed by the authors for a fractional dependent variable, where the unobserved heterogeneity is allowed to be correlated with regressors as suggested by Mundlak (1978) and Chamberlain (1980). Hence, the fractional response probit (FRP) model for the voter-registration rate among youth is outlined as follows:
where Φ(·) is the standard normal cumulative distribution function, the regressors lnincome, particip, ethnic, registrar, rural, and ballot are defined as above, ηit is the idiosyncratic error, and the unobserved heterogeneity ci is distributed ci|X∼N(ψ+X¯iξ,σa2), where X¯i is the 1×m vector of time averages for time-varying regressors.
In order to explore gender and geographical differences in voter-registration rate, the above models were estimated for male and female populations and for urban and rural counties. The results are discussed below.
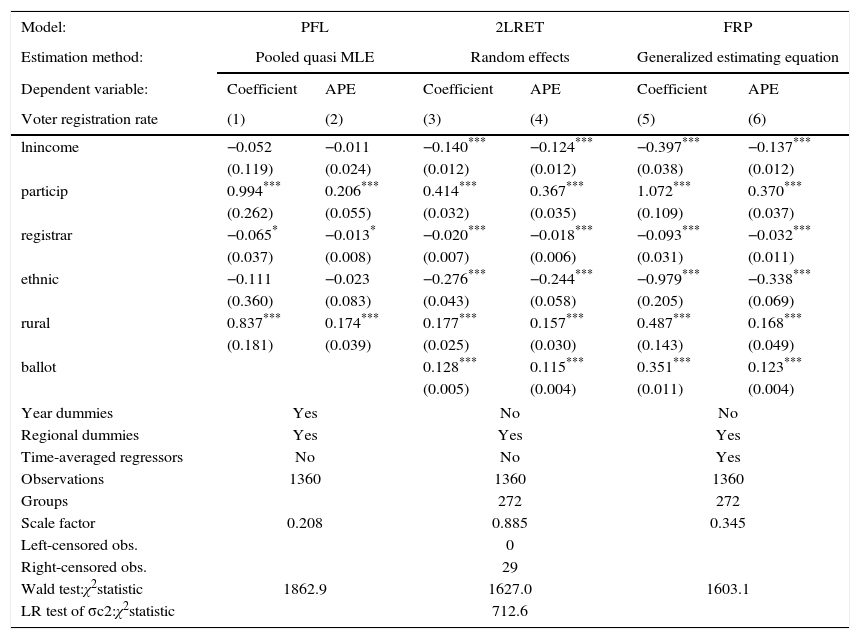
5Main findings and discussionTable 2 reports the estimated coefficients and average partial effects (APE) from the three econometric approaches described in previous section, i.e., pooled fractional logit (PFL), two-limit random effects Tobit (2LRET), and fractional response probit (FRP). In general, the coefficients and APEs were significant at the 1% level for all regressors, except the income and ethnicity effects that were not significant in the PFL model. Moreover, the likelihood-ratio test reported for the 2LRET model confirmed that the panel-level variance component is relevant; thus, a pooled Tobit regression can be discarded.
Estimates of the pooled fractional logit (PFL), two-limit random effects Tobit (2LRET), and fractional response probit (FRP) models for youth vote ratio, all counties.
| Model: | PFL | 2LRET | FRP | |||
|---|---|---|---|---|---|---|
| Estimation method: | Pooled quasi MLE | Random effects | Generalized estimating equation | |||
| Dependent variable: | Coefficient | APE | Coefficient | APE | Coefficient | APE |
| Voter registration rate | (1) | (2) | (3) | (4) | (5) | (6) |
| lnincome | −0.052 | −0.011 | −0.140*** | −0.124*** | −0.397*** | −0.137*** |
| (0.119) | (0.024) | (0.012) | (0.012) | (0.038) | (0.012) | |
| particip | 0.994*** | 0.206*** | 0.414*** | 0.367*** | 1.072*** | 0.370*** |
| (0.262) | (0.055) | (0.032) | (0.035) | (0.109) | (0.037) | |
| registrar | −0.065* | −0.013* | −0.020*** | −0.018*** | −0.093*** | −0.032*** |
| (0.037) | (0.008) | (0.007) | (0.006) | (0.031) | (0.011) | |
| ethnic | −0.111 | −0.023 | −0.276*** | −0.244*** | −0.979*** | −0.338*** |
| (0.360) | (0.083) | (0.043) | (0.058) | (0.205) | (0.069) | |
| rural | 0.837*** | 0.174*** | 0.177*** | 0.157*** | 0.487*** | 0.168*** |
| (0.181) | (0.039) | (0.025) | (0.030) | (0.143) | (0.049) | |
| ballot | 0.128*** | 0.115*** | 0.351*** | 0.123*** | ||
| (0.005) | (0.004) | (0.011) | (0.004) | |||
| Year dummies | Yes | No | No | |||
| Regional dummies | Yes | Yes | Yes | |||
| Time-averaged regressors | No | No | Yes | |||
| Observations | 1360 | 1360 | 1360 | |||
| Groups | 272 | 272 | ||||
| Scale factor | 0.208 | 0.885 | 0.345 | |||
| Left-censored obs. | 0 | |||||
| Right-censored obs. | 29 | |||||
| Wald test:χ2statistic | 1862.9 | 1627.0 | 1603.1 | |||
| LR test of σc2:χ2statistic | 712.6 | |||||
Note: Standard errors (SE) for coefficients and APEs are reported in parentheses. In the case of the latter, SE were computed from 1000 bootstrap replications.
In particular, the estimates revealed the following facts concerning the decision of voter registration among Chilean youth: first, the income effect (lnincome) was negative and significant at the one percent level when the panel data approach was employed (columns 3–6, Table 2). This finding differs from previous results reported in Chilean literature on youth vote (Corvalán & Cox, 2013; Toro, 2007) which used cross-section data from a survey. One of the disadvantages of using individual-level data is that it tends to under-estimate the rural population and over-estimate the voter turnout (Kimberlee, 2002). In addition, this finding adds new elements to the discussion about the repercussion of class bias on voter registration and electoral engagement, an issue where the evidence has been diverse (Avery & Peffley, 2005; Cavanagh, 1981; Leighley & Nagler, 1992).
Second, the largest partial effect belonged to civic participation rate whose positive effect suggests a predominant role of social capital in electoral engagement among the Chilean youth population (columns 1–6, Table 2). This is in line with preceding evidence from Toro (2007), who found a direct relationship between being part of political, social, or ecological groups and the likelihood of voter enrollment.
Third, and contrary to what had been expected, the estimates were unsuccessful in proving that a greater number of voter registrar's offices increases the enrollment probability among youth. During the sample period, the Chilean Electoral Service had enabled 56 new public facilities devoted to voter registration, 35 of them in rural counties; nevertheless, the estimated effect was negative (columns 1–6, Table 2). An argument that could explain this result is that, although the amount of local election offices has increased since 2000, the closing date for registration has not been eliminated.15 This certainly goes against scholar consensus that registration mechanisms should be uncomplicated and exempt from inconveniences for citizens in order to increase voter turnout (Stone, 1985; Highton, 1997, 2004). As suggested by Navia (2004) and Contreras and Navia (2013), this legal constraint has acted as a barrier to voter participation, producing a negative effect on the voter enrollment rate during the last decade.
Regarding control variables, county-level data encompassed in the current study permitted an examination of the heterogeneity of extreme zones and enclaves more distant from urban centers. Indeed, rurality had positively influenced the voter registration among Chilean youth, with the coefficient being individually significant at the one percent level under the three econometric approaches (columns 1–6, Table 2).
The evidence from panel-data regressions suggested that ethnicity's effect on youth vote was negative and significant at the 1% level (columns 3–6, Table 2). This result may confirm the presence of a certain disaffection among indigenous people for being involved in the Chilean democratic system. Similar findings have been reported by Silberman and Durden (1975) for Afro-American populations in the United States and Aleksynska (2011) for immigrant populations in Europe who come from developing countries.
The dummy variable ballot explained about twelve percentage points of the voter enrollment rate, which roughly amounts to 1200 new young voters per county (columns 2–3 and 5–6, Table 2). This suggests that a new election remains a source of motivation for voter registration and turnout among the Chilean youth population.
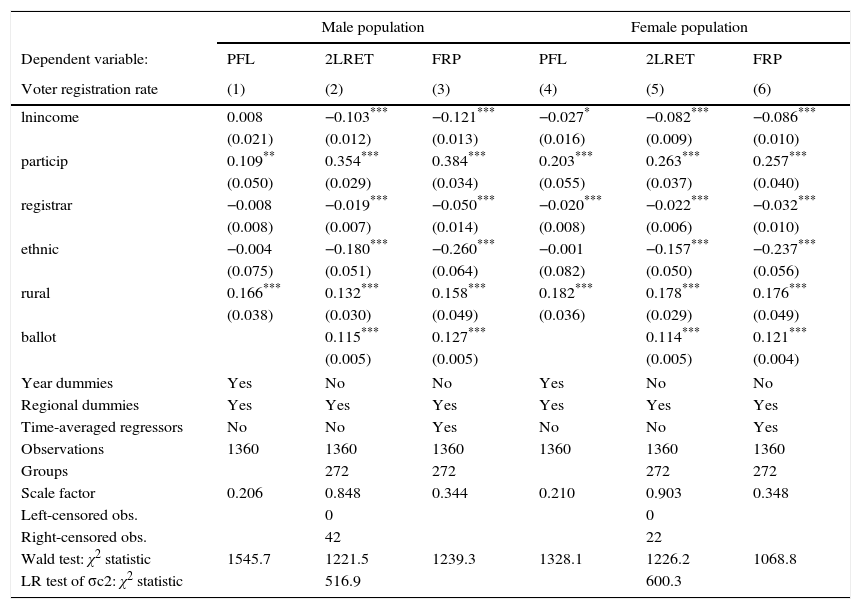
As stated in the introduction, this manuscript explores the differences in voter registration among Chilean youth considering gender and geographical groups. In connection with the point above, Table 3 reports the estimated APEs for male and female population. In general, the results for the female population were quite similar to those shown in Table 2; that is, the parameters were significant at the 1% level for most regressors, except the ethnicity effect in the PFL model (columns 1 and 4, Table 3).
Average partial effects (APE) of the pooled fractional logit (PFL), two-limit random effects Tobit (2LRET), and fractional response probit (FRP) models for youth vote ratio, male and female population.
| Male population | Female population | |||||
|---|---|---|---|---|---|---|
| Dependent variable: | PFL | 2LRET | FRP | PFL | 2LRET | FRP |
| Voter registration rate | (1) | (2) | (3) | (4) | (5) | (6) |
| lnincome | 0.008 | −0.103*** | −0.121*** | −0.027* | −0.082*** | −0.086*** |
| (0.021) | (0.012) | (0.013) | (0.016) | (0.009) | (0.010) | |
| particip | 0.109** | 0.354*** | 0.384*** | 0.203*** | 0.263*** | 0.257*** |
| (0.050) | (0.029) | (0.034) | (0.055) | (0.037) | (0.040) | |
| registrar | −0.008 | −0.019*** | −0.050*** | −0.020*** | −0.022*** | −0.032*** |
| (0.008) | (0.007) | (0.014) | (0.008) | (0.006) | (0.010) | |
| ethnic | −0.004 | −0.180*** | −0.260*** | −0.001 | −0.157*** | −0.237*** |
| (0.075) | (0.051) | (0.064) | (0.082) | (0.050) | (0.056) | |
| rural | 0.166*** | 0.132*** | 0.158*** | 0.182*** | 0.178*** | 0.176*** |
| (0.038) | (0.030) | (0.049) | (0.036) | (0.029) | (0.049) | |
| ballot | 0.115*** | 0.127*** | 0.114*** | 0.121*** | ||
| (0.005) | (0.005) | (0.005) | (0.004) | |||
| Year dummies | Yes | No | No | Yes | No | No |
| Regional dummies | Yes | Yes | Yes | Yes | Yes | Yes |
| Time-averaged regressors | No | No | Yes | No | No | Yes |
| Observations | 1360 | 1360 | 1360 | 1360 | 1360 | 1360 |
| Groups | 272 | 272 | 272 | 272 | ||
| Scale factor | 0.206 | 0.848 | 0.344 | 0.210 | 0.903 | 0.348 |
| Left-censored obs. | 0 | 0 | ||||
| Right-censored obs. | 42 | 22 | ||||
| Wald test: χ2 statistic | 1545.7 | 1221.5 | 1239.3 | 1328.1 | 1226.2 | 1068.8 |
| LR test of σc2: χ2 statistic | 516.9 | 600.3 | ||||
Note: Standard errors in parentheses were computed from 1000 bootstrap replications.
Moreover, the income, election office, and ethnicity effects were not significant in the PFL model for the male electorate (column 1, Table 3). In particular, real income and registrar office effects remained negative, while the impact of civic participation and rurality stayed positive and significant at the 1% level in both electorates. No convincing evidence was found for the ethnicity effect on youth vote when the pooled logit regression was run (columns 1 and 4, Table 3).
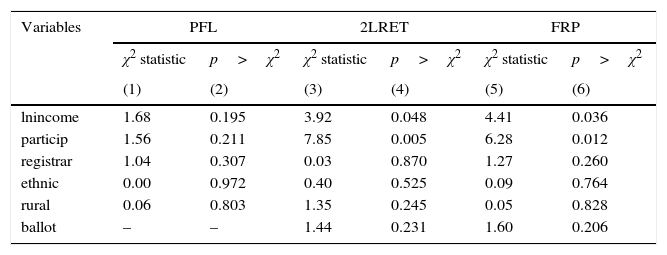
In addition, a chi-square test of difference between groups was used in order to test whether the estimated coefficients differed among male and female population. The corresponding null hypothesis can be stated as H0:βˆimale=βˆifemale. Most of these differences were not statistically significant at the 5% level; nonetheless, the impact of civic participation on voter registration was statistically greater at the 5% level for the male electorate (see Appendix, Table A1). This result confirms the need for a gender policy that promotes the generation of social capital among Chilean youth.
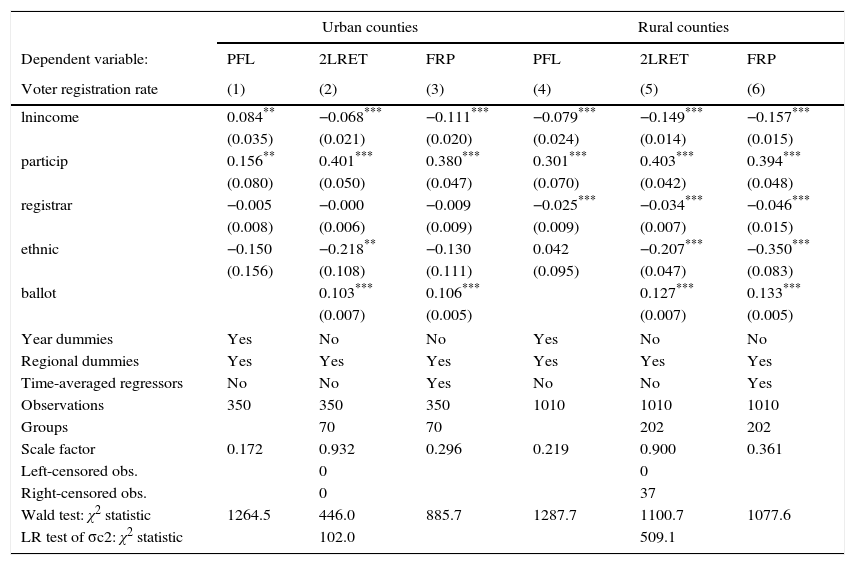
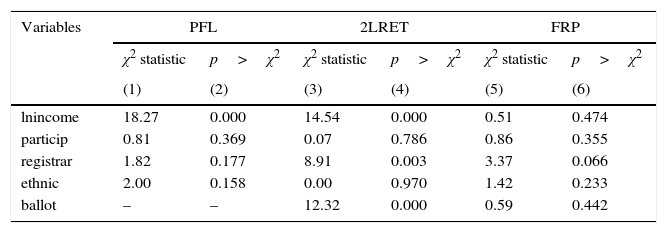
Regarding geographical differences, Table 4 reports the estimated APEs for urban and rural counties, while Table A2 summarizes the chi-square test of difference across both groups. From these tables, five aspects can be highlighted: first, the evidence confirmed the negative influence of real income on voter registration among Chilean youth, which was larger for rural counties. Second, the APE associated with civic participation remained positive but higher than previous findings reported in Tables 2 and 3. Third, no significant correlation was found between the number of election offices and the registration rate in urban counties. Fourth, the effect of an impending election (i.e., dummy variable ballot) kept close to twelve percent, significant at the one percent level, and was lower for the urban electorate. And fifth, there was a significant negative correlation between the rate of ethnic population and the enrollment rate in rural counties. This suggests that political disaffection is an increasing phenomenon among the indigenous population that resides in suburban areas.
Average partial effects (APE) of the pooled fractional logit (PFL), two-limit random effects Tobit (2LRET), and fractional response probit (FRP) models for youth vote ratio, urban and rural counties.
| Urban counties | Rural counties | |||||
|---|---|---|---|---|---|---|
| Dependent variable: | PFL | 2LRET | FRP | PFL | 2LRET | FRP |
| Voter registration rate | (1) | (2) | (3) | (4) | (5) | (6) |
| lnincome | 0.084** | −0.068*** | −0.111*** | −0.079*** | −0.149*** | −0.157*** |
| (0.035) | (0.021) | (0.020) | (0.024) | (0.014) | (0.015) | |
| particip | 0.156** | 0.401*** | 0.380*** | 0.301*** | 0.403*** | 0.394*** |
| (0.080) | (0.050) | (0.047) | (0.070) | (0.042) | (0.048) | |
| registrar | −0.005 | −0.000 | −0.009 | −0.025*** | −0.034*** | −0.046*** |
| (0.008) | (0.006) | (0.009) | (0.009) | (0.007) | (0.015) | |
| ethnic | −0.150 | −0.218** | −0.130 | 0.042 | −0.207*** | −0.350*** |
| (0.156) | (0.108) | (0.111) | (0.095) | (0.047) | (0.083) | |
| ballot | 0.103*** | 0.106*** | 0.127*** | 0.133*** | ||
| (0.007) | (0.005) | (0.007) | (0.005) | |||
| Year dummies | Yes | No | No | Yes | No | No |
| Regional dummies | Yes | Yes | Yes | Yes | Yes | Yes |
| Time-averaged regressors | No | No | Yes | No | No | Yes |
| Observations | 350 | 350 | 350 | 1010 | 1010 | 1010 |
| Groups | 70 | 70 | 202 | 202 | ||
| Scale factor | 0.172 | 0.932 | 0.296 | 0.219 | 0.900 | 0.361 |
| Left-censored obs. | 0 | 0 | ||||
| Right-censored obs. | 0 | 37 | ||||
| Wald test: χ2 statistic | 1264.5 | 446.0 | 885.7 | 1287.7 | 1100.7 | 1077.6 |
| LR test of σc2: χ2 statistic | 102.0 | 509.1 | ||||
Note: Standard errors in parentheses were computed from 1000 bootstrap replications.
*p<0.1.
**p<0.05.
***p<0.01.
Political disaffection among youth is a global concern that deserves the attention of the authorities, public, and scholarly community. Counter-intuitively, this pattern of citizen behavior is not exclusive to democratic countries that have adopted a voluntary voting system. In Latin America, Chile has recently moved from a mandatory to a voluntary voting rule. This policy was implemented despite the increasing lack of electoral participation among young people over the last decade. Nonetheless, few works have addressed the electoral apathy among Chilean youth, despite its negative consequences on the long-term sustainability of Chilean democracy.
This paper has re-examined the determinants of voter registration among Chilean youth and explored the existence of gender and geographical differences in this behavior. The evidence from the fractional-response and random-effects Tobit regressions reveals that real income, civic engagement, rurality, and an impending election determine the voter enrollment among Chilean youth. Based on the theoretical framework's implications, these variables could be valid determinants of turnout rates among youth if the model assumes automatic registration, mimicking the Chilean voting rule in force. This seems plausible due to the high correlation between voter registration and turnout rates (Erikson, 1981; Highton, 1997, 2004; Wolfinger, Highton, & Mullin, 2005).
Moreover, the macro-level evidence confirms the existence of group differences (i.e., male and female, urban and rural) in terms of what determines their voter registration decision. In fact, this research provides additional support for the existence of political disaffection among indigenous youth that reside in rural counties, which has not been identified in previous research focused on Chile.
The results further suggest that the voter registration rate is higher among lower-income youth, which contradicts the micro-level findings reported by Toro (2007) and Corvalán and Cox (2013). Although these studies offered appealing remarks, they raise questions about the economic rationale behind the voter registration decision. It should be noted that the current electoral study addressed this issue, where the empirical strategy followed a theoretical model whose solution allowed for the derivation of an empirical specification from rational voting behavior. Controversial or not, these findings restart the discussion about the implications of a class-biased electorate in the Chilean democracy. The new evidence confirms that the young population with the highest endowment of human capital is becoming reluctant to participate in the Chilean political system. Therefore, the consequences could be even more harmful than those highlighted by Corvalán and Cox (2013) because the Chilean democracy is not making use of the positive externalities from citizens with higher schooling rates, such as an improved and more complex sorts of participation (Milligan, Moretti, & Oreopoulos, 2004). As a consequence, a less-educated electorate could be fertile ground for the emergence of a populist “caudillo” (warlord).
Gender differences reported for Chilean youth vote suggest that the female population would be less sensitive to a policy aimed at reinforcing social capital. This evidence has significant implications on the promotion of higher political interest or electoral engagement among the young population. Thus, policy makers should design a gender policy that encourages active participation in civic organizations. In this context, the challenge facing future governments is the ability to design policies that encourage the integration of young people into the political environment by breaking away from the current cultural paradigm of citizen participation, in order to strengthen the democratic tradition in Chile.
On the other hand, a fraction of Chilean youth seems to be highly motivated to participate in the democratic system and fulfill their civic duty, that is, by registering to vote and attending polling stations in every election. As a matter of fact, the evidence implies that youth turnout will be increased by about 400,000 people in a subsequent election under the voting rule in force. This figure is fairly close to the number of young voters that the Chilean electoral roll lost between 2000 and 2011, which constitutes a hopeful sign for democratic legitimacy in Chile.
Finally, the electoral study has a number of potential limitations that need to be considered. First, economic and social variables at the county-level are not available on a yearly basis, although voter-registration and electoral data can be collected annually from Chilean Electoral Service (SERVEL). Second, Chilean counties do not report auxiliary information that permits the incorporation of new control variables or an increase in the sample size. Despite this, the current work could be a starting point for future studies on youth vote in compulsory voting countries, such as Brazil, Argentina, or Australia. Certainly, this research will contribute to elucidate the above findings.
Conflict of interestsThe author declares no conflict of interests.
This work was carried out within the research-group project GI 160317/EF, Universidad del Bio-Bio, Chile. In addition, this research used data from the household survey of National Socioeconomic Characterization (CASEN); therefore, the author would like to thank the Ministry of Social Development of Chile, which is the copyright owner of the survey. Thanks are also due to Elizabeth Cabrera, Interim Head of the Chilean Electoral Service (SERVEL), and Juan E. Toledo, Regional Head of SERVEL Biobío. All results are the author's responsibility and do not compromise either the Ministry of Social Development or SERVEL.
This section describes the derivation of the empirical model from the social solution stated in Eq. (5). In particular, suppose for the sake of simplicity, that citizens are homogeneous and utility function is given by:

In addition, assume that the democracy function is given by:

The function stated by (A2) implies a bounded supply of democracy. That is, a full-enrollment equilibrium will bind the supply of democracy to n, while a crisis of representation will result in a public-good supply that tends to zero.
By substituting the partial derivatives of (A1) and (A2) into Eq. (5), it is trivial to verify that:
where li*, R*, and d* denote the optimal values for leisure, electoral roll, and democracy, respectively. After rearranging condition (A3), we have that: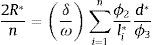
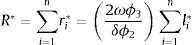
Dividing both sides of Eq. (A4) by population, n, then the optimal registration rate, ν*, can be expressed as:
where ν*=R*/n and κ*=(1/n)∑ili* are the optimal voter-registration and civic participation rates, respectively. The log-linearization of equation (A5) implies that:

Hence, an empirical specification for the voter-registration rate, ν, can be stated from Eq. (A6) as follows:
Tests of difference between male and female population.
| Variables | PFL | 2LRET | FRP | |||
|---|---|---|---|---|---|---|
| χ2 statistic | p>χ2 | χ2 statistic | p>χ2 | χ2 statistic | p>χ2 | |
| (1) | (2) | (3) | (4) | (5) | (6) | |
| lnincome | 1.68 | 0.195 | 3.92 | 0.048 | 4.41 | 0.036 |
| particip | 1.56 | 0.211 | 7.85 | 0.005 | 6.28 | 0.012 |
| registrar | 1.04 | 0.307 | 0.03 | 0.870 | 1.27 | 0.260 |
| ethnic | 0.00 | 0.972 | 0.40 | 0.525 | 0.09 | 0.764 |
| rural | 0.06 | 0.803 | 1.35 | 0.245 | 0.05 | 0.828 |
| ballot | – | – | 1.44 | 0.231 | 1.60 | 0.206 |
Tests of difference between urban and rural counties.
| Variables | PFL | 2LRET | FRP | |||
|---|---|---|---|---|---|---|
| χ2 statistic | p>χ2 | χ2 statistic | p>χ2 | χ2 statistic | p>χ2 | |
| (1) | (2) | (3) | (4) | (5) | (6) | |
| lnincome | 18.27 | 0.000 | 14.54 | 0.000 | 0.51 | 0.474 |
| particip | 0.81 | 0.369 | 0.07 | 0.786 | 0.86 | 0.355 |
| registrar | 1.82 | 0.177 | 8.91 | 0.003 | 3.37 | 0.066 |
| ethnic | 2.00 | 0.158 | 0.00 | 0.970 | 1.42 | 0.233 |
| ballot | – | – | 12.32 | 0.000 | 0.59 | 0.442 |
Highton and Wolfinger (1998) evaluated the effects of the NVRA on turnout and concluded that its impact depends on how politically motivated the target population was, despite costless voting.
Previously, Lichtman (1974) and Kramer (1983) stressed the issues behind ecological regressions. Lichtman (1974) pointed out that aggregated estimates exhibit a smaller specification error than micro-level regressions, while Kramer (1983) demonstrated that micro-level regressions failed in the attempt to explain the effect of the business cycle over voter turnout.
This survey was designed by the Ministry of Social Development (former Ministry of Planning), Institute of Youth, and United Nations Development Programme.
The model outlined by Acuña-Duarte (2017) tackles the private and social costs of voter registration and the potential detriment of being outside the electoral register.
See May (1978), Bollen and Grandjean (1981), Collier and Levitsky (1997), and Coppedge et al. (2011) for a detailed discussion about the concept of democracy.
Krasa and Polborn (2009) evaluated the effects of asymmetric voting costs and subsidies over turnout rate under a compulsory voting system.
The CASEN household survey has been applied since 1985 by the Ministry of Social Development, formerly the Ministry of Planning and known as MIDEPLAN, in order to retrieve information about the following modules: Residents, Education, Labor market, Income, Health, and Housing. In addition, it includes emergent topics such as wealth and ICT, disability, poverty programs, ethnicity, migration, autobiography, and civic participation.
Hualpen was created on March 13 and Alto Hospicio, Alto Biobio, and Cholchol on April 22.
This group was composed by Colchane, Camarones, General Lagos, Ollague, Zapallar, Papudo, Calle Larga, Santa Maria, La Cruz, Concon, El Tabo, Algarrobo, Santo Domingo, Codegua, Olivar, Malloa, Quinta de Tilcoco, Pichidegua, Peumo, Coltauco, Coinco, Doñihue, Las Cabras, Placilla, Lolol, Pumanque, Palmilla, Peralillo, Navidad, Litueche, La Estrella, Marchigue, Paredones, Mariquina, Los Lagos, Corral, Mafil, Paillaco, Puyehue, Rio Negro, Llanquihue, Puqueldon, Queilen, Quellon, Chaiten, Cochamo, Futaleufu, Hualaihue, Palena, Lago Verde, Cisnes, Guaitecas, Chile Chico, Rio Ibañez, Cochrane, O’Higgins, Tortel, Torres del Paine, Rio Verde, Laguna Blanca, San Gregorio, Primavera, Timaukel, Cabo de Hornos, Antartica, Providencia, Vitacura, and Lo Barnechea.
Brezzi, Dijkstra, and Ruiz (2011) proposed an alternative methodology that added two new categories: predominantly rural, close to a city and predominantly rural, remote.
Endersby and Krieckhaus (2008) discussed the consequences of using the electoral roll instead of voting age population in the computation of voter turnout.
These questions include the following civic participation options: neighborhood association, sports club, religious organization, art group, cultural-identity group, students’ association, women's organization, elderly group, voluntary association, self-help group, parent-teacher association, ideological and interest group, union, and political party.
See Ministerio de Planificación (2000, 2003, 2006, 2009) and Ministerio de Desarrollo Social (2011) for details.
See Wooldridge (2002, Ch. 16) for details.
Since its modification in 1989, article 22 from Act No. 18,556 of 1986 stated that an election office would be operative until 120 days before the election. This was modified in 2005 by Act No. 20,010, which shortened the closing date to 90 days.

www.publicationethics.org.
