


This study aims to determine the air quality of Sulfur Dioxide (SO2) and Nitrogen Dioxide (NO2) in settlements around the industrial area of Makassar.
MethodsThis research is an observational study with a descriptive approach. The population in this study was the ambient air quality in the settlements from four areas around the industrial area of Makassar.
ResultsThe results showed that ambient air quality parameters SO2 and NO2 at several locations in settlements around industrial area were in a good category based on the calculation results of air pollution standard index value (ISPU) which were in the range 0–50 which does not give effect to human or animal health and does not affect plants, buildings or aesthetic values. It is expected that government or related agencies should be preventing health impacts on communities.
Increasing industrial development activities have consequences, increasing waste that produced by the industry, including waste air which can change the ambient and indoor air quality.1 Regarding pollution, in general, air pollutants can be solids and gases. Pollution in the form of solids is dust, motor vehicle fumes and factories (industries), and waste decay processes. Pollution of chemicals in the form of gases, such as sulfur dioxide (SO2), nitrogen oxide (NOx) and carbon dioxide (CO2). One of the main pollutants from the industry is SO2.2
NO2 and SO2 are generally the two main air pollutants required by the government when assessing the impact of industrial facilities to obtain operating permits in industrial estates and when planning industrial expansion in future industrial estates.3 Sulfur dioxide is a species of sulfur oxide gases (SOx). This gas is very easily dissolved in water, has an odour but is colourless. Same with O3, secondary pollutants formed from SO2, such as sulphate particles, can be moved and deposited away from the source.4
Air that has a high NO2 content gives the impression of a red colour in the atmosphere of atmospheric air.5 NO2 and SO2 are generally the two main air pollutants required by the government when assessing the impact of industrial facilities to obtain operating permits in industrial estates and when planning industrial expansion in future industrial estates. Both pollutants are known to have adverse effects on human health, especially in the respiratory system.3 Data from the Makassar City Health Office shows that from 2012 to 2016, upper respiratory tract infections (ARI) reached the number 1 of the 10 highest diseases. The highest cases of ARI were in 2013 with 134,579 cases.6 This study aims to conduct research to obtain the quality of ambient air gas (SO2 and NO2) in settlements around industrial area of Makassar.
MethodsLocation and design of researchThis research was carried out in a residential area around the Makassar City industrial area consisting of 4 (four) sampling locations, namely Kapasa Baru, Kapasa Raya, Mula Baru, and Mattoanging. The type of research used is observational with a descriptive approach that aims to determine the ambient air quality parameters SO2 and NO2 based on the index value of air pollution standards (ISPU).
Population and sampleThe population in this study is the quality of ambient air in the settlements around the industrial area of Makassar City by purposive sampling.
Method of collecting dataData was carried out by instantaneous measurements of concentration of SO2 and NO2 in 4 (four) locations for 60min at 3 (three) different times, namely morning (09.00–10.00 WITA), daytime (13.00–14.00 WITA) and night days (20.00–21.00 WITA). The measurement of SO2 concentration was carried out using the pararosalinin method with a spectrophotometer that refers to SNI 7119.7.2017. The measurement of Nitrogen Dioxide (NO2) gas was carried out by referring to SNI 7119.2-2017 using the Griess Saltzman method with a Spectrophotometer.
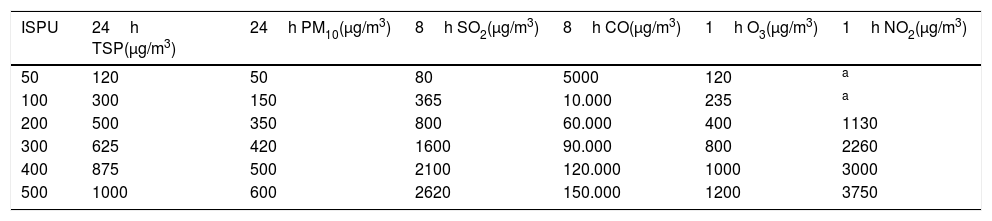
Data analysisThe obtained SO2 and NO2 concentration data were converted based on the exposure time in the ISPU limit according to KABAPEDAL No.107 1997 decision as in Table 1 using Microsoft Excel software. Conversion of SO2 and NO2 concentrations is calculated through the following formula approach12:

Limit of air pollution standard index based on KABAPEDAL No.107 1997.
C1=momentary air concentration (μg/m3);
C2=standard average air concentration (μg/m3);
t1=momentary exposure time (hour);
t2=standard exposure time (hour);
p=conversion factor with a value between 0.17 and 0.2 taken 0.17.
The next step is to calculate the ISPU value for the parameters SO2 and NO2 which are calculated through the formula approach as follows:

I=counted ISPU, Xa=ambient level upper limit (μg/m3).
Ia=upper limit ISPU, Xb=ambient level lower limit (μg/m3).
Ib=lower limit ISPU, Xx=the level of ambient measurement results (μg/m3).
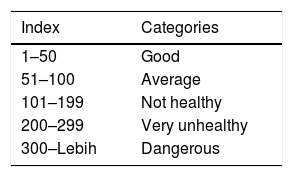
The ISPU calculation results are grouped and categorized based on the decision of KABAPEDAL No.107 of 1997 as shown in Table 2.
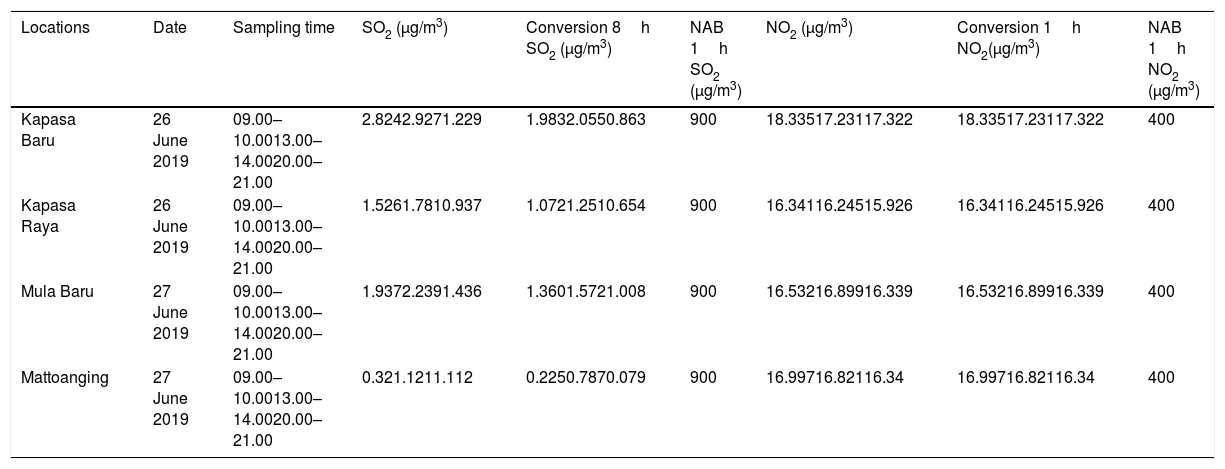
ResultConcentration of SO2The measurement results of SO2 concentration in settlements around the industrial area of Makassar City can be seen in Table 3. From the four measurement locations, the highest SO2 concentration occurred during the day. At the locations of Kapasa Baru, Kapasa Raya, Mula Baru, and Mattoanging, the concentration of SO2 during the day was 2.927μg/m3, 1.781μg/m3, 2.239μg/m3, 1.121μg/m3, respectively.
Results of measurement of concentrations of SO2 and NO2 at 4 (Four) locations in settlements around the industrial area of Makassar.
| Locations | Date | Sampling time | SO2 (μg/m3) | Conversion 8h SO2 (μg/m3) | NAB 1h SO2 (μg/m3) | NO2 (μg/m3) | Conversion 1h NO2(μg/m3) | NAB 1h NO2 (μg/m3) |
|---|---|---|---|---|---|---|---|---|
| Kapasa Baru | 26 June 2019 | 09.00–10.0013.00–14.0020.00–21.00 | 2.8242.9271.229 | 1.9832.0550.863 | 900 | 18.33517.23117.322 | 18.33517.23117.322 | 400 |
| Kapasa Raya | 26 June 2019 | 09.00–10.0013.00–14.0020.00–21.00 | 1.5261.7810.937 | 1.0721.2510.654 | 900 | 16.34116.24515.926 | 16.34116.24515.926 | 400 |
| Mula Baru | 27 June 2019 | 09.00–10.0013.00–14.0020.00–21.00 | 1.9372.2391.436 | 1.3601.5721.008 | 900 | 16.53216.89916.339 | 16.53216.89916.339 | 400 |
| Mattoanging | 27 June 2019 | 09.00–10.0013.00–14.0020.00–21.00 | 0.321.1211.112 | 0.2250.7870.079 | 900 | 16.99716.82116.34 | 16.99716.82116.34 | 400 |
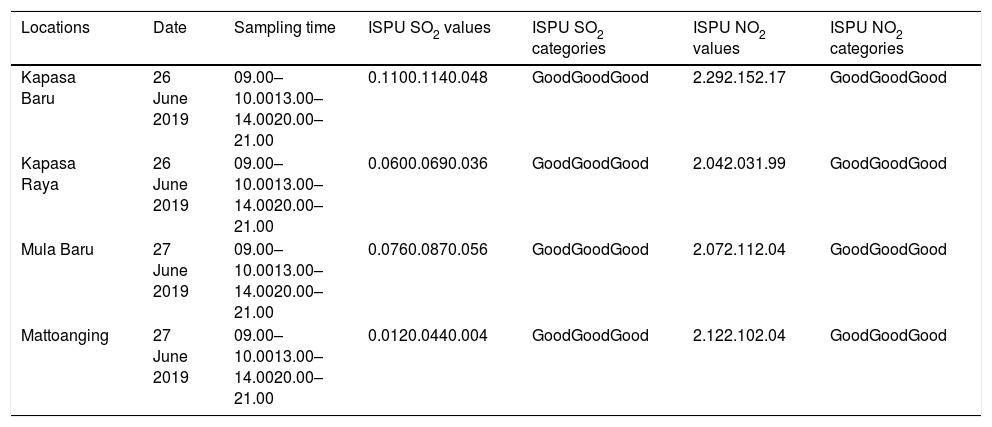
The results of the calculation of ISPU SO2 values for the locations of Kapasa Baru, Kapasa Raya, Mula Baru, and Mattoanging are 0.11; 0.06; 0.076; and 0.087 in the morning. The results of the calculation of the ISPU value for daytime are 0.114; 0.069; 0.056; 0.044. While for the night, the results of ISPU calculations are 0.048 each; 0.036; 0.012; 0.004. The results of the calculation of ISPU SO2 values as in Table 4 show that ISPU SO2 values at the locations are in the range 0–50.
Results of ISPU value calculation at 4 (Four) locations in settlements around Makassar Industrial area.
| Locations | Date | Sampling time | ISPU SO2 values | ISPU SO2 categories | ISPU NO2 values | ISPU NO2 categories |
|---|---|---|---|---|---|---|
| Kapasa Baru | 26 June 2019 | 09.00–10.0013.00–14.0020.00–21.00 | 0.1100.1140.048 | GoodGoodGood | 2.292.152.17 | GoodGoodGood |
| Kapasa Raya | 26 June 2019 | 09.00–10.0013.00–14.0020.00–21.00 | 0.0600.0690.036 | GoodGoodGood | 2.042.031.99 | GoodGoodGood |
| Mula Baru | 27 June 2019 | 09.00–10.0013.00–14.0020.00–21.00 | 0.0760.0870.056 | GoodGoodGood | 2.072.112.04 | GoodGoodGood |
| Mattoanging | 27 June 2019 | 09.00–10.0013.00–14.0020.00–21.00 | 0.0120.0440.004 | GoodGoodGood | 2.122.102.04 | GoodGoodGood |
The results of ISPU NO2 value calculation for Kapasa Baru, Kapasa Raya, Mula Baru, and Mattoanging locations are 2.29; 2.04; 2.07; and 2.12 in the morning. The results of the ISPU value calculation for daytime are 2.15; 2.03; 2.11; 2.10. While for the night, the ISPU calculation results are 2.17; 2.03; 2.04; 2.04. The results of the calculation of ISPU NO2 values as in Table 4 show the value of ISPU NO2 at the locations in the range 0–50.
DiscussionBased on result, it is known that the ambient air quality of SO2 and NO2 in 4 (four) locations around the industrial area of Makassar City is in the range 0–50 which means that ambient air quality is in the good category.
Sulfur Dioxide (SO2) is a colourless gas that creates a feeling if the concentration is 0.3ppm and causes strong odour at a concentration level above 0.5ppm. Nitrogen Oxide is a colourless and odourless gas, while Nitrogen Dioxide (NO2) has a brownish-red colour, and both are very important as pollutant gases that cause air pollution.7
The amount of concentration of SO2 and NO2 at the measured location point. The difference in the concentration of SO2 at each location for ambient air sampling is due to the distance taken with the chimney and the direction of the wind. Locations that have a high concentration value are close to the source of emissions and the wind direction is blowing towards a location that has a high concentration. On the other hand, locations that have low concentrations are far from the source of emissions and the wind direction does not blow towards that location.4
Research conducted by Turyanti showed that SO2 concentration is closely related to the source of emissions.5 At morning the concentration of SO2 at the surface is low, and along with the increase in motor vehicle activity, the concentration of SO2 increases. Similar research was carried out by Suryani which models pollution in the industrial area of PT. Semen Tonasa, shows that the distance between locations with chimneys shows different SO2 distribution patterns.8 The smaller the distance between the location and the chimney, the greater the pollutant, at wind speeds of 1.54m/s.
While in NO2, the extent of the location of the chimney indicates that the NO2 concentration range is not much different.9 The results of other studies in the northern region of Semarang City explained that the largest contribution of NO2 was generated by transportation sources, which was around 91.68%, industrial sector amounting to 8.31%, and the remainder was domestic sector which was around 0.01%.10
ISPU is a number that has a unit that describes the condition of ambient air quality at a given location and time based on the impact on humans, aesthetic values and other living things. Measurement and analysis of air pollution levels is carried out to determine the concentration of pollutants in the air and the level of ambient air quality at a specific location and time based on the impact on human health, aesthetic values and other living things.11
ISPU value of SO2 and NO2 of 4 (four) location points in settlements around the Makassar City industrial area is in the good category or in the range 0–50. The research conducted by Paerunan12 at Daya Makassar Terminal shows that the ISPU value SO2 and NO2 are in the range 0–50 is the level of air quality in a good category, which does not give effect to human or animal health and does not affect plants, buildings or aesthetic values.12
SO2 and NO2 contribute negative impact to human health. SO2 exposure has been associated with increased mortality and respiratory problems, increased risk of diagnosing asthma, exacerbating pre-existing respiratory disease and increasing prevalence of respiratory symptoms such as wheezing and shortness of breath.13–15 While exposure to NO2 is very dangerous for human health because it can cause respiratory disorders (decreased lung diffusion capacity), it can also damage plants. It also reduces visibility and resistance in the air.10
ConclusionThis study concluded that ambient air quality SO2 and NO2 at 4 (four) locations in settlements around the Makassar City industrial area are in the good category based on the results of the ISPU score calculation in the range 0–50. Suggestions for the Makassar City local government and company agencies in industrial estates to carry out routine measurements of ambient air quality, especially parameters of SO2 and NO2 in settlements around industrial estates, and to work on what needs to be done to reduce emissions produced by industrial activities, so as not to have a health impact on the surrounding community.
Conflict of interestThe authors declare no conflict of interest.
Peer-review under responsibility of the scientific committee of the 1st International Conference on Nutrition and Public Health (ICNPH 2019). Full-text and the content of it is under responsibility of authors of the article.
