


To describe the percentile distribution of waist circumference (WC) by sex and age in a representative sample of children and adolescents of lower-middle and low socioeconomic status in Santiago, Chile.
MethodsA cross-section of 3022 primary-school students between the ages of 6 and 14 from middle-low and low-class schools of Santiago. Ten schools from the Primary Education Society (SIP) in Santiago, Chile, were selected at random. WC was measured under standardized procedures as instructed by the WHO (midpoint between lower costal margin and iliac crest). The population was categorized between percentiles 10 and 90 and divided by sex and age.
ResultsWC tends to increase with age in both males and females, but no significant differences were found in the percentiles by age for boys and girls at any age range (p>0.05). In our sample, comparing Chilean children with other populations (British, Australian, European-American, African-American, Mexican – American and Colombian), Chilean children have shown a significantly greater WC (p<0.05).
ConclusionsWe present new WC reference values for Chilean children according to sex and age from a representative sample of Chilean population. These can be considered as a new anthropometric assessment tool for estimating cardiometabolic risk in Chilean children.
Describir la distribución percentilar de circunferencia de cintura (CC) según sexo y edad en una muestra representativa de niños y adolescentes de estrato socioeconómico medio-bajo y bajo de Santiago de Chile.
MétodosEstudio corte transversal de 3,022 estudiantes de educación básica, entre 6-14 años, de colegios de clase media-baja y baja de Santiago. Se seleccionaron 10 colegios pertenecientes a la Sociedad de Instrucción Primaria (SIP) de Santiago de Chile, en forma aleatoria. La CC se midió bajo procedimiento estandarizado según instructivo OMS (punto medio entre reborde costal inferior y cresta iliaca). La población fue categorizada entre los percentiles 10 al 90 y distribuidas según sexo y edad.
ResultadosLa CC tiende a aumentar con la edad en ambos sexos, sin diferencias significativas en los percentiles por edades de hombres y mujeres en ningún rango etáreo (p>0,05). Al comparar niños chilenos de esta muestra con otras poblaciones (Británicos, Australianos, Europeo-Americanos, Afro-Americanos, Mexicano-Americanos y Colombianos), se observa una CC significativamente mayor en nuestra muestra (p<0,05).
ConclusionesSe presentan nuevos valores de referencia de CC para niños chilenos de acuerdo a sexo y edad, a partir de una muestra representativa de la población chilena. Éstos podrán ser utilizados como nueva herramienta de evaluación antropométrica y de riesgo cardiometabólico en niños chilenos.
Overweight and obesity in children constitute a public health problem worldwide and have shown a steady increase in recent decades.1,2 Many children are affected by these conditions very early in life, with risks of suffering from them throughout their lives.3 A high body mass index (BMI) in childhood is related to obesity in adulthood, but this does not differentiate between lean mass and fat mass, does not account for the distribution of body fat, and is a poor predictor of cardiometabolic risk.4
Abdominal or central obesity, which is determined by measuring waist circumference (WC), has been related to cardiometabolic risk, in adults, when WC is greater than 88cm in women or 102cm in men.5 In children, the WC cut-off point is not an absolute number, since it changes with age. Because of this, the at-risk WC values used for children are those in the 90th percentile of the charts published for different populations, according to gender and age.6 These high WC values have been correlated with intermediate markers of cardiometabolic risk, such as high blood pressure7, dyslipidemia, insulin resistance,8,9 metabolic syndrome,10 left ventricular dysfunction,11 increases in carotid artery thickness,12 and increases in endothelial dysfunction markers (high-sensitivity CRP, PAI-1, TNF-alpha, among others).13 Likewise, increases in WC are associated with higher mortality rates in adults, regardless of their BMI.14 Recently, a higher WC has also been associated with obstructive pulmonary function in children.15WC is a better indicator of visceral fat than BMI when the latter is measured with nuclear magnetic resonance or computed axial tomography, taken at the level of the fourth lumbar vertebra.16 WC represents the intra-abdominal fat that is thought to be more metabolically active,9 and it helps predict cardiometabolic risk even in patients with a normal BMI (“metabolically obese individuals”). WC values are influenced by diet17 and exercise,18 so measuring it is recommended to monitor obese children's responses to these behavioral inputs.
WC values that determine abdominal obesity have been established in different countries, taking into account different races, which revealed significant differences among those considered.19 As far as we know, in Chile there are no recently tabulated data of WC in children. These data would be very useful in establishing the cut-off values that represent higher cardiometabolic risk. The objective of our study is to describe the percentile distribution of WC in a representative sample of children and adolescents from Santiago, Chile.
MethodsSubjectsA cross-sectional descriptive study was conducted with 1st to 8th grade students of the same ethnic and racial urban group, who were registered in the primary subsidized schools that belong to the Chilean Primary Instruction Society (SIP). These schools were selected under the criteria of being located in different communities, where people of the lower-middle class and working classes live, within the city of Santiago in the Metropolitan Region. Students who enter these schools do not have to comply with any restrictive requirements, meaning that any student can register in these schools freely. There are more than 15,000 primary education students under the SIP, distributed among 15 schools that are part of the lower-middle and working socioeconomic class sectors. Such socioeconomic classes represent 60% of the Chilean population.20 Our first step was a simple random selection of 10 of these schools that were distributed among 9 communes within Santiago (3 in the Northern area, 4 in the South and 3 in the Center). Later, we selected a representative sample of subjects from these schools using random, multi-stage, and cluster sampling. As a result, 3806 children were invited to participate in the study. Students from 1st to 8th grade studying at primary schools under the SIP were included in the study, upon informed consent of their parents. The students who were authorized by their parents but who refused to participate were excluded from the study. Also were excluded all those children with chronic diseases or comorbid conditions that would impair their nutritional status, such us diabetes mellitus and celiac disease.
The present study was conducted after being authorized by an ethics committee. The explanation given by those who refused to participate in the study was investigated by each student's teacher. The most common explanation was that they did not want others to see them nude. Thus, the nutritional status variable was probably not relevant for their refusal. The measurements were carried out between March 2006 and April 2007. On the day of the evaluation, 2.3% (n=87) of the children were absent and 18.3% (n=697) refused to participate or were excluded because they did not fulfill inclusion criteria. Finally, we were able to evaluate 3022 school children: 1576 girls (52.2%) and 1446 boys (47.8%).
Anthropometric measuresThe anthropometric evaluation was conducted by pediatricians who were previously trained by the authors on how to measure the subjects. For this purpose a procedures manual was also created. Additionally, the measurements were supervised in the field by the same authors, so as to minimize the differences between observers and ensure their accuracy and precision.
Height was measured using a wall-mounted Harpenden stadiometer (Holtain, UK). Weight was assessed by bioelectrical impedance (Tanita, Corporation of America, Arlington Heights). The WC measurements were taken while the children were standing, without shoes, feet together, and arms hanging down freely. The measuring tape was made of non-flexible material and was placed on their bare abdomens, horizontal to the floor, located midway between the lower costal margin and the iliac crest, after the patient had exhaled normally. Once in the correct position, the tape was adequately tensed so as to represent the waist surface. WC measurements were recorded to the tenth of a centimeter. Two measurements were obtained, and their average was used for the analysis.
Statistical analysisThe prevalence of obesity and overweight was calculated from the BMI percentile, according to the CDC (Centers for Diseases Control) reference. The percentile indicates the relative position of the child's BMI number among children of the same sex and age. It is considered as overweight when their BMI percentile is between 85th and 95th. It is considered as obesity when their BMI percentile is equal to or greater than the 95th percentile.
To analyze ontogenetic and sexual variability, prior normality tests were run through Shapiro–Wilk test. Waist circumference measure was transformed through natural logarithm, wich removes skewness. Smoothed percentiles for WC were constructed separately for boys and girls, by using Lean Mean Squares (LMS) method. Both, the male and female populations were categorized according to the 10th, 25th, 50th, 75th, and 90th percentiles, distributed by gender and age. The distribution centiles values were compared by the Kolmogorov–Smirnov test. We compared the logarithms average of centiles between boys and girls, through t-student test and its variability through variance ratio test.
Finally, the 50th percentile of WC between chilean boys and girls and other different populations was evaluated through Prais–Winsten regression (autoregressive first order).
The confidence intervals were stated at the 95% confidence level. Statistical significance was set at 5%. Homogeneity and chi-square testes were applied according to age and gender.
All statistical analyses were done with Stata software, version 10.1. Homogeneity and chi-square tests were applied according to age and gender.
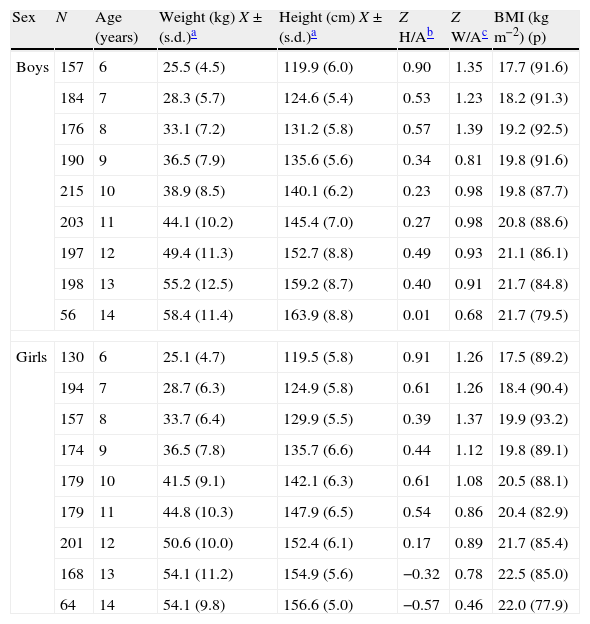
ResultsA total of 3022 children were measured and divided into percentiles according to their WC, gender, and age. Table 1 shows sampling sizes of the studied groups stratified by age and gender, and the mean and standard deviations for weight, height, BMI, height to age ratio, and weight to age ratio. The prevalence of obesity and overweight were 20.6% and 24%, respectively.
Mean and standard deviations (s.d.) for weight, height, BMI, height to age ratio, and weight to age ratio; by age and sex.
| Sex | N | Age (years) | Weight (kg) X±(s.d.)a | Height (cm) X±(s.d.)a | Z H/Ab | Z W/Ac | BMI (kgm−2) (p) |
| Boys | 157 | 6 | 25.5 (4.5) | 119.9 (6.0) | 0.90 | 1.35 | 17.7 (91.6) |
| 184 | 7 | 28.3 (5.7) | 124.6 (5.4) | 0.53 | 1.23 | 18.2 (91.3) | |
| 176 | 8 | 33.1 (7.2) | 131.2 (5.8) | 0.57 | 1.39 | 19.2 (92.5) | |
| 190 | 9 | 36.5 (7.9) | 135.6 (5.6) | 0.34 | 0.81 | 19.8 (91.6) | |
| 215 | 10 | 38.9 (8.5) | 140.1 (6.2) | 0.23 | 0.98 | 19.8 (87.7) | |
| 203 | 11 | 44.1 (10.2) | 145.4 (7.0) | 0.27 | 0.98 | 20.8 (88.6) | |
| 197 | 12 | 49.4 (11.3) | 152.7 (8.8) | 0.49 | 0.93 | 21.1 (86.1) | |
| 198 | 13 | 55.2 (12.5) | 159.2 (8.7) | 0.40 | 0.91 | 21.7 (84.8) | |
| 56 | 14 | 58.4 (11.4) | 163.9 (8.8) | 0.01 | 0.68 | 21.7 (79.5) | |
| Girls | 130 | 6 | 25.1 (4.7) | 119.5 (5.8) | 0.91 | 1.26 | 17.5 (89.2) |
| 194 | 7 | 28.7 (6.3) | 124.9 (5.8) | 0.61 | 1.26 | 18.4 (90.4) | |
| 157 | 8 | 33.7 (6.4) | 129.9 (5.5) | 0.39 | 1.37 | 19.9 (93.2) | |
| 174 | 9 | 36.5 (7.8) | 135.7 (6.6) | 0.44 | 1.12 | 19.8 (89.1) | |
| 179 | 10 | 41.5 (9.1) | 142.1 (6.3) | 0.61 | 1.08 | 20.5 (88.1) | |
| 179 | 11 | 44.8 (10.3) | 147.9 (6.5) | 0.54 | 0.86 | 20.4 (82.9) | |
| 201 | 12 | 50.6 (10.0) | 152.4 (6.1) | 0.17 | 0.89 | 21.7 (85.4) | |
| 168 | 13 | 54.1 (11.2) | 154.9 (5.6) | −0.32 | 0.78 | 22.5 (85.0) | |
| 64 | 14 | 54.1 (9.8) | 156.6 (5.0) | −0.57 | 0.46 | 22.0 (77.9) | |
BMI, body mass index; p, percentile.
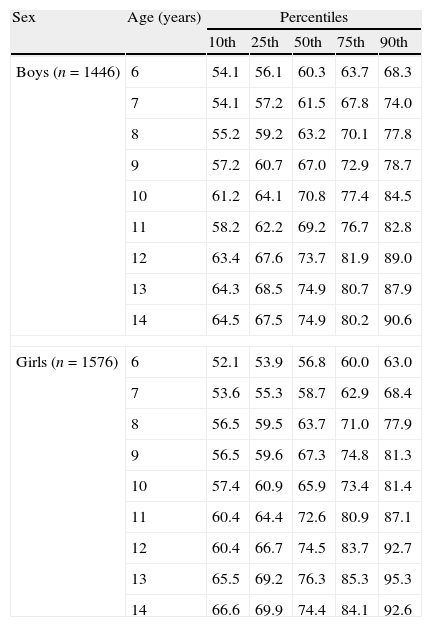
The percentile distributions of the WC values obtained from boys and girls according to age are shown in Table 2, and in Figs. 1 and 2, respectively.
Waist circumference (cms) according to percentiles for boys and girls between 6 and 14 years from Santiago, Chile, according to age.
| Sex | Age (years) | Percentiles | ||||
| 10th | 25th | 50th | 75th | 90th | ||
| Boys (n=1446) | 6 | 54.1 | 56.1 | 60.3 | 63.7 | 68.3 |
| 7 | 54.1 | 57.2 | 61.5 | 67.8 | 74.0 | |
| 8 | 55.2 | 59.2 | 63.2 | 70.1 | 77.8 | |
| 9 | 57.2 | 60.7 | 67.0 | 72.9 | 78.7 | |
| 10 | 61.2 | 64.1 | 70.8 | 77.4 | 84.5 | |
| 11 | 58.2 | 62.2 | 69.2 | 76.7 | 82.8 | |
| 12 | 63.4 | 67.6 | 73.7 | 81.9 | 89.0 | |
| 13 | 64.3 | 68.5 | 74.9 | 80.7 | 87.9 | |
| 14 | 64.5 | 67.5 | 74.9 | 80.2 | 90.6 | |
| Girls (n=1576) | 6 | 52.1 | 53.9 | 56.8 | 60.0 | 63.0 |
| 7 | 53.6 | 55.3 | 58.7 | 62.9 | 68.4 | |
| 8 | 56.5 | 59.5 | 63.7 | 71.0 | 77.9 | |
| 9 | 56.5 | 59.6 | 67.3 | 74.8 | 81.3 | |
| 10 | 57.4 | 60.9 | 65.9 | 73.4 | 81.4 | |
| 11 | 60.4 | 64.4 | 72.6 | 80.9 | 87.1 | |
| 12 | 60.4 | 66.7 | 74.5 | 83.7 | 92.7 | |
| 13 | 65.5 | 69.2 | 76.3 | 85.3 | 95.3 | |
| 14 | 66.6 | 69.9 | 74.4 | 84.1 | 92.6 | |
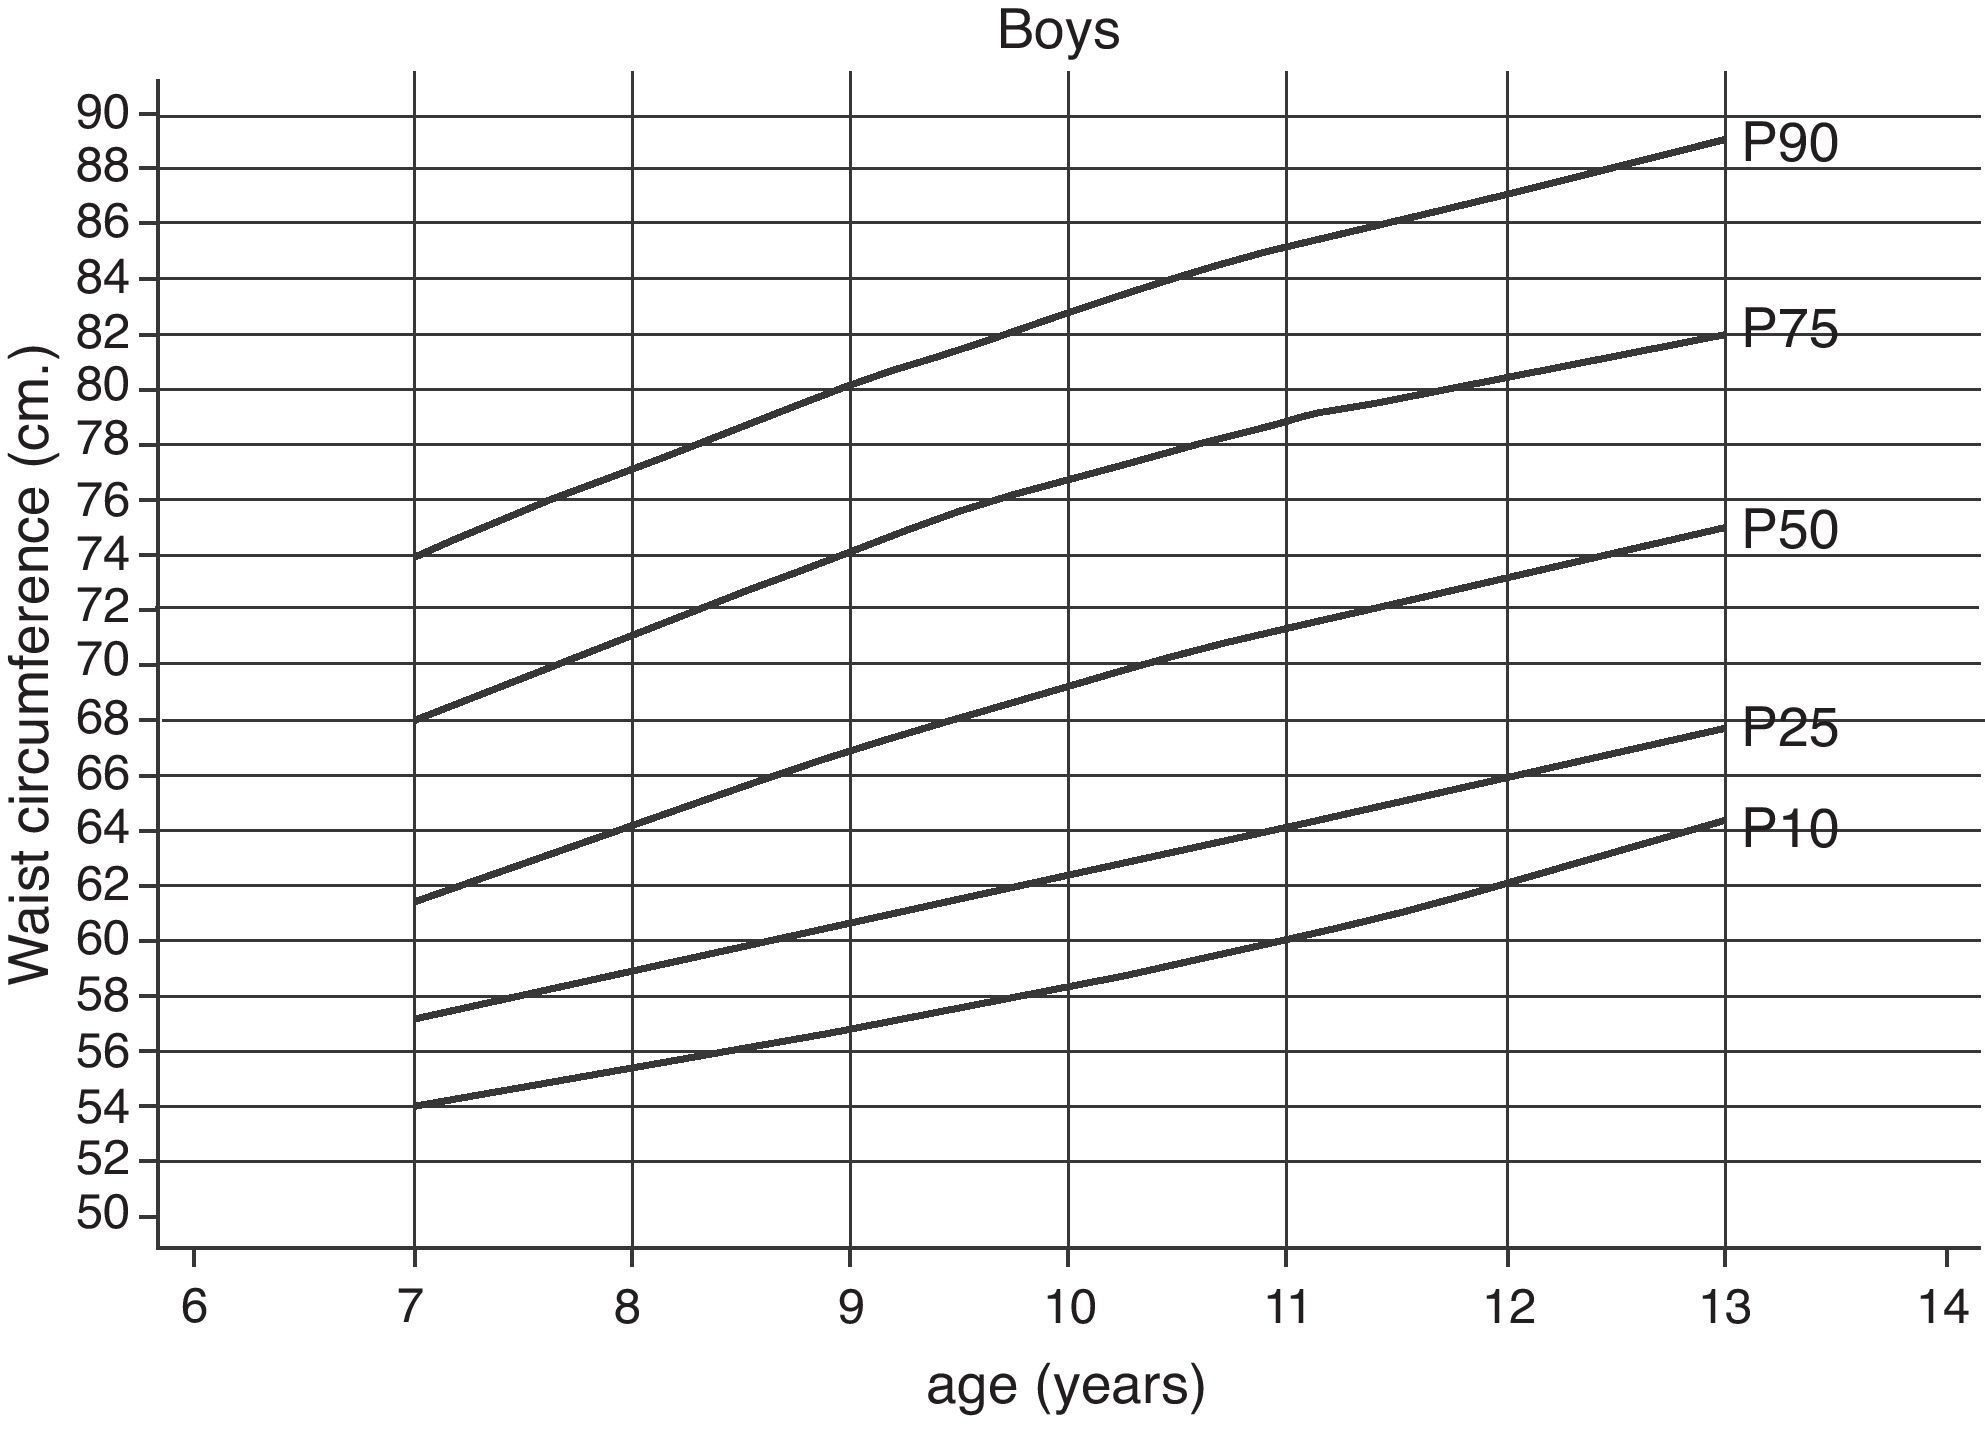
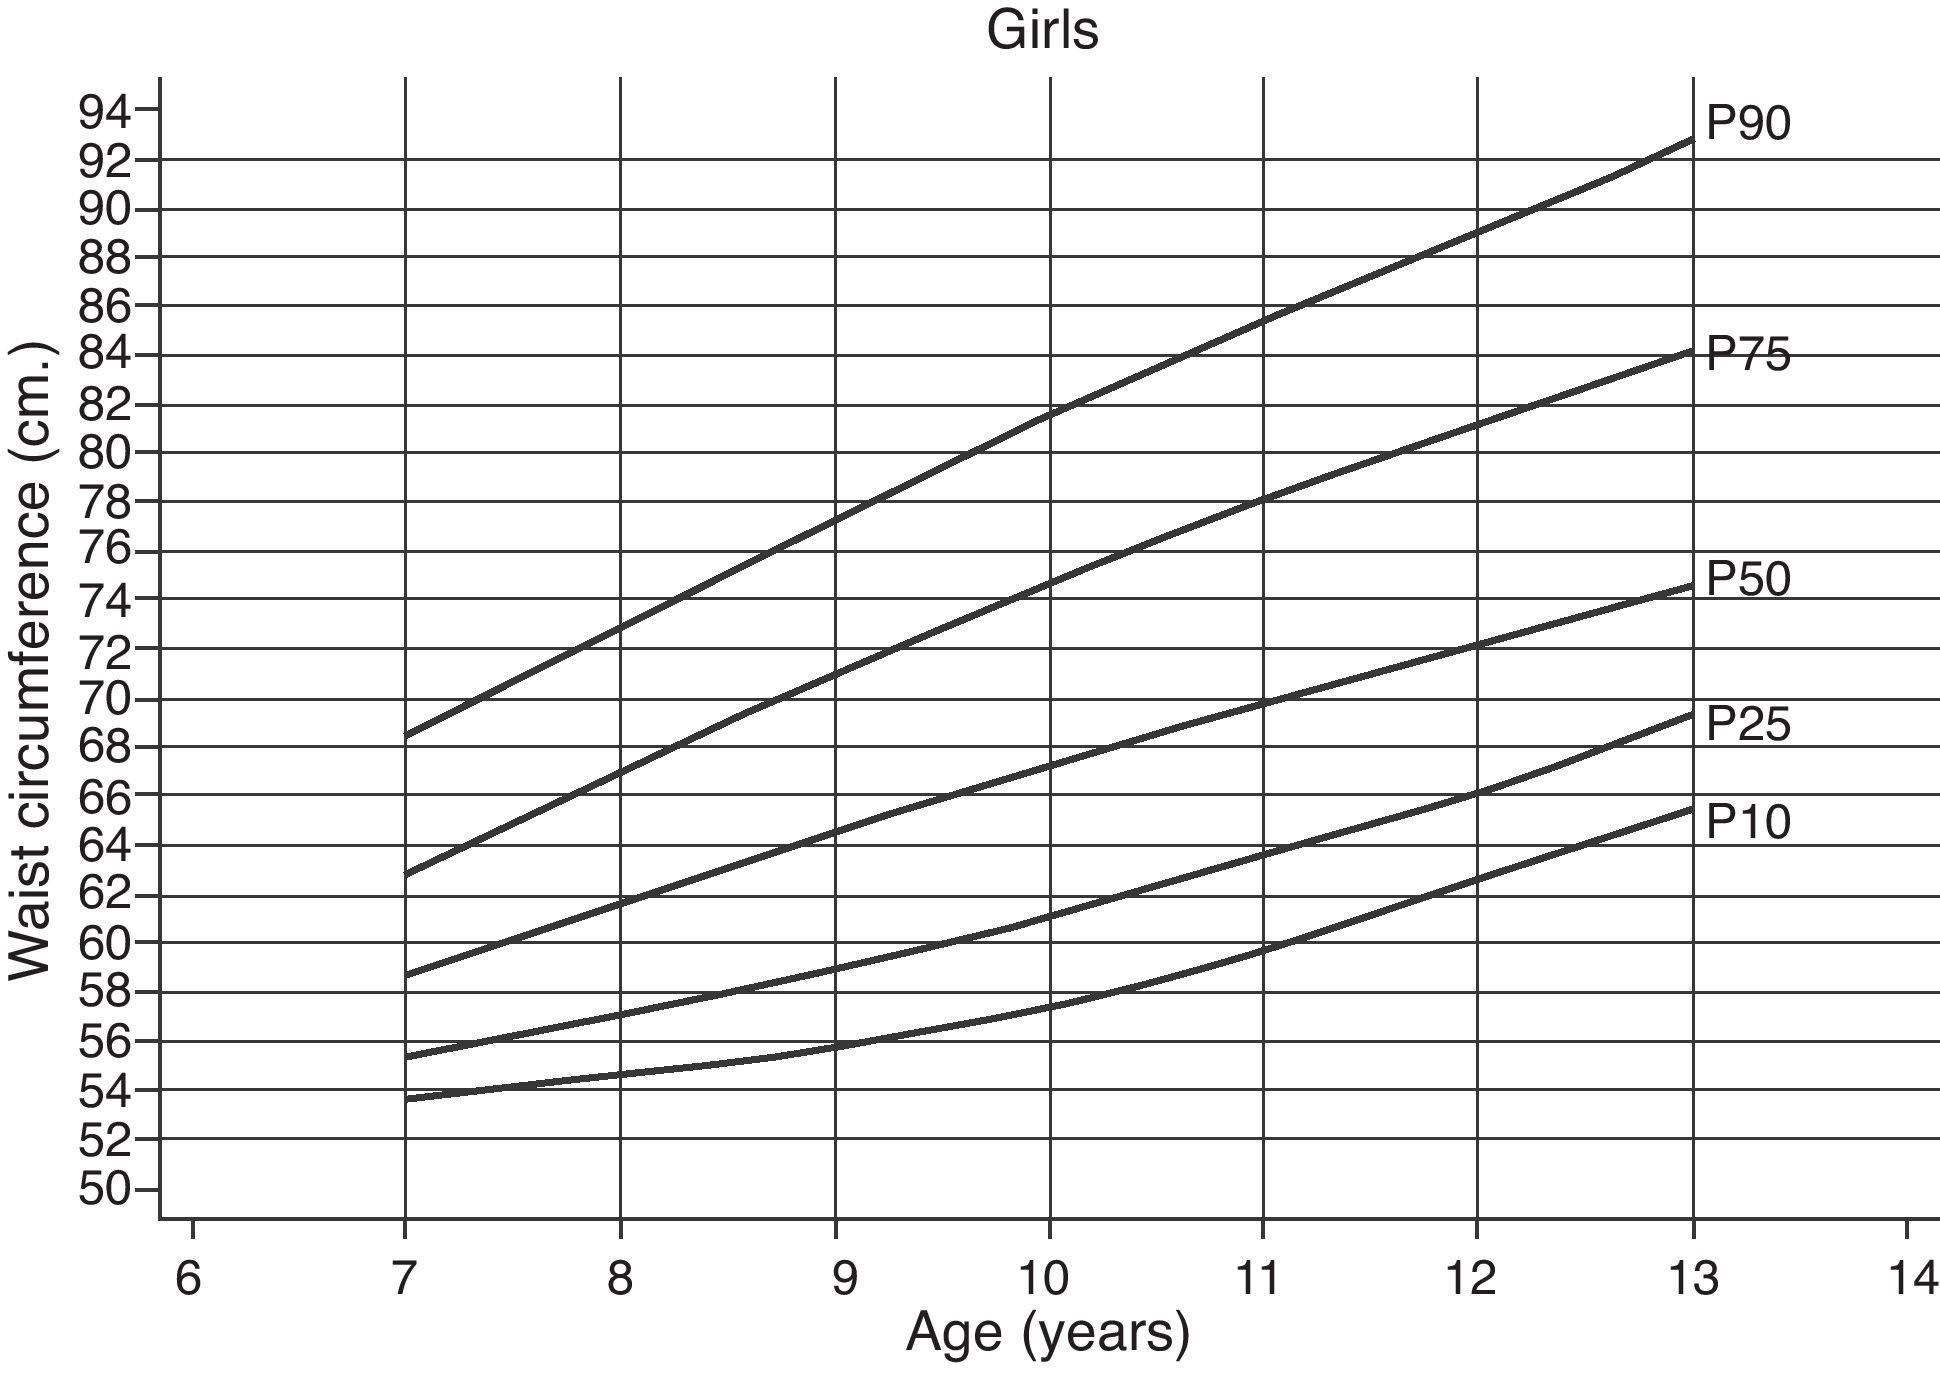
Overall, the same trend was observed for both male and female participants, i.e., the WC increased with age in both genders, as was expected. When comparing equivalent percentiles of boys and girls of the same age, it was discovered that their WC values were also similar. So, these differences were not enough to be statistically significant (p>0.05).
On the other hand, within the age groups studied, male participants increased their WC by 2.2cm per year, on average. However, females increased theirs by 2.6cm per year, which was significant (p<0.05).
The WC value that was established as a cardiometabolic risk predictor for adults, i.e., 88cm in female adults and 102cm in male adults, was reached in the 90th percentile of girls from 12 to 14 years of age. However, the 90th percentile of boys never reached the value of 102cm in any of the ages studied.
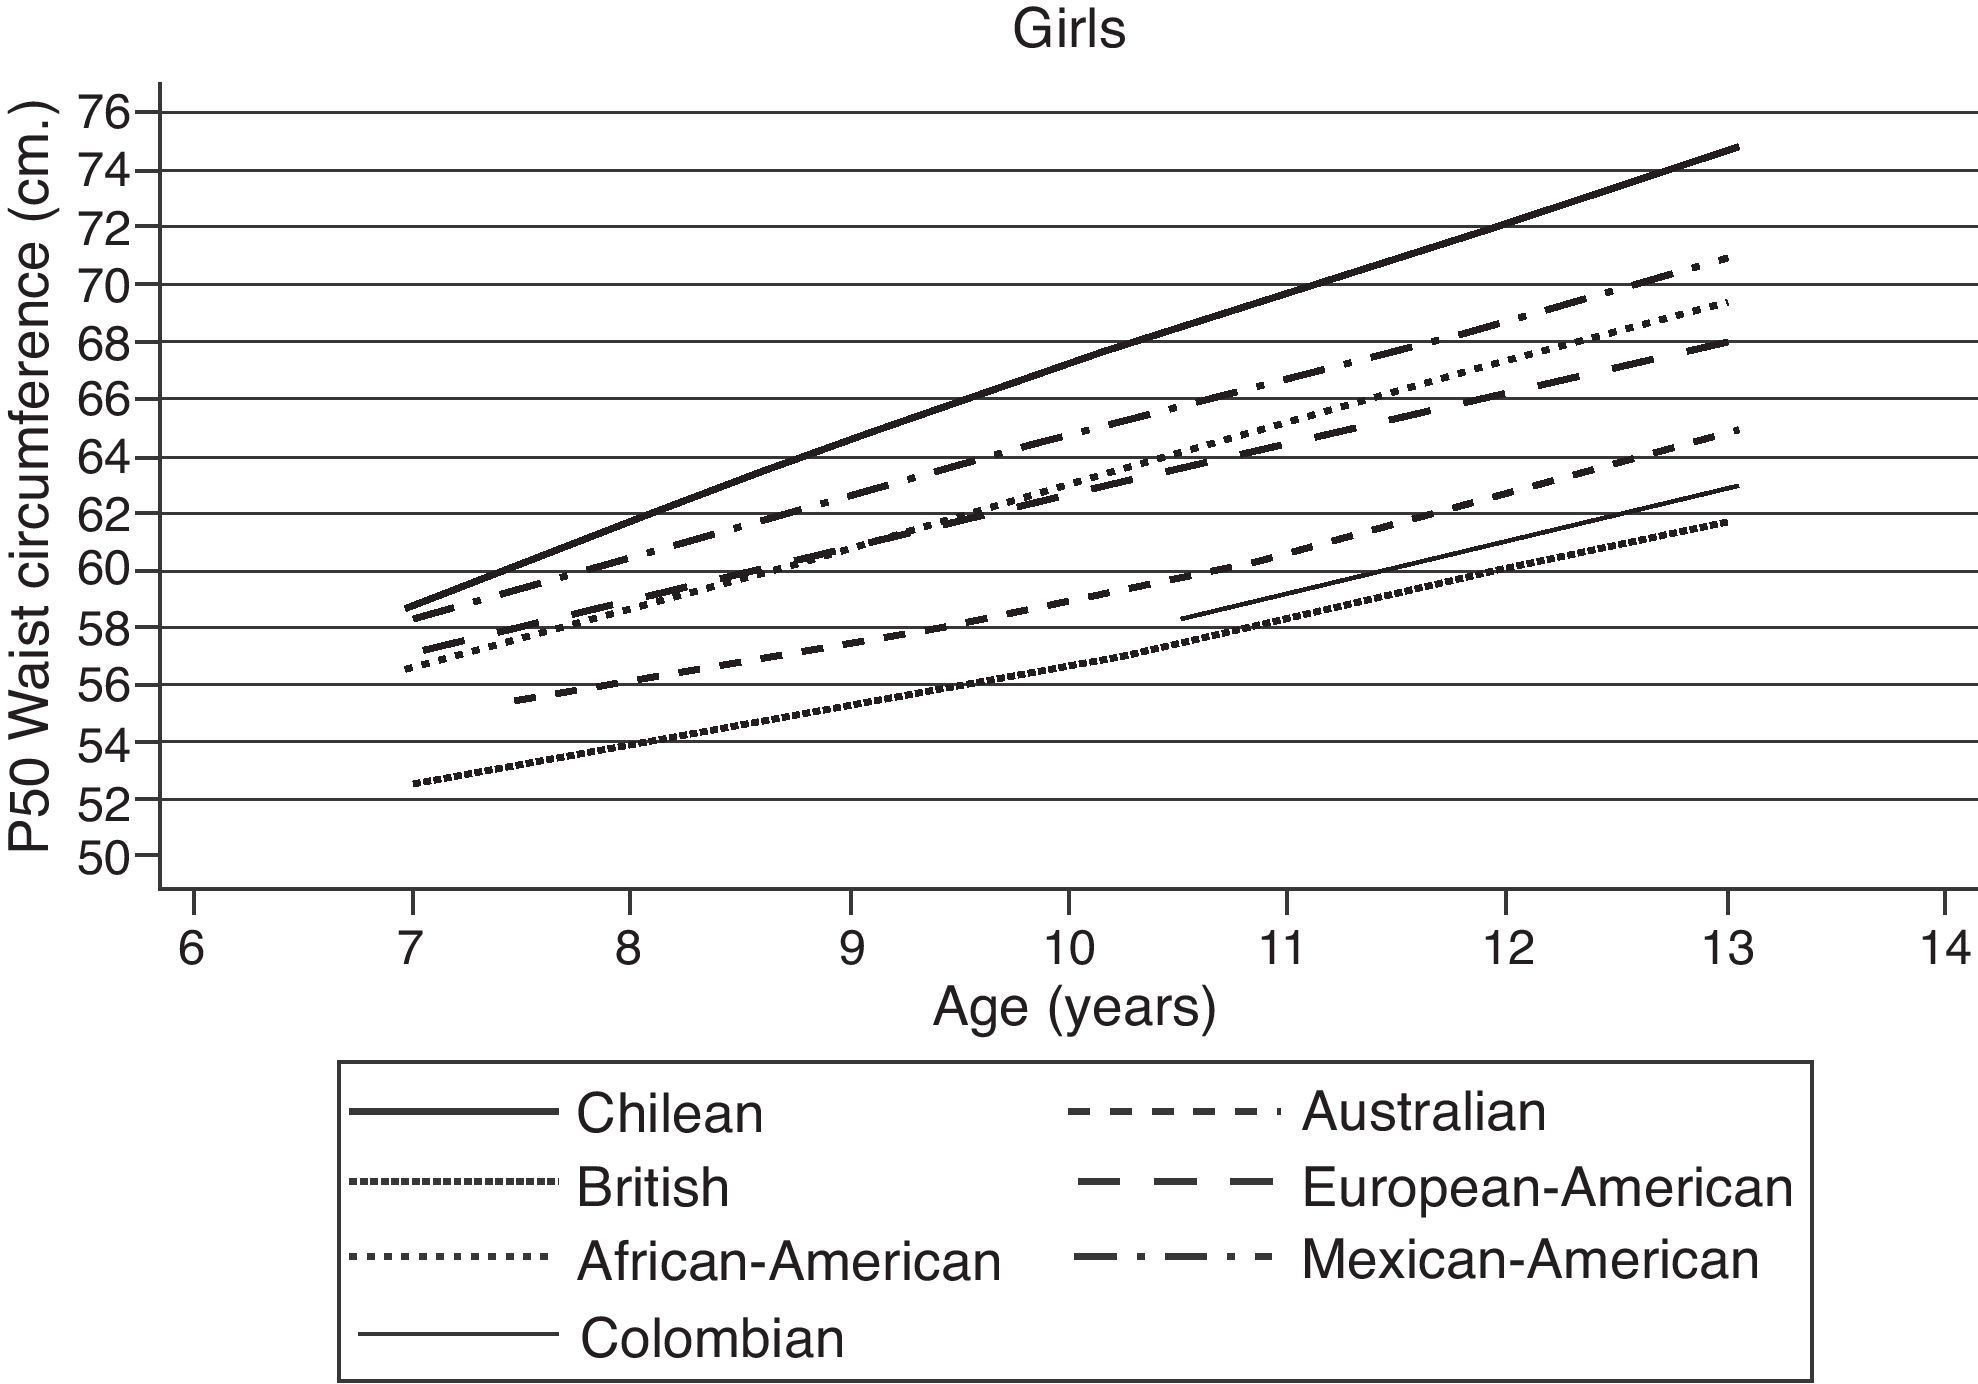
When comparing the WC of the Chilean children with the WC of children from other countries, we found that Chilean children had a larger WC than children from the USA (African-American, European-American, and Mexican-American),19 Australia,21 Great Britain,22 and Colombia.23
The reference sample of North American children was taken from the NHANES III survey, which is one of the most important surveys published to date. This survey is usually taken as reference because of the huge racial diversity in that country. Moreover, it establishes separate WC values for the different subgroups of European-American, African-American, and Mexican-American children.
The group with the most similar WC values to those of the Chilean boys and girls was the Mexican-American subgroup. However, Chilean children still had greater WC values than those of all three aforementioned American subgroups. Figs. 3 and 4 show the 50th WC percentile of Chilean boys and girls respectively, compared to Australian, British and Colombian children, as well as the three aforementioned American subpopulations. The differences between Chilean children and these other populations in all of the age groups reached statistical significance (p<0.05).
Discussion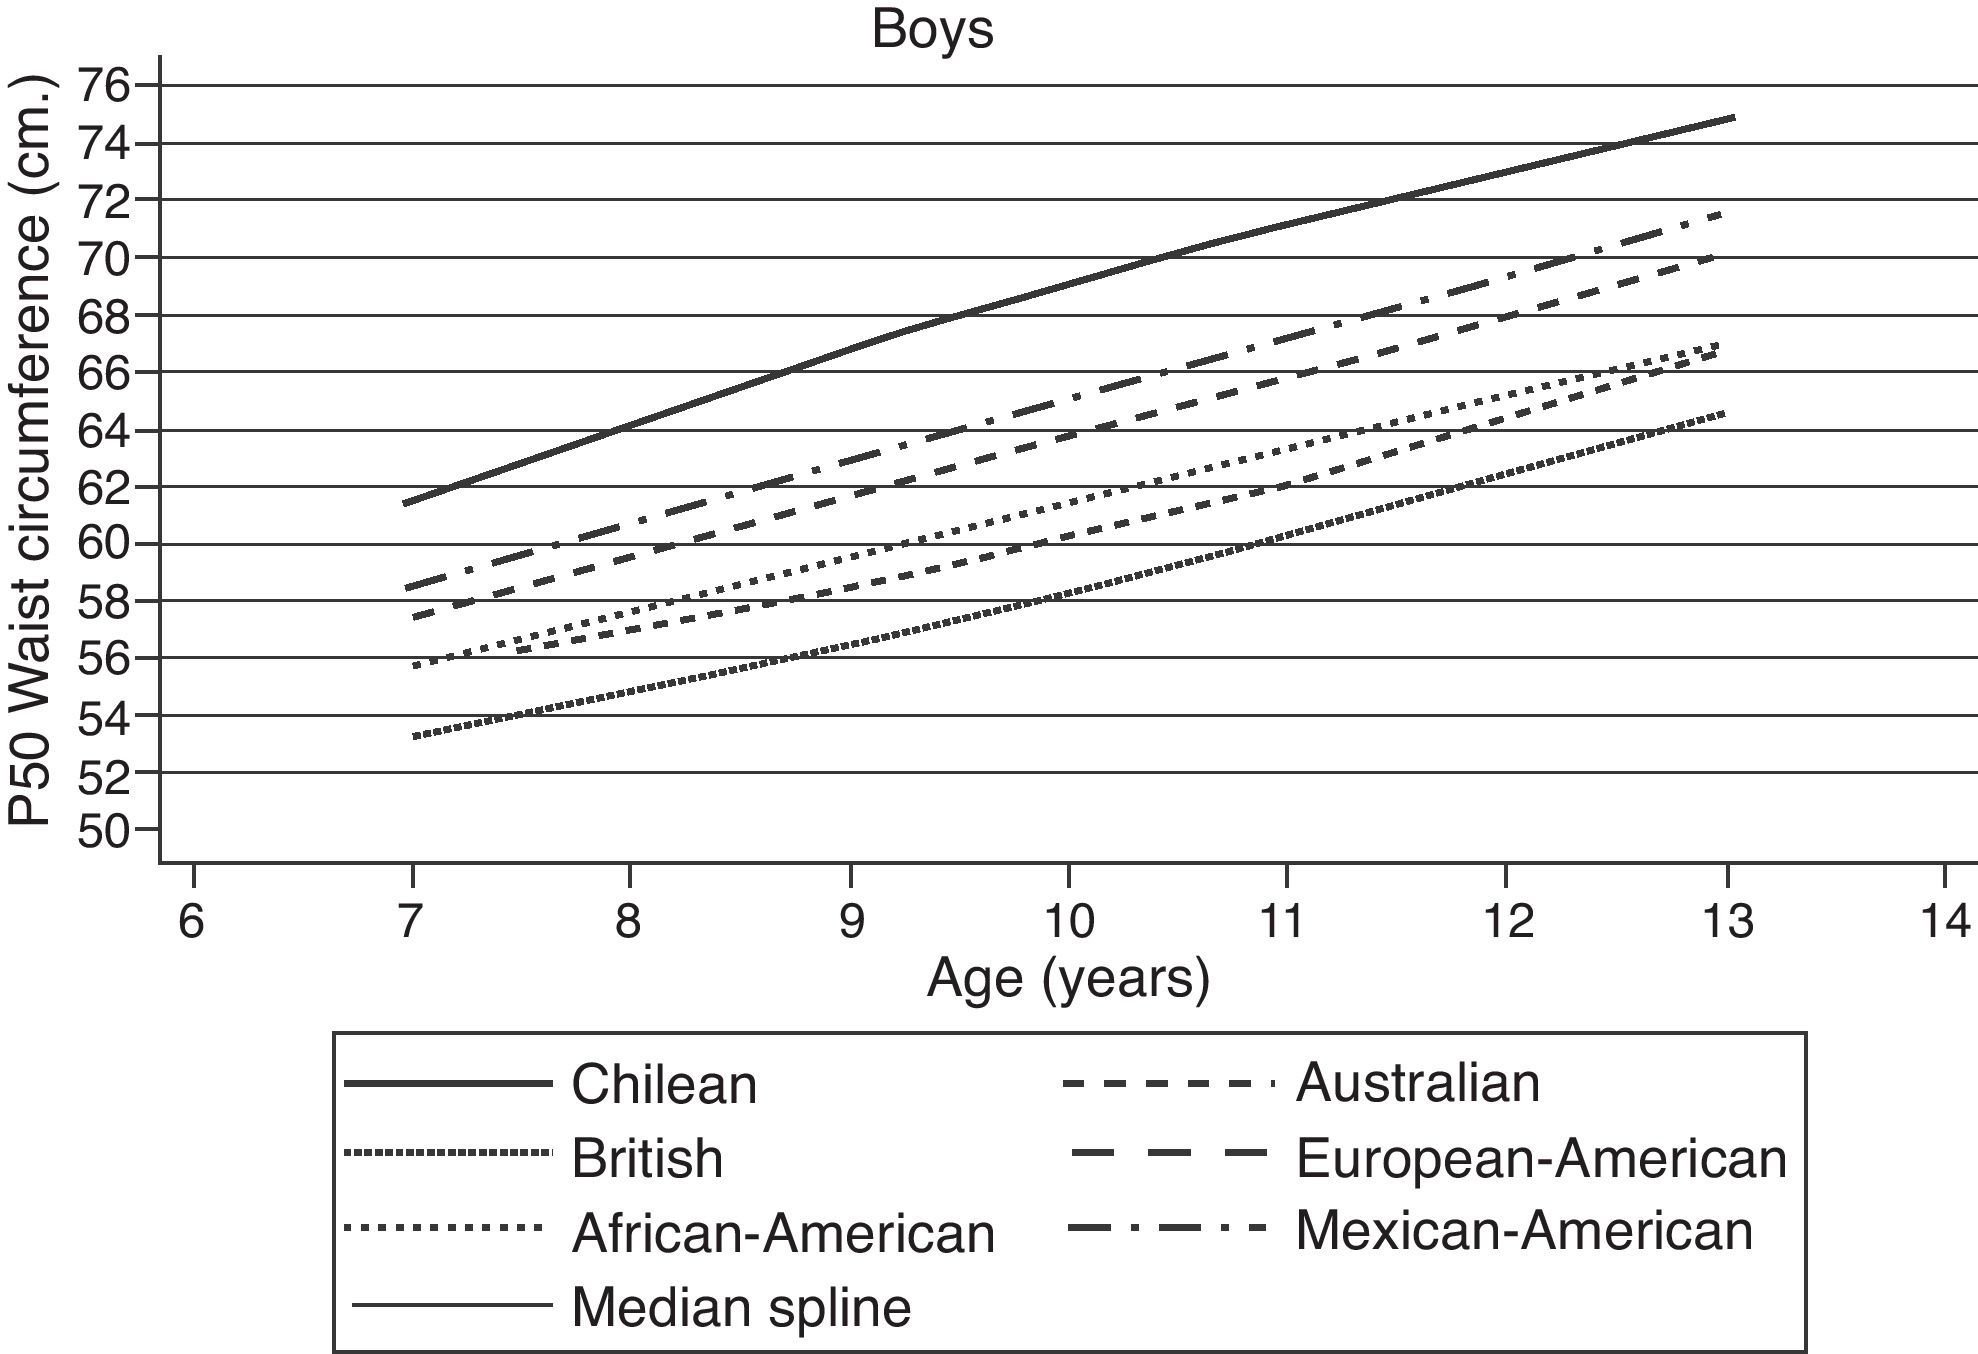
In the present study we describe WC distribution curves in percentiles of children and teenagers of both genders. The results were obtained from a representative sample of schoolchildren of the Chilean lower-middle and working classes who attended 10 different schools in Santiago, Chile. Some of the strengths of this study are its sampling design, the number of children examined, and how representative of Chilean children the sample was, because Metropolitan region has the largest number of people, its school age obesity prevalence is the same as in the rest of the country, and the evaluated socioeconomic class represents a large percentage of the country.20 Furthermore, the method used to obtain the measurements was highly effective, as it allowed the investigators to achieve reliable results, even when they were obtained by different observers.
Currently, there is no agreement regarding the anatomical location where WC should be measured. However, some studies conducted on adults show a high correlation between the WC values obtained from the highest point of the iliac crest, at the navel level, and those taken halfway between the lower costal margin and the iliac crest.24 In fact, the same study shows that both areas are similarly accurate in diagnosing cardiometabolic risk factors.
One of the present study's possible weaknesses could be the fact that the sample showed a high tendency towards obesity. However, this was an unavoidable factor in the study, given the nature of lower-middle and working-class life in Santiago. In the present sample, the tendencies towards obesity and overweight were 20.6% and a 24%, respectively. Despite the potentially confounding factor of malnutrition in our sample, these figures are very similar to data observed previously in the Mexican25 and Latin-American populations.26 Moreover, they agree with the data recorded by the Junta Nacional de Auxilio Escolar y Becas (Junaeb) (National Board of School Assistance and Scholarships),27 which represents most 1st-grade children from all of the municipal and subsidized schools in Chile.
The apparent weakness of our sample could be representative of the Chilean reality in terms of nutrition. On the other hand, it is not acceptable to exclude obese subjects of a specific group in order to obtain an “ideal” WC to compare with. Because of this, we intended to simply describe the sample in our study, which is very useful as a reference but should also be used cautiously, for the aforementioned reasons. These issues highlight the need to perform new national studies that will help define which WC percentile is most useful in diagnosing cardiometabolic risk factors. Thus, we should not only define “normality” based on the Gaussian distribution model, but we also should ideally define it in contrast to other studies that intend to identify the cut-off points that best distinguish cardiometabolic risk factors, even when these have not been universally defined and accepted yet.
The results presented here cannot be extrapolated to Chilean children from the upper-middle and upper socioeconomic classes or to the indigenous and rural populations, but it can certainly be a generalization for the rest of the Chilean population, which represents the majority of the country. We can say that our findings reflect the portions of Chilean society that are currently undergoing a post-nutritional transition process, where obesity has become the main nutritional problem for both children and adults. This is similar to what is happening in many developing countries that are also experiencing a nutritional transition process.
WC linearly increases as the subjects of both genders get older. This suggests that the waist circumference of human beings evolves in the same way as other anthropometric parameters, such as weight and height. When waist circumference reaches a value that indicates abdominal obesity, it might only be remedied with an intervention strong enough to modify the factors that have established such progression in the child. If we regard obesity in children as the result of the interaction between genetic and environmental factors, we could conclude that it is mainly caused by new behavioral factors in our country, since the genetic factors have been relatively constant in our population. Such behavioral factors would include an inappropriate diet, sedentary lifestyle, and the improvement of socioeconomic conditions.28
It was surprising to find that some girls between the ages of 12 and 14 in the Chilean population prematurely reached the WC, with its cut-off point that is regarded to be a predictor of cardiometabolic risk in female adults (88cm). This situation may even increase with age, a trend that was observed in our sample. The values for boys were very similar to those observed for girls. However, the male group never reached the cut-off point for cardiometabolic risk established for adults at any age, even beyond the 90th percentile. However, if we take into consideration that they enter puberty later than girls do, it seems logical to think that these children have not yet completed their pubertal development and therefore it is expected that their WC may increase still further in accordance with the progression of puberty.
When we compared the results of the sample of Chilean children to the data from other countries, we found that there were significant differences between Chilean children and American, Australian, British and Colombian children. These differences could be ascribed to race and the different degrees to which obesity has prevailed in these countries throughout the years. That is to say, the prevalence of obesity in each country as a whole would partly explain the differences observed in children. In this sense, differences between races do not make it possible to extrapolate WC values from one population to another. One other reason the Chilean data were significantly different from that of other populations is that the other data are 10 years old; obesity has increased a lot in the last decade, especially in children. However recent data from racially similar populations to Chile, like Aguilar de Plata et al.23 in Colombian children show that the waist (p. 50) of Chilean children is still significantly higher than the Colombian, which may be explained by the life styles, environmental factors and nutritional habits of children and Chilean population. This shows clearly the important public health problem that has turned childhood obesity in Chile, making it essential to design interventions that effectively prevent obesity.
In conclusion, the new WC percentile curves in children found herein were obtained using local data that reflect the reality of the lives of our child and adolescent populations and were of national interest or relevance. Because of this, our study is a potentially significant contribution to anthropometric measurements used in assessing cardiometabolic risk in children and teenagers, as they show visceral fat deposits, which are recognized as having the highest metabolic activity and relevance to obesity.
Disclosure statementThe authors have nothing to disclose.
Conflict of interestThe authors have no conflict of interest to declare.