

The body mass index (BMI) is based on the original concept that body weight increases as a function of height squared. As an indicator of obesity the modern BMI assumption postulates that adiposity also increases as a function of height in states of positive energy balance.
ObjectiveTo evaluate the BMI concept across different adiposity magnitudes, in both children and adults.
MethodsWe studied 975 individuals who underwent anthropometric evaluation: 474 children and 501 adults. Tetrapolar bioimpedance analysis was used to assess body fat and lean mass.
ResultsBMI significantly correlated with percentage of body fat (%BF; children: r=0.893; adults: r=0.878) and with total fat mass (children: r=0.967; adults: r=0.953). In children, body weight, fat mass, %BF and waist circumference progressively increased as a function of height squared. In adults body weight increased as a function of height squared, but %BF actually decreased with increasing height both in men (r=−0.406; p<0.001) and women (r=−0.413; p<0.001). Most of the BMI variance in adults was explained by a positive correlation of total lean mass with height squared (r2=0.709), and by a negative correlation of BMI with total fat mass (r=−0.193).
ConclusionsBody weight increases as a function of height squared. However, adiposity progressively increases as a function of height only in children. BMI is not an ideal indicator of obesity in adults since it is significantly influenced by the lean mass, even in obese individuals.
El índice de masa corporal (IMC) se basa en el concepto original de que el peso corporal aumenta en función de la talla al cuadrado. Como indicador de obesidad, el supuesto actual sobre el IMC es que la adiposidad corporal también aumenta en función de la talla en estados de balance energético positivo.
ObjetivoEvaluar el concepto del IMC en diferentes magnitudes de adiposidad, tanto en niños como adultos.
MétodosEstudiamos a 975 individuos sometidos a evaluación antropométrica: 474 niños y 501 adultos. Se usó bioimpedancia tetrapolar para evaluar la masa grasa y magra corporal.
ResultadosHabía una correlación significativa de IMC con el porcentaje de grasa corporal (%GC; niños: r=0,893, adultos: r=0,878) y con la masa grasa total (niños: r=0,967; adultos: r=0,953). En los niños, el peso corporal, la masa grasa, el %GC y el perímetro de la cintura aumentaban progresivamente en función de la talla al cuadrado. En los adultos, el peso corporal aumentaba en función de la talla al cuadrado, pero el %GC disminuía al aumentar la talla tanto en varones (r=−0,406; p<0,001) como en mujeres (r=−0,413; p<0,001). La mayor parte de la varianza del IMC en adultos se explicaba por una correlación positiva de la masa magra total con la talla al cuadrado (r2=0,709) y por una correlación negativa del IMC con la masa grasa total (r=−0,193).
ConclusionesEl peso corporal aumenta progresivamente en función de la talla al cuadrado. Sin embargo, sólo en los niños la grasa corporal aumenta progresivamente en función de la talla. El IMC no es un indicador ideal de obesidad en los adultos, ya que está significativamente influido por la masa magra, aún en los obesos.
As originally proposed by the Belgian statistician Lambert-Adolphe-Jacques Quételet (1796–1874) in 1832,1,2 virtually all studies on the topic have confirmed that the human body weight expressed in kilograms is proportional to the square of height expressed in meters.2–9 Since the 1960s it was apparent that the Quételet's index — named body mass index (BMI) in the 1970s by Keys et al.3,8 — is a predictor of acquired vascular and metabolic disease, as well as of general mortality10–14. However, Quételet did not aim to find an index of adiposity; instead, he was interested in describing the normal distribution of height and weight across different ages, following a concept proposed by him as “the average man”2,3: the central value around which the measurements of a human characteristic are grouped according to the normal probability curve.3
Obesity is pathophysiologically defined as excessive adiposity.15 Since the original descriptions of the Quételet index as a measure of the state of nutrition, plenty of evidence has accumulated on the value of a high BMI as a pragmatic indicator of obesity.4–14 However, only a few studies have analyzed the relationship of weight and body fat as a function of height in children and adults16–20 in order to test the assumptions loosely made by others on the Quételet's concept — that excessive adiposity increases in a linear way with respect to BMI, and that a high BMI always reflects excessive adipose mass.4–9 We aimed to study the association of weight and height as a measure of general adiposity in both children and adults.
MethodsA cross-sectional analysis was performed on two independent databases of anthropometric measures and body composition estimations by tetrapolar bioimpedance analysis (BIA) of adults and children. The present study was approved by the internal Ethics Committee of our institution, according with the Declaration of Helsinki. Informed consent was obtained from all participants or their parents. The convenience sampling method was used to collect information on both children and adults. A sample size of at least 273 patients per group (a total of 546 subjects) was estimated for detecting a correlation (Pearson's rho) magnitude≥0.150, with a type I error probability of 0.05 and power (1−β)=0.80.
Study populationThe evaluations of children were carried out in the urban population of Magdalena de Kino (Son., Mexico). This city in the North of Mexico pertains to a State with an estimated prevalence of overweight and obesity of about 35% in persons aged 3–17 years.21 Parents and teachers of children from 2 public elementary schools were invited to participate. A structured questionnaire was used to collect data from the parents regarding demography, relevant antecedents and current alimentary and exercise habits. The questionnaire was administered as an interview performed by trained personnel. Complete information on demographics and body composition was available for 474 children. For anthropometrics, children were measured in light sport wear after they had emptied their bladders. Height was measured to the nearest 0.5cm using a wall-mounted metric rule. Waist and hip circumferences (cm) were measured with an anthropometric tape. Waist circumference was measured at the minimum perimeter between the iliac crest and the rib cage, below the sternum. The hip measurement was taken at the maximum posterior protrusion of the buttocks, around the greater trochanter. BIA was used to assess weight and total body fat with a four-pole impedance meter at 800mAmp and 50kHz (BIA 310 Bioimpedance Analyzer, Biodynamics; Seattle, WA, USA) at least four hours after food ingestion, with evacuated bladder and rectum. Children were asked to stand barefoot and without metals on an insulating floor and electrodes were placed in the four limbs, as corresponded. Gender and height details were entered manually into the electronic system via a keyboard. Body weight and both total and percentage body fat (%BF) were estimated using the standard built-in prediction algorithms for children.
We also analyzed a total of 501 adults submitted to nutritional and anthropometric evaluation at the Department of Molecular Biology in Medicine, Hospital Civil de Guadalajara “Fray Antonio Alcalde” (Guadalajara, Jal., Mexico). These subjects were studied with a computerized multi-frequency tetrapolar 8-point tactile electrode BIA system (Inbody 720; analyzing software: Inbody 3.0; Biospace, Seoul, Korea) to determine their body composition (lean and fat mass content).22 They were asked to attend in the morning, with cotton underwear, overnight fasting and having evacuated their bladder and rectum. They were asked to remove their clothes, except underwear (if cotton-made, with no metal or synthetic textiles), and they were provided with a disposable gown for use during body composition analysis. Hands and soles were cleaned up and impregnated using disposable cloths soaked with electrolyte conductive solution. The subjects were asked to stand barefoot on the feet electrodes, and they grasped the upper limbs electrodes mounted on built-in handles. The measurement was performed in a dry and warm weather. Body weight recorded by the BIA analyzer was used for the statistical analysis; other anthropometric variables were estimated by direct measurement with stadiometer or flexible metric rulers following standard procedures. Body fat and lean content were estimated using the standard built-in prediction algorithms for adults.
Statistical analysisChi-square test was used to assess nominal variables in bivariate analysis. To compare quantitative variables, Student's t test was performed for parametric (i.e., normal) variables distributed in two groups, and one-way analysis of variance (ANOVA), for three or more groups. Pearson's rho was used to evaluate bivariate correlation between continuous distributions. The 95% confidence intervals (CI) for the correlation coefficients were also calculated. Partial correlations controlling for age and sex were performed to evaluate the independent association of BMI with total body fat and %BF. The determination coefficient was calculated as rho squared. Statistical analysis were regarded as significant when p<0.05. All p values reported are two-sided. SPSS v17.0 statistical package was used for all calculations.
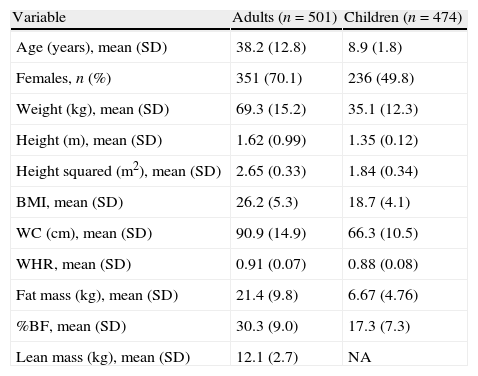
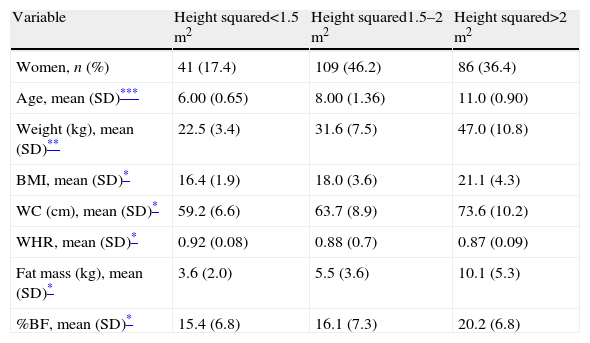
ResultsWe studied 975 healthy individuals: 501 adults (mean age 38 years, 70% women) and 474 children (mean age 9 years, 50% girls) (Table 1). For both children and adults all the anthropometric variables followed a normal distribution, except for waist circumference. In all, BMI correlated significantly with %BF (age- and sex-adjusted partial correlations in children: r=0.893, 95% CI: 0.874 to 0.909, r2=0.797; p<0.001; in adults: r=0.878, 95% CI: 0.857 to 0.896, r2=0.770; p<0.001) as well as with total fat mass (age- and sex-adjusted partial correlations in children: r=0.967, 95% CI: 0.961 to 0.972, r2=0.935; p<0.001; adults: r=0.953, 95% CI: 0.945 to 0.960, r2=0.908; p<0.001). However, body weight, fat mass, %BF and waist circumference progressively increased in children as a function of height squared (Table 2 and Fig. 1); while in adults %BF decreased progressively as a function of height squared, analyzed either as intervals (Table 3) or as a continuous variable (Fig. 2). This negative correlation between height squared and %BF was present both in men (r=−0.406; 95% CI: −0.531 to −0.253, p<0.001) and women (r=−0.413; 95% CI: −0.496 to −0.323, p<0.001) separately. On the other hand, total body weight increased progressively with higher height squared values in adults (Fig. 2 and Table 3).
Main characteristics of adults and children included in the study.
| Variable | Adults (n=501) | Children (n=474) |
| Age (years), mean (SD) | 38.2 (12.8) | 8.9 (1.8) |
| Females, n (%) | 351 (70.1) | 236 (49.8) |
| Weight (kg), mean (SD) | 69.3 (15.2) | 35.1 (12.3) |
| Height (m), mean (SD) | 1.62 (0.99) | 1.35 (0.12) |
| Height squared (m2), mean (SD) | 2.65 (0.33) | 1.84 (0.34) |
| BMI, mean (SD) | 26.2 (5.3) | 18.7 (4.1) |
| WC (cm), mean (SD) | 90.9 (14.9) | 66.3 (10.5) |
| WHR, mean (SD) | 0.91 (0.07) | 0.88 (0.08) |
| Fat mass (kg), mean (SD) | 21.4 (9.8) | 6.67 (4.76) |
| %BF, mean (SD) | 30.3 (9.0) | 17.3 (7.3) |
| Lean mass (kg), mean (SD) | 12.1 (2.7) | NA |
BMI: body mass index, NA: not assessed, SD: standard deviation, WC: waist circumference, WHR: waist-to-hip ratio and %BF: percentage of body fat.
Basic demographic and somatometric characteristics as a function of height squared in children (n=474).
| Variable | Height squared<1.5m2 | Height squared1.5–2m2 | Height squared>2m2 |
| Women, n (%) | 41 (17.4) | 109 (46.2) | 86 (36.4) |
| Age, mean (SD)*** | 6.00 (0.65) | 8.00 (1.36) | 11.0 (0.90) |
| Weight (kg), mean (SD)** | 22.5 (3.4) | 31.6 (7.5) | 47.0 (10.8) |
| BMI, mean (SD)* | 16.4 (1.9) | 18.0 (3.6) | 21.1 (4.3) |
| WC (cm), mean (SD)* | 59.2 (6.6) | 63.7 (8.9) | 73.6 (10.2) |
| WHR, mean (SD)* | 0.92 (0.08) | 0.88 (0.7) | 0.87 (0.09) |
| Fat mass (kg), mean (SD)* | 3.6 (2.0) | 5.5 (3.6) | 10.1 (5.3) |
| %BF, mean (SD)* | 15.4 (6.8) | 16.1 (7.3) | 20.2 (6.8) |
Chi-square test or one-way ANOVA, as corresponded.
BMI: body mass index, SD: standard deviation, WC: waist circumference, WHR: waist-to-hip ratio and %BF: percentage of body fat.
, and percentage of body fat with height squared (B) in children (n=474). Outlines represent the 95% confidence interval of the regression fit.")
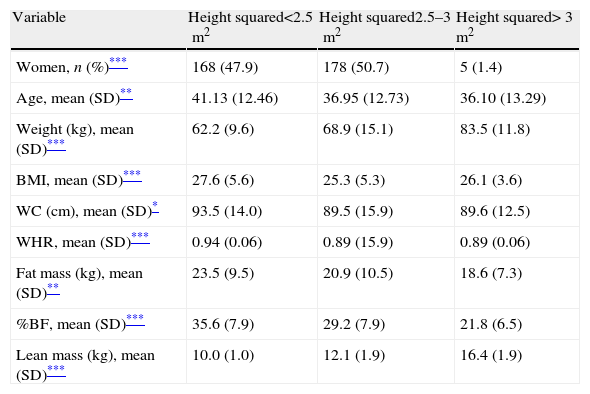
Basic demographic and somatometric characteristics as a function of height squared in adults (n=501).
| Variable | Height squared<2.5m2 | Height squared2.5–3m2 | Height squared>3m2 |
| Women, n (%)*** | 168 (47.9) | 178 (50.7) | 5 (1.4) |
| Age, mean (SD)** | 41.13 (12.46) | 36.95 (12.73) | 36.10 (13.29) |
| Weight (kg), mean (SD)*** | 62.2 (9.6) | 68.9 (15.1) | 83.5 (11.8) |
| BMI, mean (SD)*** | 27.6 (5.6) | 25.3 (5.3) | 26.1 (3.6) |
| WC (cm), mean (SD)* | 93.5 (14.0) | 89.5 (15.9) | 89.6 (12.5) |
| WHR, mean (SD)*** | 0.94 (0.06) | 0.89 (15.9) | 0.89 (0.06) |
| Fat mass (kg), mean (SD)** | 23.5 (9.5) | 20.9 (10.5) | 18.6 (7.3) |
| %BF, mean (SD)*** | 35.6 (7.9) | 29.2 (7.9) | 21.8 (6.5) |
| Lean mass (kg), mean (SD)*** | 10.0 (1.0) | 12.1 (1.9) | 16.4 (1.9) |
Chi-square test or one-way ANOVA, as corresponded.
BMI: body mass index, SD: standard deviation, WC: waist circumference, WHR: waist-to-hip ratio and %BF: percentage of body fat.
, and percentage of body fat with height squared (B) in adults (n=501). Outlines represent the 95% confidence interval of the regression fit.")
Most of the variance in BMI values observed in adults was explained by a positive correlation of lean mass with height squared (r=0.842, 95% CI: 0.815 to 0.865, r2=0.709; p<0.001), and a negative correlation of total fat mass (r=−0.193, 95% CI: −0.275 to −0.108; p<0.001) and %BF (r=−0.577, 95% CI: −0.632 to −0.516; p<0.001) with height squared. Mean total fat mass was higher in adults with BMI>30 than in those with lower BMI values (36.4kg vs 18.0kg, respectively; p<0.001). Nonetheless, mean total lean mass was also higher in adults with a BMI>30 (12.9kg vs 11.9kg, respectively; p=0.002) than in individuals with lower BMI.
DiscussionThis study confirms that, as postulated by Adolphe Quételet, weight increases as a function of height squared in children and adults. However, body fat does not necessarily increase as a function of height squared in adults; this fact challenges the concept of BMI as a pragmatic definition of obesity. Nonetheless, since mean body fat content is higher among individuals with a high BMI compared with lighter subjects, this index has been consistently found to be a predictor of vascular events and mortality at a population level (with a large number of observations).10–14 If we consider that BMI reflects both adipose and lean masses, the absolute risk imposed by obesity may be underestimated, concealed within the whole body mass composed by “beneficial” (lean mass) and “noxious” (fat mass) components.23,24 On the contrary, when BMI is analyzed as predictor of mortality in subjects who already have vascular disease (i.e., stroke, myocardial infarction and congestive heart failure, among other complications) it could be falsely concluded that obesity protects from death (i.e., the so-called “obesity paradox”),25–30 a deceiving concept that may be misinterpreted by the general public, with important consequences at the single patient level. It is possible that certain amount of lean and fat masses, but not necessarily obesity, are required to cope with energy demands that ensue after chronic atherothrombotic disease or organ failure. The obesity paradox has been described for myocardial infarction, stroke, heart failure and renal insufficiency, among other diseases.22,25–29
Several studies have challenged BMI as a reliable index of excessive adiposity, and as a consequence, as a pragmatic definition of obesity.18,19,24,29,30 Well-known anthropometric measures such as waist circumference, waist-to-hip ratio, waist-to-height ratio and other non classical parameters often perform better than BMI in predicting cardiovascular risk and mortality.22,28–31 Nevertheless, some risks can still be consistently attributed to a high BMI,10,11,32,33 because other somatometric measures (possibly excepting the waist-to-height ratio) do not take into account the brilliantly simple Quételet's concept that for a certain height corresponds a statistically normal mass.
The main limitations of this study are the relatively small sample size and the imprecise measurements of body fat and lean mass content obtained with BIA. The method used to measure waist circumference is not the conventionally accepted by the WHO; thus, although we do not expect this to significantly affect our results, they must be interpreted with caution. Hence, the present report should be considered as hypothesis generating, with the simple message that there is a need for better body composition measurements that can be used for a modern redefinition of obesity, one that can be easily and consistently applied both to large populations and at the single patient level.
In conclusion, total body weight and adiposity progressively increase as a function of height squared in children. On the other hand, total body weight in adults does increase as a function of height squared, but body adiposity does not. Especially for adults, we are in need of a modern index of adiposity.
Sources of fundingNo sources of funding are declared for this study.
Conflict of interestsAll authors report no competing conflicts of interest.