


To collect regional reference values of waist circumference (WC), and waist/hip ratio (WHR) in children and adolescents from Merida, Venezuela, and to compare them to international references.
Subjects and methodsA total of 919 students aged 9–17 years from public and private educational establishments were assessed. Weight, height, WC, and WHR were measured. Outliers (±3 SD Z-score) were excluded from the data collected. Percentile distribution of the tested variables was done by age and sex.
ResultsFifty-one percent of subjects were female, and 52.7% were from public institutions. WC (p=0.001) and WHR (p=0.0001) were statistically higher in boys. With advancing age, WC increased in both sexes, while WHR showed the opposite behavior (p=0.0001 for both). The 90th percentile (pc) for WC ranged from 69.7 and 83.6cm in girls and from 69.2 and 86.7cm in boys. The 90th pc values of WHR ranged from 0.79 and 0.91 in girls and from 0.86 and 0.93 in boys. Overall, our WC and WHR values were lower than North American values and similar to those of some Latin American references.
ConclusionPercentile reference charts for WC and WHR specific for age and sex, obtained from a representative sample of children and adolescents from Mérida, Venezuela, are provided. They may be used regionally, both for individual assessment and to implement prevention policies.
Obtener valores de referencia regionales de la circunferencia de la cintura (CC) e índice de la cintura/cadera (Ci/Ca) en escolares y adolescentes de la ciudad de Mérida (Venezuela) y comparar con referencias internacionales.
Materiales y métodosSe evaluaron 919 estudiantes de 9 a 18 años de unidades educativas públicas y privadas. Se tomaron medidas de peso, talla, CC y Ci/Ca. Los datos obtenidos fueron explorados excluyendo los valores atípicos (± 3 DE Z-Score). Se realizó la distribución por percentiles (pc) de las variables estudiadas según edad y sexo.
ResultadosEl 51% eran de sexo femenino y el 52,7% pertenecían a instituciones públicas. La CC (p=0,001) y el índice Ci/Ca (p=0,0001) fueron significativamente mayores en los niños. Con el avance de la edad la CC aumentó en ambos sexos. Comportamiento inverso tuvo la relación Ci/Ca (p=0,0001 para ambos). El pc90 para la CC osciló entre los 69,7 y los 83,6cm en las niñas y entre los 69,2 y los 86,7cm en los niños. Los valores de Ci/Ca del pc90 en las niñas estuvieron entre 0,79 y 0,91 y en los niños entre 0,86 y 0,93. En general, nuestros valores de la CC fueron más bajos que los norteamericanos y similares a algunos de Latinoamérica.
ConclusiónSe presentan tablas de referencia por pc específicas por edad y sexo para la CC y Ci/Ca en una muestra representativa de niños y adolescentes de la ciudad de Mérida (Venezuela) que pueden ser usadas regionalmente tanto para la evaluación individual como para la implementación de políticas preventivas.
The prevalence of childhood obesity has tripled since the 1970s and it is now considered to be one of the most serious public health challenges of the 21st century. According to the World Health Organization, the worldwide prevalence of overweight and obesity in children increased from 4.2% in 1990 to 6.7% in 2010. The rate is expected to reach 9.1% in 2020, which would represent a 36% increase as compared to 2010. Although the developed countries have approximately a two-fold greater prevalence of overweight and obesity than the developing countries (11.7% and 6.1%, respectively), the vast majority of children affected (35 million) live in the latter. Moreover, in the past two decades, the relative increase has been greater in the developing (65%) than in the developed countries (48%).1 These data are predictive of the overweight and obesity rates in adults in the future. Different studies have shown that obesity persists from childhood and adolescence into adulthood, and it is considered to be the main risk factor for non-transmissible chronic diseases in adults (high blood pressure, type 2 diabetes mellitus, coronary artery disease, cerebrovascular accidents, and some types of cancer). It is therefore associated with a high risk of mortality, morbidity, disability, and quality of life impairment, with the resultant high financial impact for society.2–4
Accurate measurements of total and regional body fat are essential to determine as soon as possible whether a particular group of children is at risk.5 Waist circumference (WC) and waist/hip ratio (WHR) are the measurements most commonly used to estimate abdominal fat6–8 because they have a positive, significant correlation to the amount of intra-abdominal fat as assessed by imaging studies both in adults and children, and because they are able to identify people at cardiometabolic risk better than body mass index (BMI) alone.6–9 Studies in children and adolescents have shown that, as occurs in adults, an increase in central fat is associated with the presence of metabolic and cardiovascular abnormalities including high blood pressure, lipid profile changes and, thus, with so-called metabolic syndrome (MS). It has also been noted that both fat distribution and the different cardiovascular risk factors tend to remain stable over time. Therefore, the use of WC is currently recommended for the diagnosis of central obesity in children.5
Genetic (sexual maturation and race) and environmental factors are involved in body fat increase and, particularly, in fat distribution.10,11 The Latin American population has particular body growth, development, and composition characteristics as the result of the crossbreeding of European, American Indian, and African ancestors, which makes it difficult to clearly differentiate environmental from genetic factors.6,9,12–15 Researchers have noted systematic differences between Hispanic, Caucasian, and Black children.6,9 This suggests the need for race-specific reference values for the identification of individuals at risk.6
Many countries have national growth charts, but these are not available in most countries.11 Venezuela has its own reference values16 (for height, weight, BMI, and others). However, the anthropometric variables of WC and waist/hip ratio (WHR), which complement nutritional evaluation and are of great importance for the early detection of impaired development and cardiometabolic risk in our children and for facilitating dietary interventions to restore their adequate development, are not available yet. This study examined a representative sample of schoolchildren and adolescents from the city of Mérida (Venezuela) from whom regional reference values of WC and WHR were obtained and subsequently compared to international references.
Subjects and methodsSubjectsThe study sample was part of a project entitled “Evaluation of growth, development, and cardiometabolic risk factors in schoolchildren and adolescents from Mérida, Venezuela (CREDEFAR)” which was conducted at Instituto Autónomo Hospital Universitario de Los Andes (IAHULA) from March 2010 to June 2011 with the participation of the departments of endocrinology, infantile nutrition, growth, and development, and clinical nutrition. The study population was taken from the registry of children and adolescents attending from the 4th grade to the 5th year of the diversified cycle at public and private teaching units of the Libertador district of the city of Mérida. The total population consisted of 32,630 children and adolescents aged 9–18 years, approximately 4000 subjects per year of age, 50.9% females and 49.1% males. Of these, 58% came from public institutions, and 42% from private schools. The sample was selected using proportional stratified, multistage random sampling that guaranteed adequate participation by sex, public or private institution (socioeconomic level), and geographical location. The sample consisted of 927 schoolchildren and adolescents aged 9–18 from eight public and five private institutions whose parents agreed to their participation in the study. All children and adolescents with chronic and debilitating diseases (e.g. diabetes, heart disease, kidney disease, neuropathy, other endocrine diseases, anemia), adolescents on medications with side effects known to affect the study variables (e.g. growth hormone, metformin) and pregnant girls were excluded from the study. The final sample consisted of 919 subjects.
ProcedureAfter approval had been obtained from the managements of the selected educational units, all representatives or responsible staff were sent an information leaflet explaining the study objectives and their significance and the written informed consent. Subjects were appointed to attend the IAHULA and demographic, dietary history, physical activity, and anthropometric data and other data of interest for the CREDIFAR project were recorded on a data collection form especially designed for the research. The ethical standards set down in the Declaration of Helsinki were met.
Children and adolescents were evaluated in underwear and with no shoes, and weight, height, and abdominal circumference were measured. A previously calibrated standard balance was used to record the weight of participants in kg. Height was measured using a Harpenden stadiometer. BMI was calculated using the formula weight (kg)/height2 (m). A subject was rated as obese if BMI was >97th percentile (pc) for age and sex in the curves for Venezuelan children and adolescents prepared by Fundacredesa,16 and as overweight if BMI was >90th pc and ≤97th pc. Weight was rated as normal if BMI was between the 10th and 90th pc, and as low if BMI was <10th pc. Anthropometric measurements were performed using the procedures recommended by the 2000 National Health and Nutrition Examination Survey (NHANES).17 WC was measured using an inextensible measuring tape at a point midway between the costal margin and the iliac crest (anterosuperior iliac spine) with the subject standing and breathing out. Hip circumference was measured at the gluteal prominence, and the waist/hip ratio was calculated. These variables were measured by specialists from the infantile nutrition, growth, and development unit of IAHULA.
Statistical analysisData collected were analyzed after excluding outliers in the study variables (±3 SD Z-score). WC and WHR were distributed by pc (5th, 10th, 25th, 50th, 75th, 90th, and 95th pc) according to age and sex. For other analyses, continuous variables were given as mean±standard deviation (SD), and categorical variables as numbers and percentages. Differences in the means of continuous variables were analyzed using a Student's t-test for independent samples or an ANOVA. A Chi-square test or a Fisher's test was used to establish associations between categorical variables. Our WC data were compared to data from the United States (US) taken from NHANES.18 A value of p<0.05 was considered statistically significant. SPSS version 15 software was used for statistical analysis.
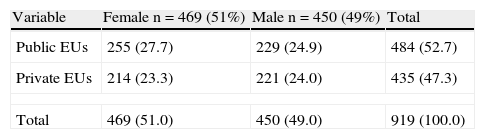
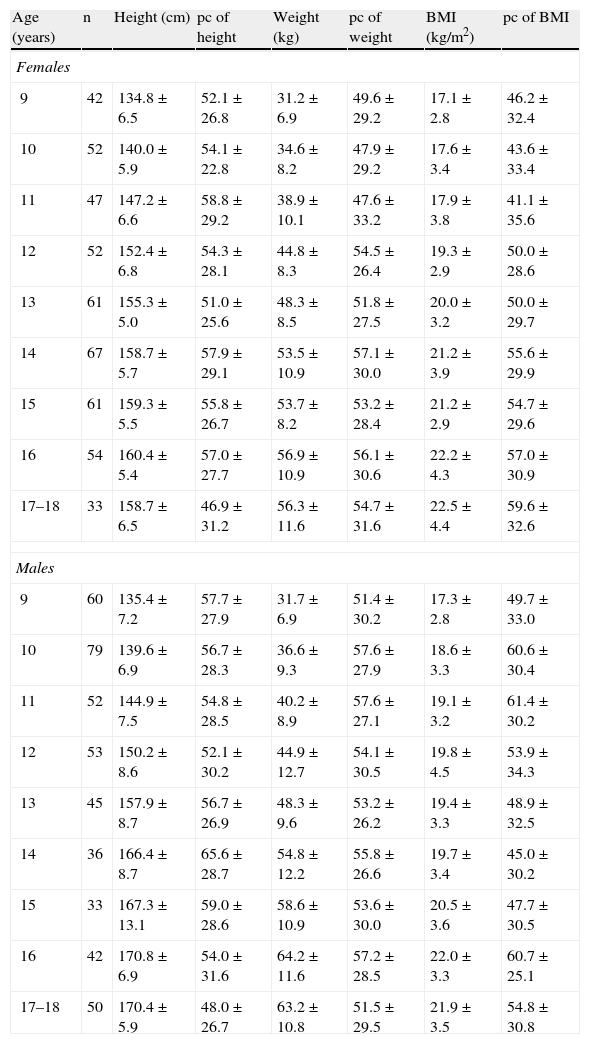
ResultsFifty-one percent of the sample subjects were females (n=469) and 49% males (n=450); 52.7% (n=484) and 47.3% (n=435), respectively, attended public and private educational institutions. There was no statistical difference by sex and educational institution (Table 1). Table 2 shows the mean and SD for height, weight, and BMI and their corresponding pcs by age and sex according to Venezuelan curves.12 These anthropometric variables significantly increased with age (p=0.0001), and height was higher in males from 14 years of age. Based on BMI, 72.8% (n=669) had normal weight, 9.8% (n=90) low weight, 9.6% (n=88) were overweight, and 7.8% (n=72) were obese.
Distribution of children and adolescents by sex and public and private educational institutions.
| Variable | Female n=469 (51%) | Male n=450 (49%) | Total |
| Public EUs | 255 (27.7) | 229 (24.9) | 484 (52.7) |
| Private EUs | 214 (23.3) | 221 (24.0) | 435 (47.3) |
| Total | 469 (51.0) | 450 (49.0) | 919 (100.0) |
Data are n (%).
EUs: educational units.
Values of height, weight, body mass index (BMI), and their corresponding percentiles by age and sex in children and adolescents of Mérida.
| Age (years) | n | Height (cm) | pc of height | Weight (kg) | pc of weight | BMI (kg/m2) | pc of BMI |
| Females | |||||||
| 9 | 42 | 134.8±6.5 | 52.1±26.8 | 31.2±6.9 | 49.6±29.2 | 17.1±2.8 | 46.2±32.4 |
| 10 | 52 | 140.0±5.9 | 54.1±22.8 | 34.6±8.2 | 47.9±29.2 | 17.6±3.4 | 43.6±33.4 |
| 11 | 47 | 147.2±6.6 | 58.8±29.2 | 38.9±10.1 | 47.6±33.2 | 17.9±3.8 | 41.1±35.6 |
| 12 | 52 | 152.4±6.8 | 54.3±28.1 | 44.8±8.3 | 54.5±26.4 | 19.3±2.9 | 50.0±28.6 |
| 13 | 61 | 155.3±5.0 | 51.0±25.6 | 48.3±8.5 | 51.8±27.5 | 20.0±3.2 | 50.0±29.7 |
| 14 | 67 | 158.7±5.7 | 57.9±29.1 | 53.5±10.9 | 57.1±30.0 | 21.2±3.9 | 55.6±29.9 |
| 15 | 61 | 159.3±5.5 | 55.8±26.7 | 53.7±8.2 | 53.2±28.4 | 21.2±2.9 | 54.7±29.6 |
| 16 | 54 | 160.4±5.4 | 57.0±27.7 | 56.9±10.9 | 56.1±30.6 | 22.2±4.3 | 57.0±30.9 |
| 17–18 | 33 | 158.7±6.5 | 46.9±31.2 | 56.3±11.6 | 54.7±31.6 | 22.5±4.4 | 59.6±32.6 |
| Males | |||||||
| 9 | 60 | 135.4±7.2 | 57.7±27.9 | 31.7±6.9 | 51.4±30.2 | 17.3±2.8 | 49.7±33.0 |
| 10 | 79 | 139.6±6.9 | 56.7±28.3 | 36.6±9.3 | 57.6±27.9 | 18.6±3.3 | 60.6±30.4 |
| 11 | 52 | 144.9±7.5 | 54.8±28.5 | 40.2±8.9 | 57.6±27.1 | 19.1±3.2 | 61.4±30.2 |
| 12 | 53 | 150.2±8.6 | 52.1±30.2 | 44.9±12.7 | 54.1±30.5 | 19.8±4.5 | 53.9±34.3 |
| 13 | 45 | 157.9±8.7 | 56.7±26.9 | 48.3±9.6 | 53.2±26.2 | 19.4±3.3 | 48.9±32.5 |
| 14 | 36 | 166.4±8.7 | 65.6±28.7 | 54.8±12.2 | 55.8±26.6 | 19.7±3.4 | 45.0±30.2 |
| 15 | 33 | 167.3±13.1 | 59.0±28.6 | 58.6±10.9 | 53.6±30.0 | 20.5±3.6 | 47.7±30.5 |
| 16 | 42 | 170.8±6.9 | 54.0±31.6 | 64.2±11.6 | 57.2±28.5 | 22.0±3.3 | 60.7±25.1 |
| 17–18 | 50 | 170.4±5.9 | 48.0±26.7 | 63.2±10.8 | 51.5±29.5 | 21.9±3.5 | 54.8±30.8 |
Data are means±SD.
Height, weight, and BMI significantly increased with age in both sexes (ANOVA: p=0.0001).
Height was significantly higher in boys from 14 years of age (p<0.002).
BMI: body mass index; pc: percentile.
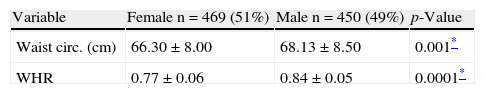
Table 3 shows the values of WC and WHR by sex. Both were found to be significantly lower in girls as compared to boys (p=0.001 and p=0.0001, respectively).
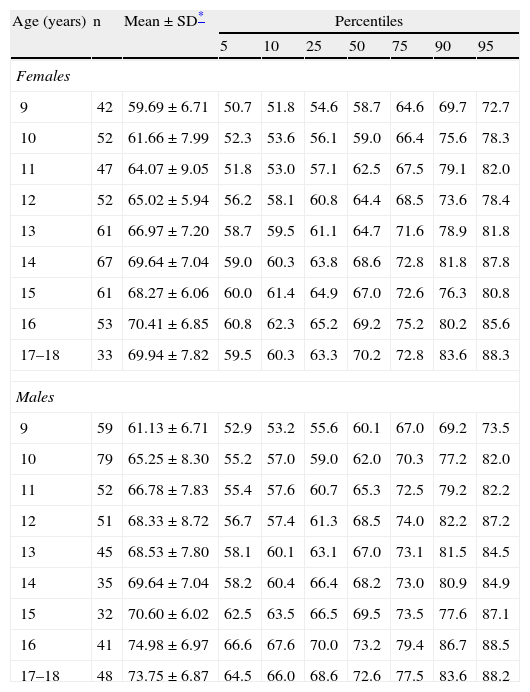
The tables below show the mean±SD and distribution by pc (5th, 10th, 25th, 50th, 75th, 90th, and 95th) of WC and WHR in children and adolescents by age and sex. At all ages, WC was greater in boys as compared to girls (Table 4) and mean±SD showed a progressive and significant increase with age (p=0.0001) in both sexes. WC values higher than the 90th pc were considered high (abdominal obesity); in this sample, WC values of the 90th pc in girls ranged from 69.7 to 83.6cm depending on age, while values in boys ranged from 69.2 to 86.7cm.
Percentile distribution of waist circumference (cm) by age and sex in children and adolescents of Mérida.
| Age (years) | n | Mean±SD* | Percentiles | ||||||
| 5 | 10 | 25 | 50 | 75 | 90 | 95 | |||
| Females | |||||||||
| 9 | 42 | 59.69±6.71 | 50.7 | 51.8 | 54.6 | 58.7 | 64.6 | 69.7 | 72.7 |
| 10 | 52 | 61.66±7.99 | 52.3 | 53.6 | 56.1 | 59.0 | 66.4 | 75.6 | 78.3 |
| 11 | 47 | 64.07±9.05 | 51.8 | 53.0 | 57.1 | 62.5 | 67.5 | 79.1 | 82.0 |
| 12 | 52 | 65.02±5.94 | 56.2 | 58.1 | 60.8 | 64.4 | 68.5 | 73.6 | 78.4 |
| 13 | 61 | 66.97±7.20 | 58.7 | 59.5 | 61.1 | 64.7 | 71.6 | 78.9 | 81.8 |
| 14 | 67 | 69.64±7.04 | 59.0 | 60.3 | 63.8 | 68.6 | 72.8 | 81.8 | 87.8 |
| 15 | 61 | 68.27±6.06 | 60.0 | 61.4 | 64.9 | 67.0 | 72.6 | 76.3 | 80.8 |
| 16 | 53 | 70.41±6.85 | 60.8 | 62.3 | 65.2 | 69.2 | 75.2 | 80.2 | 85.6 |
| 17–18 | 33 | 69.94±7.82 | 59.5 | 60.3 | 63.3 | 70.2 | 72.8 | 83.6 | 88.3 |
| Males | |||||||||
| 9 | 59 | 61.13±6.71 | 52.9 | 53.2 | 55.6 | 60.1 | 67.0 | 69.2 | 73.5 |
| 10 | 79 | 65.25±8.30 | 55.2 | 57.0 | 59.0 | 62.0 | 70.3 | 77.2 | 82.0 |
| 11 | 52 | 66.78±7.83 | 55.4 | 57.6 | 60.7 | 65.3 | 72.5 | 79.2 | 82.2 |
| 12 | 51 | 68.33±8.72 | 56.7 | 57.4 | 61.3 | 68.5 | 74.0 | 82.2 | 87.2 |
| 13 | 45 | 68.53±7.80 | 58.1 | 60.1 | 63.1 | 67.0 | 73.1 | 81.5 | 84.5 |
| 14 | 35 | 69.64±7.04 | 58.2 | 60.4 | 66.4 | 68.2 | 73.0 | 80.9 | 84.9 |
| 15 | 32 | 70.60±6.02 | 62.5 | 63.5 | 66.5 | 69.5 | 73.5 | 77.6 | 87.1 |
| 16 | 41 | 74.98±6.97 | 66.6 | 67.6 | 70.0 | 73.2 | 79.4 | 86.7 | 88.5 |
| 17–18 | 48 | 73.75±6.87 | 64.5 | 66.0 | 68.6 | 72.6 | 77.5 | 83.6 | 88.2 |
SD: standard deviation.
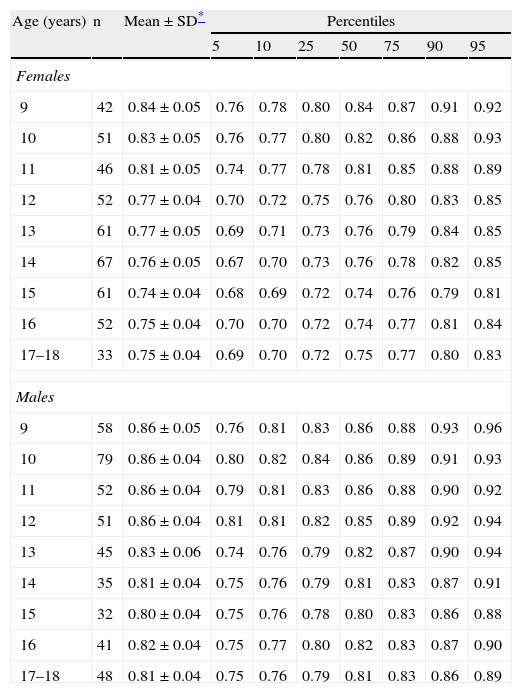
Table 5 shows the percentile distribution of WHR by age and sex. At all ages, WHR was higher in boys as compared to girls, and mean±SD showed a significant decrease in values recorded from 9 to 17–18 years of age (p=0.0001) for both sexes, as well as in all pcs, but was more marked in girls than in boys. WHR values higher than the 90th pc were considered high (abdominal obesity); in this sample, WHR values of the 90th pc in girls ranged from 0.79 to 0.91 depending on age, while values in boys ranged from 0.86 to 0.93.
Percentile distribution of waist/hip ratio by age and sex in children and adolescents of Mérida.
| Age (years) | n | Mean±SD* | Percentiles | ||||||
| 5 | 10 | 25 | 50 | 75 | 90 | 95 | |||
| Females | |||||||||
| 9 | 42 | 0.84±0.05 | 0.76 | 0.78 | 0.80 | 0.84 | 0.87 | 0.91 | 0.92 |
| 10 | 51 | 0.83±0.05 | 0.76 | 0.77 | 0.80 | 0.82 | 0.86 | 0.88 | 0.93 |
| 11 | 46 | 0.81±0.05 | 0.74 | 0.77 | 0.78 | 0.81 | 0.85 | 0.88 | 0.89 |
| 12 | 52 | 0.77±0.04 | 0.70 | 0.72 | 0.75 | 0.76 | 0.80 | 0.83 | 0.85 |
| 13 | 61 | 0.77±0.05 | 0.69 | 0.71 | 0.73 | 0.76 | 0.79 | 0.84 | 0.85 |
| 14 | 67 | 0.76±0.05 | 0.67 | 0.70 | 0.73 | 0.76 | 0.78 | 0.82 | 0.85 |
| 15 | 61 | 0.74±0.04 | 0.68 | 0.69 | 0.72 | 0.74 | 0.76 | 0.79 | 0.81 |
| 16 | 52 | 0.75±0.04 | 0.70 | 0.70 | 0.72 | 0.74 | 0.77 | 0.81 | 0.84 |
| 17–18 | 33 | 0.75±0.04 | 0.69 | 0.70 | 0.72 | 0.75 | 0.77 | 0.80 | 0.83 |
| Males | |||||||||
| 9 | 58 | 0.86±0.05 | 0.76 | 0.81 | 0.83 | 0.86 | 0.88 | 0.93 | 0.96 |
| 10 | 79 | 0.86±0.04 | 0.80 | 0.82 | 0.84 | 0.86 | 0.89 | 0.91 | 0.93 |
| 11 | 52 | 0.86±0.04 | 0.79 | 0.81 | 0.83 | 0.86 | 0.88 | 0.90 | 0.92 |
| 12 | 51 | 0.86±0.04 | 0.81 | 0.81 | 0.82 | 0.85 | 0.89 | 0.92 | 0.94 |
| 13 | 45 | 0.83±0.06 | 0.74 | 0.76 | 0.79 | 0.82 | 0.87 | 0.90 | 0.94 |
| 14 | 35 | 0.81±0.04 | 0.75 | 0.76 | 0.79 | 0.81 | 0.83 | 0.87 | 0.91 |
| 15 | 32 | 0.80±0.04 | 0.75 | 0.76 | 0.78 | 0.80 | 0.83 | 0.86 | 0.88 |
| 16 | 41 | 0.82±0.04 | 0.75 | 0.77 | 0.80 | 0.82 | 0.83 | 0.87 | 0.90 |
| 17–18 | 48 | 0.81±0.04 | 0.75 | 0.76 | 0.79 | 0.81 | 0.83 | 0.86 | 0.89 |
SD: standard deviation.
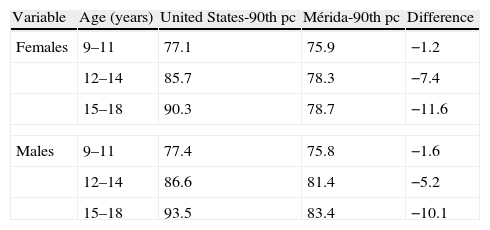
Because of the importance of values of the 90th pc of WC for diagnosing abdominal obesity, Table 6 compares our results, by age and sex group, to the reference values for children and adolescents in the United States.18 WC values are seen to be lower in our sample, with differences up to 10cm in both sexes.
Comparison of the values of the 90th percentile of waist circumference (cm) between children and adolescents from Mérida and the United States by age and sex.
| Variable | Age (years) | United States-90th pc | Mérida-90th pc | Difference |
| Females | 9–11 | 77.1 | 75.9 | −1.2 |
| 12–14 | 85.7 | 78.3 | −7.4 | |
| 15–18 | 90.3 | 78.7 | −11.6 | |
| Males | 9–11 | 77.4 | 75.8 | −1.6 |
| 12–14 | 86.6 | 81.4 | −5.2 | |
| 15–18 | 93.5 | 83.4 | −10.1 | |
pc: percentile.
This study was designed to establish regional reference values for WC and WHR in schoolchildren and adolescents of the city of Mérida. The data given show the behavior of these variables by age and sex. Both genetic (sexual maturation and race) and environmental factors are usually involved in body fat increase, and especially in fat distribution. In fold measurements, circumferences, and the conicity index, body weight increase and fat tissue accumulation have been seen to occur with age.11 Central fat mainly accumulates in male adolescents, while peripheral fat increases in girls.10 This was clearly demonstrated in our study, which showed a progressive and significant WC increase with age in both sexes. For the 50th pc, 11.5-cm and 12.5-cm increases, respectively, were seen in girls and boys from 9 to 17 years of age. WC was also seen to be greater in boys as compared to girls at all ages, in agreement with results reported by other studies.6,19
As regards WHR, a significant decrease in the values recorded from 9 to 17 years of age was found in all pcs for both sexes. This decrease was more marked in girls than boys and reflects a greater body fat distribution in the lower abdomen and pelvis in girls, a typical physiological characteristic of female adolescents.19
Several studies have clearly shown the influence of ethnicity and racial differences on body composition. Fernández et al.6 reported WC distribution in a representative sample of US children aged 2–18 years of different origins (African, European, and Mexican). Their results showed WC to differ depending on ethnic origin; thus, Mexican American children of both sexes had greater WC values than their counterparts of African or European origin. A comparison of WC values in Venezuelan children and adolescents of the city of Mérida showed a marked difference. Thus, for all pcs and for ages ranging from 9 to 17 years, our WC values were lower than those reported by the above authors, not only for the overall group but also for each group in terms of its ethnic origin.6 In female children and adolescents from Mérida, the 90th pc of WC ranged from 69.7 to 83.6cm, lower than those of US girls, which ranged from 73.6 to 101cm. Similarly, the 90th pc of WC ranged from 69.2 to 86.7cm in male children and adolescents from Mérida, as compared to from 74.6 to 105.2cm in US boys. This confirms the influence of environmental and socioeconomic factors in the development of individuals and shows the importance of establishing cut-off points for each region. It should be noted that these US reference curves were obtained during the period 1988–1994, which means that, as has been stated by Morales et al., comparisons are being made with subjects who were living in a historical, social, and cultural period different from the present.20
Cook et al.18 recently combined the available data from NHANES (NHANES III 1988–1994 and NHANES 1999–2006) and from the main studies conducted in children in the United States (the Bogalusa Heart Study, the Fels Longitudinal Study, the Muscatine Study, and the Lipid Research Clinics Prevalence Study) to create age- and sex-specific cut-off points for the pcs of WC and cardiovascular risk factors (lipid profile). This study was conducted on a larger sample and considered the influence of the current obesity epidemic. In addition, a comparison with the pc values of children and adolescents of Mérida showed a lower WC in our children and adolescents for all pcs and all ages. For the 10th, 25th, and 50th pcs, differences ranged from 2 to 4cm in both sexes, being more marked from 15 years of age in both sexes and for the 75th and 90th pcs, with US adolescents reaching differences 10–15cm higher than our adolescents. If our children and adolescents are assessed using these international references, a significant number of subjects with abdominal obesity would probably be missed because this warning of cardiometabolic risk would go unnoticed.
Sung et al.21 reported in 2007 the first WC curves for Chinese children. The sample consisted of 2590 children aged 6–12 years. WC values in our boys and girls were 1 or 2cm higher than those found in Chinese children.
A comparison of our study results with other Latin American references, specifically with the results reported by Ramírez-Velez et al.19 in Cali (Colombia), showed that WC values in the different pcs for all ages and both sexes were similar to our values, with Colombian values being slightly higher in the 90th and 95th pcs. As compared to the references recently published by Avalos et al.22 in a population of children from Santiago de Chile, our WC values were lower.
There have been recent reports of pc curves of WC in other regions of Venezuela, specifically in a group of adolescents in the state of Lara20 and in Maracaibo, in the state of Zulia.23 Children from the state of Lara had a greater WC than ours at 10 years, but similar values at 15 years. A comparison with children and adolescents from Maracaibo found our values to be 4–6cm lower at 9–11 years, but this difference increased to 8–10cm lower values between 11 and 17 years. These studies provide new anthropometric parameters which may be related to cardiovascular risk in adolescents from each of these Venezuelan areas and show that substantial differences exist between geographical areas which could be explained by the diversity in dietary habits, physical activity, weather, and genetic factors, amongst others. The Second National Study of Human Growth and Development (SENACREDH) currently conducted by FUNDACREDESA has considered these differences and includes children and adolescents from all areas of the country. Its anthropometric results will therefore serve as a national reference.24,25
To date, it has not been possible to establish whether lifestyle, physical exercise,26 diet, macronutrient and micronutrient intake and/or genetic determinants are responsible for these differences, which vary substantially between the different populations.27,28 It should also be noted that wide variations are seen at the age when sexual maturation starts in a population, regardless of ethnic and environmental characteristics. The Venezuelan population, as occurs with Cuban, Argentinian and Chilean children (and similarly to the pattern seen in Asian children), shows a trend to an earlier maturity which has often been reported.29,30 Early maturers have greater adiposity than average and late maturers of the same age, which could represent a biological risk for overweight and obesity in adulthood.
These significant differences in biological maturity and sexual dimorphism could explain the great changes in body weight and height between children and adolescents of a similar age but with a different grade of pubertal development, with the resultant difficulty for anthropometrical evaluation of their nutritional status using references which only consider chronological age.30 These findings show the importance of taking into account the different ethnic and racial groups in clinical research and suggest the need to develop ethnic-specific cut-off values to identify subjects at risk.6
The conduct of these studies has allowed us to obtain an integral overview of the physical growth and maturation of children and adolescents in relation to the social, economic, and cultural events influencing it, and to establish reference patterns for the population. Such strategies help increase our understanding of the systematic differences between groups, and so allow us to devise and implement measures to improve the health of a population.
In conclusion, regional reference values are provided for WC and WHR, which show age and sex variations consistent with the findings of other researchers and suggest changes during pubertal maturation, before adult values are established. It was also shown that international reference values are inadequate to assess the risk prevalence in this population group, because WC and WHR values in Venezuelan children and adolescents, although similar to those found in other Latin American and Asian regions, are lower than those seen in their US counterparts.
Conflicts of interestThe authors state that they have no conflicts of interest.
We would like to thank funding received from the Council of Scientific, Humanistic, Technological, and Art Development of Universidad de Los Andes (CDCHTA-ULA) under project M-1013-11-07-AA and ADG M-10, and also from the National Fund for Science, Technology and Innovation (Fonacit) of the Ministry of Popular Power for Science, Technology and Innovation with project no. 2012000970.
Please cite this article as: Mederico M, et al. Valores de referencia de la circunferencia de la cintura e índice de la cintura/cadera en escolares y adolescentes de Mérida, Venezuela: comparación con referencias internacionales. Endocrinol Nutr. 2013;60:235–42.
