

The interassay variability found in the measurement of testosterone (T) levels warrants the need for laboratories to validate their methods to establish trustworthy cut-off points for diagnosis of male hypogonadism. The aims of this study were to validate measurement of total T (TT) at our laboratory in order to obtain reference ranges for TT, calculated free T (CFT), calculated bioavailable T (CBT), and salivary T (ST) in healthy young men from the Mediterranean region, and to evaluate the potential clinical value of ST by establishing its correlation with serum T.
MethodsAn observational, cross-sectional study with sequential sampling. Inclusion criteria: men aged 18–30 years with body mass index (BMI)<30. Exclusion criteria: chronic diseases, hepatic insufficiency or use of drugs altering circulating T levels. Main outcome measures TT (chemiluminescent immunoassay UniCell DXI 800 [Access T Beckman Coulter]), CFT and CBT (Vermeulen's formula), and ST (radioimmunoassay for serum TT modified for saliva [Coat-A-Count, Siemens]). Descriptive statistical analyses and correlation by Spearman's rho (SPSS 19.0 Inc., Chicago) were used.
ResultsOne hundred and twenty-one subjects aged 24±3.6 years with BMI 24±2.5kg/m2 were enrolled. Hormone study: TT, 19±5.5nmol/L (reference range [rr.] 9.7–33.3); CFT, 0.38nmol/L (rr. 0.22–0.79); CBT, 9.7nmol/L (rr. 4.9–19.2); and ST, 0.35nmol/L (rr. 0.19–0.68). Correlation between ST and CFT was 0.46.
ConclusionsIn men from the Mediterranean region, values of TT>9.7nmol/L, CFT>0.22nmol/L, and/or CBT>4.9nmol/L make the presence of biochemical hypogonadism unlikely. According to the correlation between serum and ST, the clinical value of ST remains to be established.
La variabilidad interensayo existente en la determinación de testosterona (T) justifica la necesidad de que cada laboratorio valide su método y establezca puntos de corte fiables para el diagnóstico del hipogonadismo masculino. Los objetivos del estudio fueron validar la determinación de T total (TT) en nuestro laboratorio para obtener los valores de referencia de TT, T libre calculada (TLC), T biodisponible calculada (TBC) y T salivar (TS) en varones jóvenes sanos del área mediterránea y evaluar la posible utilidad clínica de la TS.
Material y métodosEstudio observacional transversal. Muestreo secuencial. Criterios de inclusión: varones, 18–30 años de edad, índice de masa corporal (IMC)<30. Criterios de exclusión: enfermedades crónicas, insuficiencia hepática o uso de medicamentos que alteran las concentraciones circulantes de T. Metodología: TT (inmunoanálisis de quimioluminiscencia UniCell DXI800 [Acces T Beckman Coulter]), TLC y TBC (fórmula de Vermeulen), TS (radioinmunoensayo para TT sérica modificado para la saliva [Coat-A-Count, Siemens]). Análisis estadísticos: descriptivos y correlación rho de Spearman (SPSS 19,0 Inc.,Chicago).
ResultadosSe incluyeron 121 individuos de 24±3,6 años e IMC 24±2,5kg/m2. Estudio hormonal TT, 19±5,5nmol/L (intervalo de confianza 95% 9,7–33,3); TLC, 0,38nmol/L ([P2,5–P97,5] 0,22–0,79); TBC, 9,7nmol/L ([P2,5–P97,5] 4,9–19,2); y TS, 0,35nmol/L ([P2,5–P97,5] 0,19–0,68). La correlación entre TS y TLC fue 0,46.
ConclusionesEn varones de la región mediterránea, concentraciones de TT>9,7nmol/L, TLC>0,22nmol/L y/o TBC>4,9nmol/L hacen improbable la presencia de hipogonadismo bioquímico. De acuerdo a la correlación entre la testosterona sérica y salivar, la utilidad clínica de la ST está aún por establecerse.
Hypogonadism is a state of androgen deficiency that has an adverse impact on both functions of multiple organ systems and on quality of life. Clinical guidelines recommend making a diagnosis of androgen deficiency only in men with consistent symptoms and signs of hypogonadism and unequivocally low serum testosterone (T) levels.1 In addition to sexual symptoms, objective manifestations of hypogonadism may include decreased muscle mass and strength, increased body fat, decreased bone mineral density and lower hemoglobin.1–4
The diagnosis of hypogonadism is easier when the presence of organic disease is associated with very low levels of circulating T, usually in the context of apparently healthy young male adults. However, the diagnosis could be more complicated if symptoms are less specific, like fatigue, irritability or reduced intellectual ability, and T levels do not clearly differentiate between physiological and pathological, as often happens in aging people (Late Onset Hypogonadism, LOH).1–6 Moreover, the scientific community has not yet established a normal range of reference of T levels for different ages as has been done for IGF-1 levels, and the range of reference for healthy young men is used to define normal or pathological secretion of T without taking in consideration the age of the patient.5,6 However, it is very important to identify hypogonadism in men because of its association with an increase in cardiovascular and mortality risk, and its decrease after replacement therapy.7,8 The limitation of a reliable measurement of T and its reference interval is the most important challenge to accurately diagnose biochemical hypogonadism in elderly people.2
The most widely accepted parameter for establishing the presence of hypogonadism is the measurement of serum total testosterone (TT).1–3 However, there are no generally accepted lower limits of normality. A recent consensus among the main societies of andrology and urology dealing with LOH in men suggests that TT levels above 12nmol/L (3.5ng/mL) do not require substitution, while levels below 8nmol/L (2.3ng/mL) will usually benefit from testosterone treatment.3,4 If the serum TT level is between 8 and 12nmol/L, or in diseases in which the high SHBG concentration induces an increase in TT values that can lead to the underestimation of hypogonadism, the determination of free testosterone (FT) or bioavailable testosterone (BT) by gold standard techniques (equilibrium dialysis [ED] and ammonium sulfate) or the calculation of free testosterone (CFT) or bioavailable testosterone (CBT) by mathematical equations may be helpful.9,10 In these cases, a CFT level below 0.225nmol/L (6.5ng/dL) can provide supportive evidence for testosterone treatment.3 However, threshold values for BT depend on the method used and are not generally available.3 Additionally, the Endocrine Society reports the existence of different lower limits for the normal range of TT and FT in healthy young men between several laboratories. So, both consensus are in agreement that there are known variations among assay methods, being imperative that practitioners utilize reliable laboratories and that they are acquainted with the reference intervals for TT and FT measured in them.1–3
The difficulty of determining FT and BT with the reference techniques in common clinical practice and the controversy in the distinct ways of calculating them has aroused the interest in salivary testosterone (ST). ST is a promising tool in the screening of hypogonadism as the salivary flux has no influence on T levels, the technique has big reproducibility (intra-assay coefficient of variation [CV]<10%), a sample is safe and easy to obtain, and can be stored for several days if refrigerated. However, more clinical studies are necessary for its validation.11–13
In spite of the previous recommendations by the andrology, urology and endocrinology societies, no population studies in our setting have assessed the reference intervals for serum and salivary T or estimated its free and bioavailable fractions. Moreover, a total of 50 Spanish laboratories, that employ our own TT measurement method, could benefit from our results. Therefore, the present study's objectives were to establish the reference ranges for TT, CFT, CBT and ST in young healthy men from the Mediterranean region and to study the correlation between the methods utilized in our laboratory for the determination of serum and salivary T in order to define its clinical utility.
Materials and methodsDesign and study subjectsA cross-sectional study was carried on, with sequential sampling of men in a military academy, medical students and health care professionals who met inclusion criteria and after signing informed consent. Samples were collected along one year, and all samples were analyzed in the laboratory of the Hospital General Universitario in Alicante. The study was carried out in accordance with the requirements of Spanish law in the field of biomedical research, data protection and bioethics. Inclusion criteria: age 18–30 years old, BMI<30. Exclusion criteria: chronic diseases, hepatic impairment or use of medications that may alter circulating concentrations of binding proteins (SHBG) or produce functional alterations of the gonadal axis.
Sample sizeIn the serum T determination, the sample size was estimated at 110 individuals, using a 95% confidence level, 20% precision and an expected standard deviation of 1.07. For the ST, the sample size was estimated at 121 individuals, using a 95% confidence level and an expected standard deviation of 44.97. For the age, the distribution percentages were applied to men with regard to the existing general population for each year of age, between 18 and 30 years old, obtained from the municipal register (Fig. 1).
Main outcome variables
TT was measured by chemiluminescent immunoassay [CLIA], (UniCell DXI 800 [Access testosterone Beckman Coulter]); intra-assay CV is 2.6% for 29.4nmol/L, 2.3% for 16.6nmol/L, and 4.3% for 2nmol/L; interassay CV is 5.4% for 26nmol/L, 3.9% for 16.6nmol/L, and 7.1% for 2nmol/L; total imprecision, <10% at a concentration between 6.9 and 34.7nmol/L; lower limit of sensitivity 0.35nmol/L; reference range [rr.] proposed by the manufacturer, 10.4–34.7nmol/L; 3–10ng/mL. To validate the determination of TT, we sent 10% of our sample to Mayo Medical Laboratories, Rochester, Minnesota to be measured by liquid chromatography in tandem with mass spectrometry (LC-MS).
CFT was calculated by determining TT, SHBG (nmol/L; rr. 4–72) (CLIA, IMMULITE 2000, [Siemens]), and albumin (rr. 480–803μmol/L; 3170–5300mg/dL) (kinetic nephelometry, immunochemical systems IMMAGE [Beckman Coulter]), from the equation FT=([T]−(N×[FT]))/(Kt{SHBG-[T]+N[FT]}), where Kt (109L/mol) is the association constant of SHBG for T, and N=(Ka [3.6×10⁴L/mol, association constant of albumin for T]×Ca [albumin concentration, g/L])+1, described by Vermeulen et al.10
CBT was calculated by adding to the CFT the T bound to albumin, obtained by the product of KaCa and CFT.10
ST was measured by a radioimmunoassay (RIA) for the quantification of TT in serum (Coat-A-Count, Siemens) that underwent in-house modifications in order to adapt it to saliva. With the aim of increasing sensibility, the overnight incubation time was prolonged, the reaction volume increased, and the calibration curve adapted after successive dilutions of the lower concentration calibrator, achieving an analytical sensitivity of 0.12nmol/L and an intraserial CV of 7.9%.
Sample collectionBlood and salivary samples were collected in fasting conditions, between 08.00 and 09.00am. All subjects were instructed not to brush their teeth 2h before the saliva collection. Two salivettes were used for the saliva sample with each swab placed beneath the tongue for at least 3min. The salivettes were then centrifuged at 570×g for 2min and the eluted saliva frozen at −20°C until processing.
Other variablesSociodemographic and lifestyle variables were recorded by clinical visit. Variables associated with the findings on physical examination were also recorded: weight (kg), height (m), body mass index (BMI) calculation (weight [kg]/height [m2]), and waist perimeter (cm).
Statistical analysisDescriptive statistics, the quantitative variables were expressed as mean and standard deviation (mean±SD) (parametric distribution) and as median and quartiles (median [P25–P75]) (nonparametric distribution). The distribution of the quantitative variables was obtained by Kolmogorov–Smirnov test. The percentile ranges for TT, CFT, CBT and ST were calculated. By convention, the 2.5th percentile of the variable defines the lower limit of the reference range and the 97.5th percentile the upper.2,6 Spearman's rho was used to study both the correlation between the methods of determining TT as well as to study the correlation between salivary and serum T concentrations. The level of statistical significance was p<0.05. The data were processed with SPSS (SPSS 19.0 Inc., Chicago, IL).
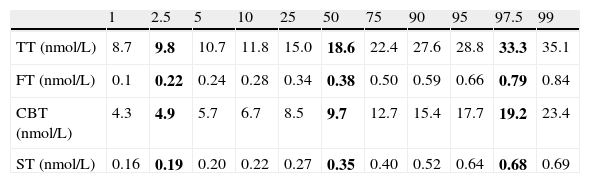
ResultsA sample of 121 individuals was obtained whose mean age was 24±3.6 years old, weight 76.5±9kg, waist circumference 86±7.6cm, and BMI of 24.5±2.5kg/m2. The mean TT concentration was established at 19±5.5nmol/L (5.4±1.6ng/mL) at a 95% confidence interval [CI] 9.7–33.3nmol/L (2.8–9.6ng/mL). The studied correlation between the method used in our laboratory to determine TT and LC-MS reached a value of 0.82 (p=0.02). The mean albumin concentration was 712±76μmol/L (4700±500mg/dL) at a CI 507–838μmol/L (3352–5530mg/dL), and the mean SHBG concentration was 29.5±9.7nmol/L at a CI 12–51nmol/L. The median CFT was 0.38nmol/L [0.34–0.50] and the rr. 0.22–0.79nmol/L (6.4–22.7ng/dL); the median CBT was 9.7nmol/L [8.5–12.7] and the rr. 4.9–19.2nmol/L (141–554ng/dL). For the ST, the median was 0.35nmol/L [0.27–0.40] and the rr. 0.19–0.68nmol/L (53.2–195.8pg/mL). The percentile ranges for TT, CFT, CBT and ST for the 121 patients studied are shown in Table 1. The correlation between the ST and TT concentrations was 0.39 (p<0.001), while that between the ST with CFT and CBT reached a value of 0.46 (p<0.001) and 0.45 (p<0.001), respectively (Fig. 2).
Percentile distribution of TT, CFT, CBT and ST.
| 1 | 2.5 | 5 | 10 | 25 | 50 | 75 | 90 | 95 | 97.5 | 99 | |
| TT (nmol/L) | 8.7 | 9.8 | 10.7 | 11.8 | 15.0 | 18.6 | 22.4 | 27.6 | 28.8 | 33.3 | 35.1 |
| FT (nmol/L) | 0.1 | 0.22 | 0.24 | 0.28 | 0.34 | 0.38 | 0.50 | 0.59 | 0.66 | 0.79 | 0.84 |
| CBT (nmol/L) | 4.3 | 4.9 | 5.7 | 6.7 | 8.5 | 9.7 | 12.7 | 15.4 | 17.7 | 19.2 | 23.4 |
| ST (nmol/L) | 0.16 | 0.19 | 0.20 | 0.22 | 0.27 | 0.35 | 0.40 | 0.52 | 0.64 | 0.68 | 0.69 |
TT, total testosterone; CFT, calculated free testosterone; CBT, calculated bioavailable testosterone; ST, salivary testosterone. P2.5, P50 and P97.5 values are shown in bold.
 Correlations of salivary testosterone with serum total testosterone (r=0.39)*, (B) salivary testosterone with serum calculated free testosterone (r=0.46)* and (C) salivary testosterone with serum calculated bioavailable testosterone (r=0.45)*; *p<0.001.")
Correlation between salivary testosterone and serum testosterone concentrations. (A) Correlations of salivary testosterone with serum total testosterone (r=0.39)*, (B) salivary testosterone with serum calculated free testosterone (r=0.46)* and (C) salivary testosterone with serum calculated bioavailable testosterone (r=0.45)*; *p<0.001.
The reference ranges established in our laboratory for healthy young men fall between 9.7 and 33.3nmol/L for TT, 0.22 and 0.79nmol/L for CFT, 4.9 and 19.2nmol/L for CBT, and 0.19 and 0.68nmol/L for ST. According to main scientific societies, a TT greater than 9.7nmol/L in absence of diseases or drugs that involves changes in SHBG or albumin rules out the presence of hypogonadism and makes unlikely the benefits from hormone replacement therapy in men despite consistent symptoms and signs of hypogonadism.1–3
In healthy adult men, 45–65% of the circulating T is specifically bound to SHBG, 35–55% to albumin and 3–5% to cortisol-binding globulin, while only 0.5–3% circulates in plasma in free form (FT).1 Bioavailable testosterone (BT) refers to the sum of the FT and the T bound loosely to the albumin and represents the fraction of the TT that is physiologically active.1 TT represents the sum of unbound and protein-bound T in circulation, and its determination can be performed by RIA, CLIA, or by LC-MS. The latter is considered the method of reference, although inaccessible for most laboratories.1–3,14 The CLIA to determine TT in our laboratory behaves as a robust and reliable method according to its correlation with LC-MS (Mayo Medical Laboratories, Roches, Minnesota).
The Endocrine Society establishes the range of serum concentrations of TT between 9.8 and 10.4nmol/L (2.8 and 3ng/mL) as the lower limit within the normal range for healthy young men, and highlights the existing significant variability in the determination of T according to the different techniques used by clinical laboratories.1–3 The value of 10.4nmol/L (3ng/mL) is in accordance with the lower reference interval as measured by gas chromatography–mass spectrometry in 147 young men aged 21–35 years with verified normal sexual and reproductive function.6 However, the automation of the immunoassays for the evaluation of T has resulted in decreased sensibility and specificity, causing large variability in its results, as well as in the reference ranges of the normal values obtained.1,14 Because of this, the figures for T published in some clinical guidelines must be considered indicative, and it is necessary that each laboratory validates its method and delimits its own reference interval in healthy men that allow setting reliable cut-off points in diagnosing male hypogonadism.5,14,15 In our study the TT threshold of 9.7nmol/L (2.8ng/mL) was considered reliable to differentiate between normality and hypogonadism in young male people according to the previous results and recommendations.
TT is useful for studying gonadal function in the majority of patients, but in some diseases or clinical conditions, changes in SHBG levels could modify the TT values and induce over or underestimation of the diagnosis of hypogonadism. In these cases, the CFT and CBT could be suitable for determining real gonadal function.1,9,10
Age is another confounding factor in the determination of serum TT.6,16 In accordance with the Massachusetts Male Aging Study, CBT and CFT concentrations decrease 1.2% and 1% annually, while those of TT do so by 0.4% per year due to a 1.2% annual increase in SHBG concentrations.17,18 Therefore, a significant percentage of healthy older men may have TT levels below the normal lower limit of those in healthy young men, reinforcing the recommendation for an interpretation of biochemical data weighed with good clinical judgment for an accurate diagnosis of LOH.18 The TT threshold of 6.4nmol/L (1.84ng/mL) proposed by Yeap et al. could be considered for defining low T levels in men aged 70 years old or older and is in accordance with the more conservative views of the consensus panel but additional studies are needed to test the potential applicability and clinical utility of this threshold in older men.6
Although the apparent free testosterone concentration (AFTC) can be measured accurately by ED and the BT concentration by ammonium sulfate, these accurate and reliable reference assays are expensive, laborious, and usually are not available in local laboratories or useful in everyday clinical practice.1,19 The determination of FT by direct methods (RIA) and the FT index (FTI) do not adequately reflect the FT when comparing it with its determination by ED.14,20 However, the use of mathematical equations that consider the binding kinetics of FT to albumin and SHBG, and which allow the calculation of the FT and BT starting from the baseline TT, albumin and SHBG, provide results that are very concordant with those obtained by the reference techniques with correlation coefficients between 0.67 and 0.98.10,14,21 Therefore, the CFT and CBT could be real surrogates of FT in serum.21
According to the literature, the normal lower values for FT oscillate between 0.17 and 0.31nmol/L (5 and 9pg/mL), while for BT they are around 5.2nmol/L (150ng/dL).1,14,22 The results in our study are concordant with these values, and allow establishing the normal lower value for CFT at 0.22nmol/L (6.4pg/mL) and for CBT at 4.9nmol/L (141ng/dL) in young male people.
The present-day demand for a reproducible technique for outpatient study of gonadal function and the controversy between the distinct ways to determine CFT in plasma has reinforced the interest in the determination of ST. Moreover, the ST should permit large epidemiological studies and even to study the circadian rhythm of T secretion; however, its clinical applicability remains questionable.23 According to Arrenger et al., ST is useful in outpatient screening for hypogonadism because it seems to be strongly correlated with the CFT in both eugonadal (r=0.92) and hypogonadal men (r=0.97), even under conditions associated with alterations in SHBG concentrations, like chronic renal failure in hemodialysis.11,24 Regrettably, in our study, although the normal lower value of ST (0.19nmol/L; 53.2pg/mL) was similar to that reported in the literature, the correlation existing between the determination of salivary and serum T did not reach the values described by Arrenger et al. So, as has been proposed in the determination of serum T, given the variability in the values obtained through the use of different techniques, each laboratory must establish the reference values for ST that allow for differentiating between eugonadal and hypogonadal patients12 before its use in clinical or epidemiological practices, strengthening the need to continue the research in this field.
The sample size is not large, but its calculation was established based on the study's primary objective with a 95% confidence level and a precision of 20%. Moreover, the International Federation of Clinical Chemistry establishes within its protocols the necessity of studying at least 120 healthy young individuals in order to be able to establish a reference range, and this validates our results.25
One major concern in our study is the use of CLIA for quantifying TT levels. However, the resulting correlation in a significant sample of our study population between the TT concentration by CLIA and the resulting TT concentration by LC-MS at an external laboratory validates our technique.15,20,26
Another major concern in our study is the absence of CFT validation compared to the AFTC determinated by ED in our population. The principal limitation of the CFT is its dependence upon the methods employed to determine the TT and SHBG.19 However, as we report, our method of TT quantification is very reliable, and the CFT and the AFTC were almost identical in studies of populations with SHBG capacities varying from low to extremely high, as in hyperthyroidism.21,27
As for ST, the lack of a strong correlation obtained with the methods to determine serum T may be affected by the method utilized in our laboratory for the ST. Recent publications suggest that LC-MS assay is more specific for determining ST with no interferences from other steroids but it is an expensive method generally not available in local laboratories.28–30 A comparison of ST LC-MS assay with an established ST RIA found that the RIA produced T concentrations approximately 30% higher than those obtained with LC-MS method and had poor correlation. This difference can probably be attributed to the poorer specificity of the capture antibody in the RIA method.28
Our established reference values in healthy young men are a basic diagnostic tool for the suitable study of hypogonadism in our surroundings and are also useful for clinics in the Mediterranean region whose laboratories employ the same methods for determining TT and SHBG. Within the general population, a TT >9.7mmol/L makes unlikely the diagnosis of hypogonadism and the potential benefits from hormone replacement therapy. In the presence of diseases or drugs that involve changes in SHBG or albumin where the value of TT is unreliable, a CFT >0.22nmol/L and/or a CBT >4.9nmol/L rules out the diagnosis of hypogonadism.
ST is a promising method in the study of gonadal function. However, according to our results, its clinical applicability remains to be established due to its poor correlation with TT, CFT and CBT.
Conflicts of interestThe authors declare that they do not have any conflicts of interest.