


To assess the relationship between physical performance (PP) and muscle strength (MS) in elderly subjects with and without diabetes in a public hospital of Lima, Peru.
Subjects and methodA cross-sectional analysis of subjects aged 60 years or older with and without diabetes. MS was measured with a handheld dynamometer, and PP with the “timed get-up-and-go” test. Nutritional status was determined using body mass index, body fat percentage measured with a handheld fat loss monitor and protein intake based on the 24-hour recall. Age, sex, and history of hospitalization and supplementation were also recorded. The association was assessed using adjusted prevalence ratios.
ResultsOverall, 139 patients with diabetes (26.6% with low PP and 13.7% with decreased MS) and 382 subjects without diabetes (36.6% with low PP and 23.0% with decreased MS) were evaluated. No association was found between T2DM and MS (aPR: 0.99; 95% CI: 0.67–1.57) or PP (aPR: 1.13; 95% CI: 0.84–1.52). Protein and supplement consumption was also unrelated (p>0.05); however, history of hospitalization, age, sex, nutritional status, and body fat percentage were related (p>0.05).
ConclusionsNo association was found between T2DM, MS, and PP. However, low PP was associated to female sex and overweight/obesity, and decreased MS was associated to high body fat percentage and underweight. Moreover, MS and PP were related to older age and history of hospitalization.
Evaluar la asociación entre la fuerza muscular (FM) y el rendimiento físico (RF) en adultos mayores con y sin diabetes de un hospital público de Lima (Perú).
Pacientes y métodoEstudio transversal en pacientes ≥60 años con y sin diabetes. Se midió la FM con dinamómetro manual y el RF con prueba «timed get-up-and-go». Se determinó el estado nutricional con el índice de masa corporal, el porcentaje de grasa corporal con bioimpedanciómetro manual y se evaluó el consumo proteico mediante recordatorio de 24h. Además, se registró edad, género, antecedente de hospitalización y suplementación. Se evaluó la asociación con razones de prevalencias ajustadas (RPa).
ResultadosSe evaluó a 139 pacientes con diabetes (26,6% con bajo RF y 13,7% con FM disminuida) y a 382 sin diabetes (36,6% con bajo RF y 23,0% con FM disminuida). No se halló asociación de DM2 con FM (RPa: 0,99; IC 95%: 0,67-1,57) ni con RF (RPa: 1,13; IC 95%: 0,84-1,52). Tampoco se asoció el consumo proteico ni de suplementos (p>0,05), pero sí el antecedente de hospitalización, la edad, el género, el estado nutricional y el porcentaje de grasa corporal (p<0,05).
ConclusionesNo se encontró asociación entre DM2, FM y RF. Sin embargo, el bajo RF se asoció con ser mujer y presentar sobrepeso/obesidad y tener la FM disminuida, con tener alto porcentaje de grasa corporal y bajo peso. Además, ambos se relacionaron con el aumento de edad y tener antecedente de hospitalización.
The health of elderly subjects goes beyond the presence or absence of any disease; what matters is their “functional capacity”. The aging process is not a disease; it is however considered a high risk factor for increased morbidity and mortality, particularly if accompanied by an inadequate lifestyle or a disease affecting the functional reserve.1
Elderly subjects are usually at greater risk of experiencing some metabolic disease, such as type 2 diabetes mellitus (T2DM).2 In this regard, according to the International Diabetes Federation (IDF) there were 107 million adults aged 60–79 years with diabetes worldwide in 2010, and an increase to 196 million sufferers is predicted for 2030.3 According to recent epidemiological surveys in the United States, the prevalence of diabetes in adults over 65 years of age ranges from 22% to 33%.4
In this context, T2DM not only increases morbidity and mortality in elderly subjects,5 but also affects their functional capacity.2 T2DM has been seen to be associated with decreased muscle strength (MS) and physical performance (PP) in elderly subjects.2,6 These indicators do not only serve as predictors of the quality of life, but are also potent predictors of the life expectancy and mortality of individual elderly subjects.7 Their early control is therefore important.
It is thus relevant to assess these associations in elderly subjects in order to prevent further impairment of their functional capacity and a greater increase in morbidity and mortality from diabetes itself. The study objective was therefore to compare MS and PP in elderly subject with and without diabetes.
Patients and methodsStudy design and siteA comparative, cross-sectional study was conducted from September 2014 to March 2015 of elderly patients attending the outpatient clinics of Endocrinology, Geriatrics and Nutrition of Hospital Nacional Hipólito Unanue (HNHU), a national reference hospital of the Ministry of Health located in Lima (Peru).
Population and sampleTwo groups of patients aged 60 years or above who attended the outpatient clinic of HNHU were recruited. Patients with diabetes had a diagnosis of T2DM in their clinical histories, while patients without diabetes had had a measurement of fasting blood glucose in the previous six months <110mg/dL.8 The capillary blood glucose levels of all patients without diabetes were tested (using a One Touch® glucose meter), and were required to be <110mg/dL in fasting conditions or <140mg/dL in postprandial conditions.8 They were also required not to have had a history of taking glucose-lowering drugs or a diagnosis of prediabetes.
Patients from both groups with a history of liver cirrhosis, end-stage chronic kidney failure, advanced heart failure, chronic obstructive pulmonary disease, cancer, HIV, impaired consciousness, limb amputation, metallic implants, pacemakers or defibrillators, or hand osteoarthritis were also excluded from the study, as were patients using walkers or wheelchairs or with a history of hospitalization within 4 weeks of evaluation. In the group of patients with diabetes, those diagnosed with disease complications affecting functional capacity, such as retinopathy, polyneuropathy, and diabetic foot, were similarly excluded.
PASS v13.0 software with the formula to estimate the prevalence ratio and the Poisson regression model were used. A PR of 1.5 as worst case scenario, a 95% confidence interval, a 90% power, an R2 in variable adjustment of 0.4, and a 3/1 ratio between patients with and without diabetes were considered necessary. The recruitment of at least 510 participants was required, and on the assumption that approximately 10% of patients would refuse participation, the recruitment of 562 subjects, 141 with diabetes and 421 without diabetes, was decided upon. The patients were enrolled during consecutive mornings in all three outpatient clinics until the required sample size was achieved.
Study variablesDecreased muscle strengthThis was measured through hand grip strength (kg) using a CAMRY dynamometer. This is a simple, noninvasive, and safe method for measuring MS in the elderly, and it also correlates to lower limb strength.9 For the test, age and sex were recorded on the dynamometer, and the subjects were required to perform twice the maximum possible grip with their dominant hand. There were sixty-second intervals between the attempts to avoid muscle fatigue. The best attempt was recorded.10 To categorize MS decrease, quintiles by sex were generated and the following categories were used: yes (lowest quintile) and no (upper quintiles).11 Women: yes (<8.4kg) and no (≥8.4kg); men: yes (<15.4kg) and no (≥15.4kg).
Low physical performanceThis was measured using the “timed get-up-and-go” (TGUG) test, which is a rapid, practical evaluation that requires little space and measures PP, dynamic balance and, thus, the functional capacity of the subject evaluated. For this, the time required for a subject to get up from a chair, walk 3m, turn around, and sit back on the same chair was measured twice. A test attempt was first done, and the second attempt was recorded.12 For PP to be considered low, the result had to be ≥10s.13
Protein consumptionThis was measured based on the 24-hour recall survey, which is very accurate for estimating nutrient intake.14 All food and drink ingested over the 24h of an average day, from the first intake in the morning to the last intake of the day14 was recorded, along with the weekly frequencies of consumption of each item. This listing was undertaken by the elderly subjects themselves with the help of those living with them, and was recorded as weight in grams or as typical household measures with the help of graphic materials and decoders15 so that the nutritional composition of the whole daily intake based on the reported frequency could be subsequently analyzed. Protein consumption was categorized as low (≤0.8g/kg/day), medium (0.9–1.2g/kg/day), or high (≥1.3g/kg/day).16
Nutritional statusThis was measured using the body mass index (BMI), which was estimated as current weight in kilograms divided by height in meters squared. Weight was measured with a mechanical platform scale with the patient standing upright and relaxed on the middle of the platform with his/her arms to the sides of the body, the heels slightly apart, and the tips of the feet separated forming a “V”. The patients did not wear shoes or excess clothes, and had no weighty objects in their pockets (mobile phone, keys, wallet, etc.).17 Height was taken from the clinical records. Nutritional status based on the BMI for elderly subjects was classified as low (BMI≤23kg/m2), normal (BMI 23–27.9kg/m2), overweight (BMI 28–31.9kg/m2), or obesity (BMI≥32kg/m2).17
Percent body fatThis was measured using a hand-held OMRON 306 C body fat analyzer, an easy to use, reproducible, and noninvasive method18 whose results have a quite high correlation to those provided by DEXA (R2>0.9) in body composition analysis.19 The patients had no metal accessories, had not taken any food or drink or performed any physical activity for 2h before measurement, and did not have a full urinary bladder. The weight, height, age, sex, and physical condition of the patients were then recorded on the device, and the patients were asked to take both sides of the body fat analyzer with their hands, with the skin of the palm of the hand in contact with the metal. The results were recorded after an interval of a few seconds.18 To categorize percent body fat, tertiles by sex were generated and low, medium, and high categories were used.20 Male: low (<30.3%), medium (30.3–34.0%), and high (>34.0%). Female: low (<41.3%), medium (41.3%–45.7%), and high (>45.7%).
Finally, the use of nutritional supplements (yes/no), age (by decades: 60–69 years, 70–79 years, and 80 years or older),21 sex (male/female), and a history of hospital admission in the previous 12 months (yes/no), self-reported or taken from the clinical records, were assessed. In the patients with diabetes, the treatment used (metformin, glibenclamide, glimepiride, insulin, or other), disease duration in years (self-reported or taken from the clinical records), and the value of glycosylated hemoglobin (HbA1c) in the previous three months (available in the clinical records), which was considered to suggest poor control when >7.0%, were also collected.
Data collection procedurePatients who met inclusion and exclusion criteria and who agreed to participate signed an informed consent form. Participants without diabetes according to the clinical records were given capillary blood glucose tests, and those who had impaired values were excluded from the study. Clinical history data were then collected, anthropometric measures were taken, along with sociodemographic variables and 24-hour recall surveys, and dynamometric and PP tests were performed.
Data analysisA double entry database was generated, which was analyzed using STATA v13.0. Categorical variables were presented using absolute and relative frequencies. The association between variables was assessed using a Chi-squared test, and crude and adjusted prevalence ratios (aPR) were calculated using Poisson regression models with consistent standard errors. Adjusted models were generated with the variables having values of p<0.10 in the bivariate analysis. Values of p<0.05 were considered statistically significant.
Ethical issuesThe study was approved by the ethics committee of the Universidad Peruana de Ciencias Aplicadas (CEI/239-04-14) and HNHU (letter no. 170-CIEI-HNHU-2014/dossier no. 6143). Patients signified their agreement by signing an informed consent form. The data were anonymously recorded in the database. Once the evaluation was completed, each patient was given general nutritional recommendations based on the results obtained, and confidentiality was maintained.
ResultsOf the 630 elderly subjects invited, 606 agreed to participate and 85 were excluded after glucose tests due to impaired fasting (>110mg/dL) or postprandial (>140mg/dL) levels. The final study sample consisted of 521 subjects, 139 with diabetes and 382 without diabetes.
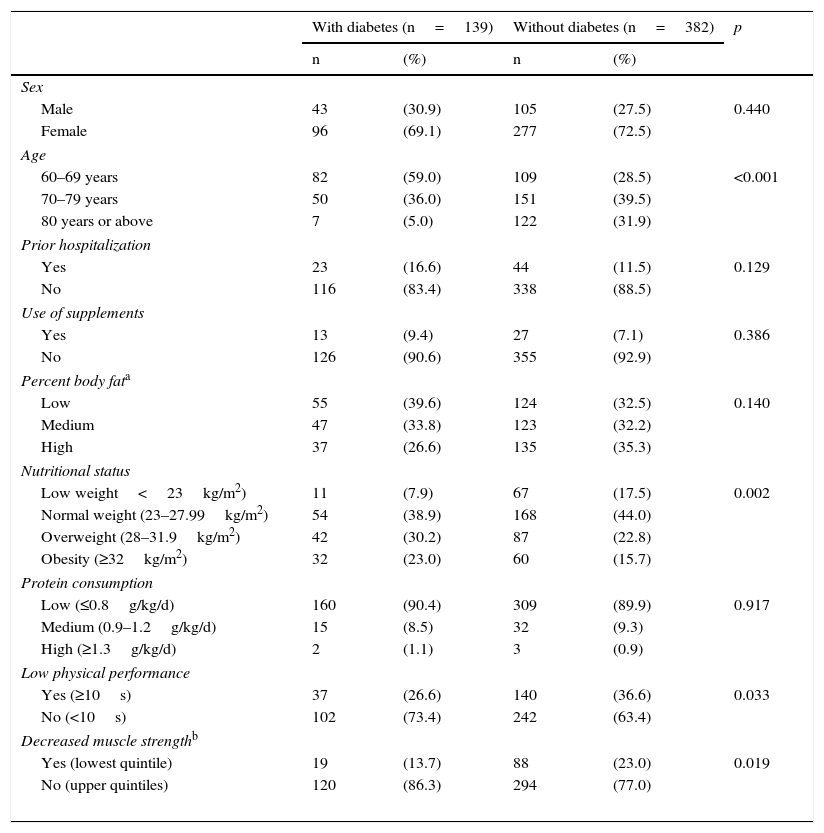
Females predominated in both groups. Patients in the group with diabetes were younger, as 95% were 60–79 years old, while patients from the group with no diabetes were more uniformly distributed between the three age groups (p<0.001). No difference was seen in history of hospitalization. Approximately 90% of the patients had low protein consumption and did not use nutritional supplements, with no difference between the groups. There was no difference in percent body fat, but a difference was seen in obesity. In addition, as regards PP, only 26.6% of elderly patients with diabetes had low PP. With regard to MS, only 13.7% of elderly patients with diabetes showed decreased MS (Table 1).
General characteristics of patients with and without diabetes from a public hospital in Lima (n=521).
| With diabetes (n=139) | Without diabetes (n=382) | p | |||
|---|---|---|---|---|---|
| n | (%) | n | (%) | ||
| Sex | |||||
| Male | 43 | (30.9) | 105 | (27.5) | 0.440 |
| Female | 96 | (69.1) | 277 | (72.5) | |
| Age | |||||
| 60–69 years | 82 | (59.0) | 109 | (28.5) | <0.001 |
| 70–79 years | 50 | (36.0) | 151 | (39.5) | |
| 80 years or above | 7 | (5.0) | 122 | (31.9) | |
| Prior hospitalization | |||||
| Yes | 23 | (16.6) | 44 | (11.5) | 0.129 |
| No | 116 | (83.4) | 338 | (88.5) | |
| Use of supplements | |||||
| Yes | 13 | (9.4) | 27 | (7.1) | 0.386 |
| No | 126 | (90.6) | 355 | (92.9) | |
| Percent body fata | |||||
| Low | 55 | (39.6) | 124 | (32.5) | 0.140 |
| Medium | 47 | (33.8) | 123 | (32.2) | |
| High | 37 | (26.6) | 135 | (35.3) | |
| Nutritional status | |||||
| Low weight<23kg/m2) | 11 | (7.9) | 67 | (17.5) | 0.002 |
| Normal weight (23–27.99kg/m2) | 54 | (38.9) | 168 | (44.0) | |
| Overweight (28–31.9kg/m2) | 42 | (30.2) | 87 | (22.8) | |
| Obesity (≥32kg/m2) | 32 | (23.0) | 60 | (15.7) | |
| Protein consumption | |||||
| Low (≤0.8g/kg/d) | 160 | (90.4) | 309 | (89.9) | 0.917 |
| Medium (0.9–1.2g/kg/d) | 15 | (8.5) | 32 | (9.3) | |
| High (≥1.3g/kg/d) | 2 | (1.1) | 3 | (0.9) | |
| Low physical performance | |||||
| Yes (≥10s) | 37 | (26.6) | 140 | (36.6) | 0.033 |
| No (<10s) | 102 | (73.4) | 242 | (63.4) | |
| Decreased muscle strengthb | |||||
| Yes (lowest quintile) | 19 | (13.7) | 88 | (23.0) | 0.019 |
| No (upper quintiles) | 120 | (86.3) | 294 | (77.0) | |
Patients with diabetes had had the disease for 8.6±9.7 years on average, 18.8% of them were on insulin therapy, and 52.9% had glycosylated hemoglobin levels higher than 7.0%. No association was found between the type of medication, disease duration, or blood glucose control and the presence of decreased MS or low PP (p>0.05).
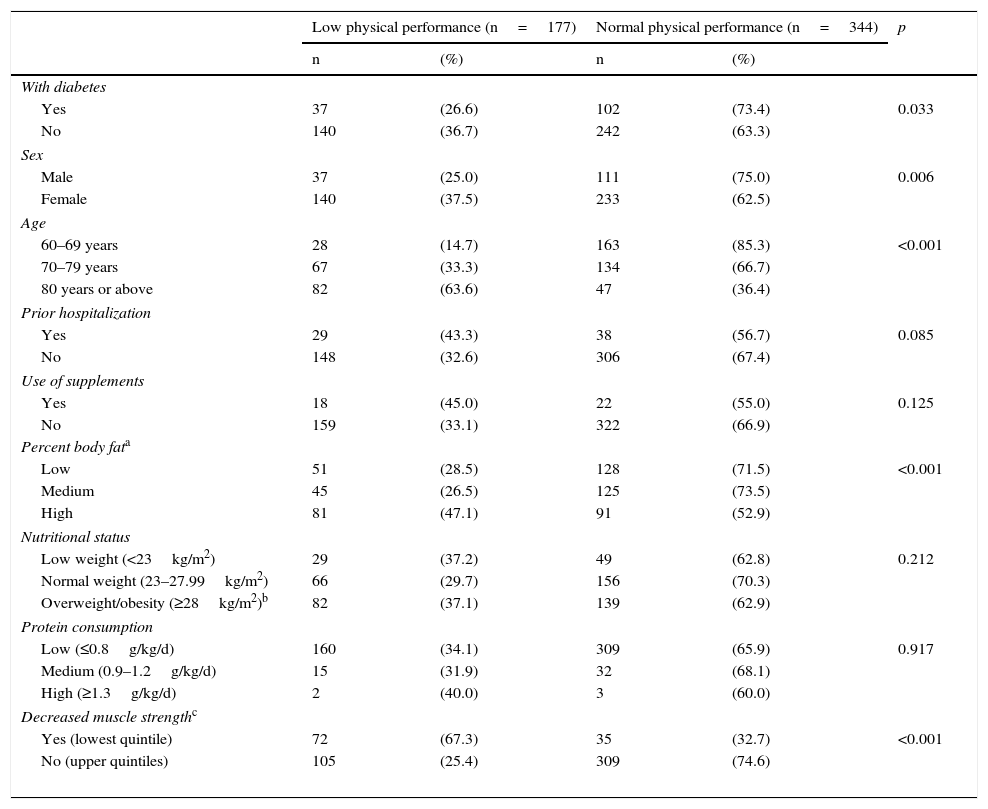
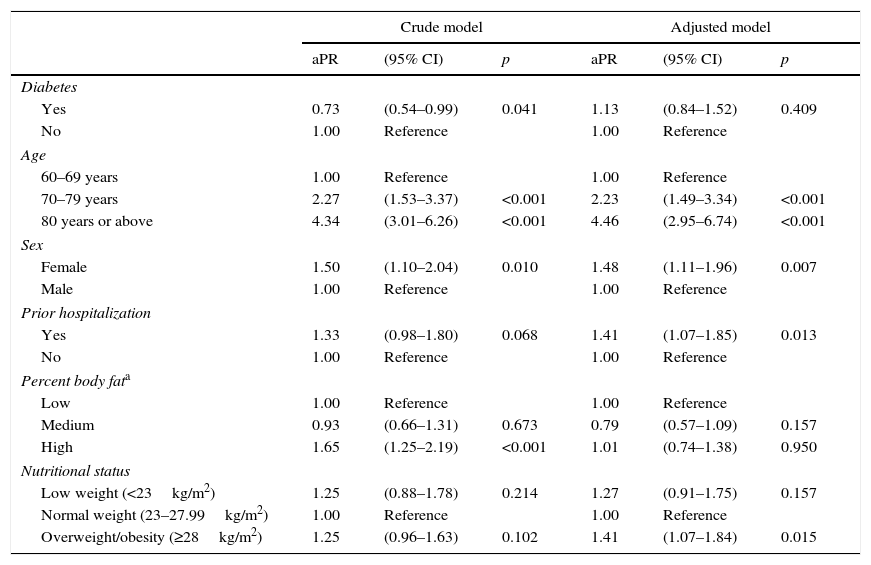
No association was found between low PP and the use of nutritional or protein supplements (Table 2). In the crude analysis, diabetes was associated with a lower probability of low PP (PR, 0.73; 95% CI, 0.54–0.99); this association was lost, however, in the adjusted analysis (aPR, 1.13; 95% CI, 0.84–1.52). Factors associated with low PP included female sex (aPR, 1.48; 95% CI, 1.11–1.96), hospitalization in the previous year (aPR, 1.41; 95% CI, 1.07–1.85), and overweight/obesity (aPR, 1.41; 95% CI, 1.07–1.84). As regards age, subjects aged 70–79 years were 2.23 (1.49–3.34) times more likely to have low PP than those aged 60–69 years, while in subjects over 80 years of age this probability doubled to 4.46 (2.95–6.74) times (Table 3).
Characteristics of elderly patients from a public hospital in Lima depending on their physical performance (n=521).
| Low physical performance (n=177) | Normal physical performance (n=344) | p | |||
|---|---|---|---|---|---|
| n | (%) | n | (%) | ||
| With diabetes | |||||
| Yes | 37 | (26.6) | 102 | (73.4) | 0.033 |
| No | 140 | (36.7) | 242 | (63.3) | |
| Sex | |||||
| Male | 37 | (25.0) | 111 | (75.0) | 0.006 |
| Female | 140 | (37.5) | 233 | (62.5) | |
| Age | |||||
| 60–69 years | 28 | (14.7) | 163 | (85.3) | <0.001 |
| 70–79 years | 67 | (33.3) | 134 | (66.7) | |
| 80 years or above | 82 | (63.6) | 47 | (36.4) | |
| Prior hospitalization | |||||
| Yes | 29 | (43.3) | 38 | (56.7) | 0.085 |
| No | 148 | (32.6) | 306 | (67.4) | |
| Use of supplements | |||||
| Yes | 18 | (45.0) | 22 | (55.0) | 0.125 |
| No | 159 | (33.1) | 322 | (66.9) | |
| Percent body fata | |||||
| Low | 51 | (28.5) | 128 | (71.5) | <0.001 |
| Medium | 45 | (26.5) | 125 | (73.5) | |
| High | 81 | (47.1) | 91 | (52.9) | |
| Nutritional status | |||||
| Low weight (<23kg/m2) | 29 | (37.2) | 49 | (62.8) | 0.212 |
| Normal weight (23–27.99kg/m2) | 66 | (29.7) | 156 | (70.3) | |
| Overweight/obesity (≥28kg/m2)b | 82 | (37.1) | 139 | (62.9) | |
| Protein consumption | |||||
| Low (≤0.8g/kg/d) | 160 | (34.1) | 309 | (65.9) | 0.917 |
| Medium (0.9–1.2g/kg/d) | 15 | (31.9) | 32 | (68.1) | |
| High (≥1.3g/kg/d) | 2 | (40.0) | 3 | (60.0) | |
| Decreased muscle strengthc | |||||
| Yes (lowest quintile) | 72 | (67.3) | 35 | (32.7) | <0.001 |
| No (upper quintiles) | 105 | (25.4) | 309 | (74.6) | |
The association between low physical performance, diabetes, and all other control variables among elderly patients from a public hospital in Lima (n=521).
| Crude model | Adjusted model | |||||
|---|---|---|---|---|---|---|
| aPR | (95% CI) | p | aPR | (95% CI) | p | |
| Diabetes | ||||||
| Yes | 0.73 | (0.54–0.99) | 0.041 | 1.13 | (0.84–1.52) | 0.409 |
| No | 1.00 | Reference | 1.00 | Reference | ||
| Age | ||||||
| 60–69 years | 1.00 | Reference | 1.00 | Reference | ||
| 70–79 years | 2.27 | (1.53–3.37) | <0.001 | 2.23 | (1.49–3.34) | <0.001 |
| 80 years or above | 4.34 | (3.01–6.26) | <0.001 | 4.46 | (2.95–6.74) | <0.001 |
| Sex | ||||||
| Female | 1.50 | (1.10–2.04) | 0.010 | 1.48 | (1.11–1.96) | 0.007 |
| Male | 1.00 | Reference | 1.00 | Reference | ||
| Prior hospitalization | ||||||
| Yes | 1.33 | (0.98–1.80) | 0.068 | 1.41 | (1.07–1.85) | 0.013 |
| No | 1.00 | Reference | 1.00 | Reference | ||
| Percent body fata | ||||||
| Low | 1.00 | Reference | 1.00 | Reference | ||
| Medium | 0.93 | (0.66–1.31) | 0.673 | 0.79 | (0.57–1.09) | 0.157 |
| High | 1.65 | (1.25–2.19) | <0.001 | 1.01 | (0.74–1.38) | 0.950 |
| Nutritional status | ||||||
| Low weight (<23kg/m2) | 1.25 | (0.88–1.78) | 0.214 | 1.27 | (0.91–1.75) | 0.157 |
| Normal weight (23–27.99kg/m2) | 1.00 | Reference | 1.00 | Reference | ||
| Overweight/obesity (≥28kg/m2) | 1.25 | (0.96–1.63) | 0.102 | 1.41 | (1.07–1.84) | 0.015 |
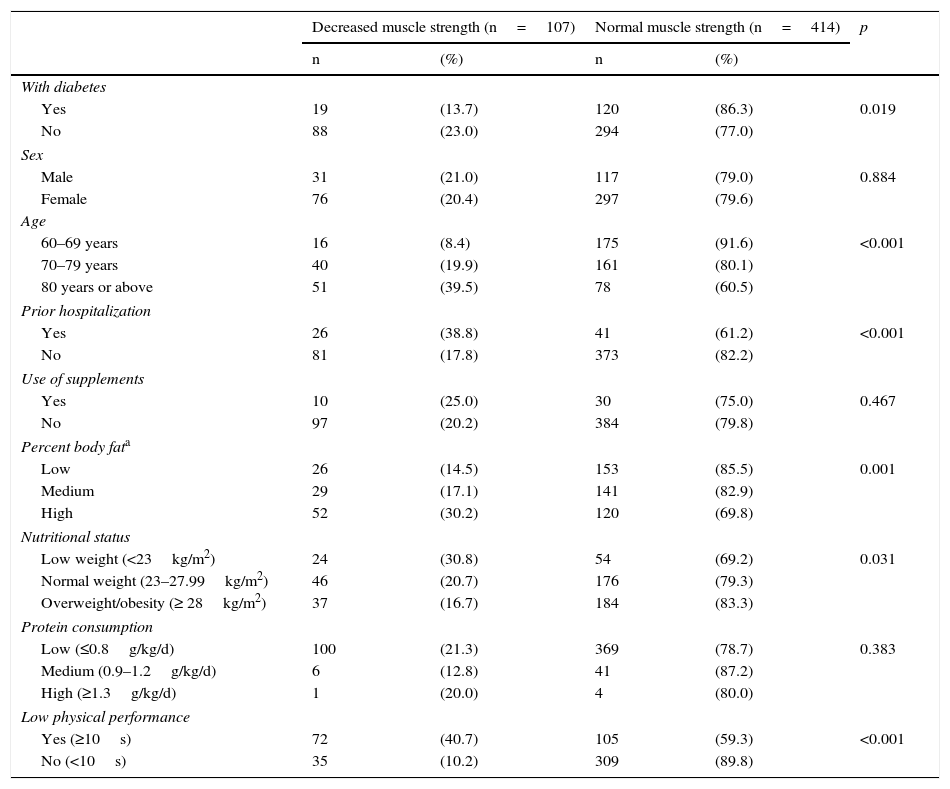
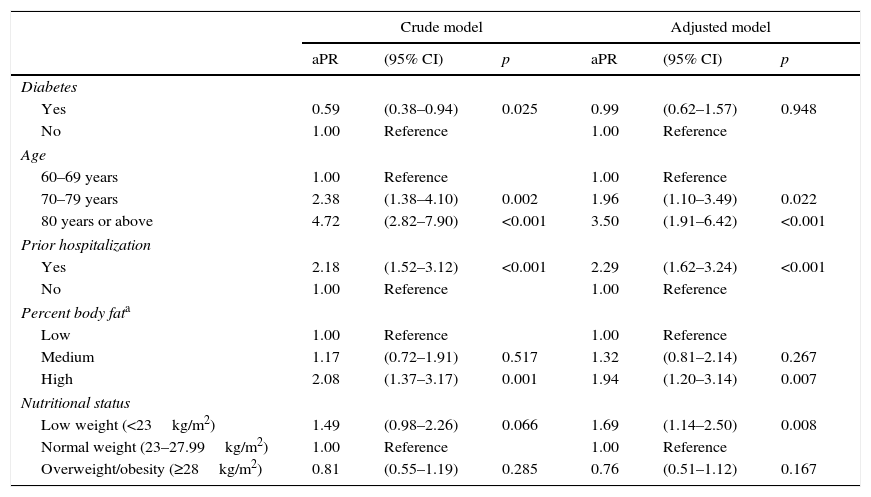
No association was found between decreased MS and sex or with the use of nutritional or protein supplements (Table 4). In the crude analysis, diabetes was associated with a lower probability of decreased MS (PR, 0.59; 95% CI, 0.38–0.94); this association was lost, however, in the adjusted analysis (aPR, 0.99; 95% CI, 0.63–1.57). Associated factors included a history of hospitalization in the previous year (aPR, 2.29; 95% CI, 1.62–3.24), a high percent body fat (aPR, 1.48; 95% CI, 1.20–3.14), and low weight (aPR, 1.69; 95% CI, 1.14–2.50). As regards age subjects aged 70–79 years were 1.96 (1.10–3.49) times more likely to have decreased MS than those aged 60–69 years, while in subjects over 80 years of age this probability doubled to 3.50 (1.91–6.42) times (Table 5).
Characteristics of elderly patients from a public hospital in Lima depending on their muscle strength (n=521).
| Decreased muscle strength (n=107) | Normal muscle strength (n=414) | p | |||
|---|---|---|---|---|---|
| n | (%) | n | (%) | ||
| With diabetes | |||||
| Yes | 19 | (13.7) | 120 | (86.3) | 0.019 |
| No | 88 | (23.0) | 294 | (77.0) | |
| Sex | |||||
| Male | 31 | (21.0) | 117 | (79.0) | 0.884 |
| Female | 76 | (20.4) | 297 | (79.6) | |
| Age | |||||
| 60–69 years | 16 | (8.4) | 175 | (91.6) | <0.001 |
| 70–79 years | 40 | (19.9) | 161 | (80.1) | |
| 80 years or above | 51 | (39.5) | 78 | (60.5) | |
| Prior hospitalization | |||||
| Yes | 26 | (38.8) | 41 | (61.2) | <0.001 |
| No | 81 | (17.8) | 373 | (82.2) | |
| Use of supplements | |||||
| Yes | 10 | (25.0) | 30 | (75.0) | 0.467 |
| No | 97 | (20.2) | 384 | (79.8) | |
| Percent body fata | |||||
| Low | 26 | (14.5) | 153 | (85.5) | 0.001 |
| Medium | 29 | (17.1) | 141 | (82.9) | |
| High | 52 | (30.2) | 120 | (69.8) | |
| Nutritional status | |||||
| Low weight (<23kg/m2) | 24 | (30.8) | 54 | (69.2) | 0.031 |
| Normal weight (23–27.99kg/m2) | 46 | (20.7) | 176 | (79.3) | |
| Overweight/obesity (≥ 28kg/m2) | 37 | (16.7) | 184 | (83.3) | |
| Protein consumption | |||||
| Low (≤0.8g/kg/d) | 100 | (21.3) | 369 | (78.7) | 0.383 |
| Medium (0.9–1.2g/kg/d) | 6 | (12.8) | 41 | (87.2) | |
| High (≥1.3g/kg/d) | 1 | (20.0) | 4 | (80.0) | |
| Low physical performance | |||||
| Yes (≥10s) | 72 | (40.7) | 105 | (59.3) | <0.001 |
| No (<10s) | 35 | (10.2) | 309 | (89.8) | |
The association between decreased muscle strength, diabetes, and the other control variables in elderly subjects from a public hospital in Lima (n=521).
| Crude model | Adjusted model | |||||
|---|---|---|---|---|---|---|
| aPR | (95% CI) | p | aPR | (95% CI) | p | |
| Diabetes | ||||||
| Yes | 0.59 | (0.38–0.94) | 0.025 | 0.99 | (0.62–1.57) | 0.948 |
| No | 1.00 | Reference | 1.00 | Reference | ||
| Age | ||||||
| 60–69 years | 1.00 | Reference | 1.00 | Reference | ||
| 70–79 years | 2.38 | (1.38–4.10) | 0.002 | 1.96 | (1.10–3.49) | 0.022 |
| 80 years or above | 4.72 | (2.82–7.90) | <0.001 | 3.50 | (1.91–6.42) | <0.001 |
| Prior hospitalization | ||||||
| Yes | 2.18 | (1.52–3.12) | <0.001 | 2.29 | (1.62–3.24) | <0.001 |
| No | 1.00 | Reference | 1.00 | Reference | ||
| Percent body fata | ||||||
| Low | 1.00 | Reference | 1.00 | Reference | ||
| Medium | 1.17 | (0.72–1.91) | 0.517 | 1.32 | (0.81–2.14) | 0.267 |
| High | 2.08 | (1.37–3.17) | 0.001 | 1.94 | (1.20–3.14) | 0.007 |
| Nutritional status | ||||||
| Low weight (<23kg/m2) | 1.49 | (0.98–2.26) | 0.066 | 1.69 | (1.14–2.50) | 0.008 |
| Normal weight (23–27.99kg/m2) | 1.00 | Reference | 1.00 | Reference | ||
| Overweight/obesity (≥28kg/m2) | 0.81 | (0.55–1.19) | 0.285 | 0.76 | (0.51–1.12) | 0.167 |
While a statistically significant association was found in the crude model between diabetes, decreased MS, and low PP, this association was lost in the adjusted model. It should be noted that this association in the crude model was negative, which suggests that diabetes acts as a factor protecting against decreased MS and low PP. However, patients in the group with diabetes were younger than those without diabetes. Thus, only seven participants with diabetes were 80 years or above, as compared to 122 patients in the group without diabetes. This crude association was due to the younger age of patients with diabetes, which was subsequently confirmed in the adjusted models. It could also have been due to differences between diabetic and non-diabetic patients in overweight/obesity, which is another factor associated with MS and PP, as discussed below.
This lack of association in the adjusted model with PP, as measured with TGUG, has previously been reported.22 Thus, in a study from the southern Netherlands, no significant association was found between the results of the TGUG test and the presence of diabetes (without polyneuropathy).22 Two tests were used in the study to measure PP, the TGUG test and the “6min-walk” test (6 MWT), and significant differences were found only in the 6 MWT between the group with diabetes (without polyneuropathy) and the group without diabetes.
It should be noted that the TGUG is the more challenging test because it does not only involve walking 6 meters at a fast pace as in the 6 MWT, but patients also have to first get up from a chair supporting their weight in the legs, walk 3m, turn around and walk back those 3m to sit again on the same chair. Thus, it is not a mobility test only, as it also tests MS in the lower limbs (a very important determinant of the mobility of patients with diabetes).
The results reported in the Netherlands study suggest that additional muscle strength loss is a relatively late event in the course of diabetic polyneuropathy and occurs at a severe stage of the disease.22 This explains why no significant difference was seen between the group of patients with diabetes (without polyneuropathy) and the group without diabetes during the TGUG test.
By contrast, another study conducted in the Netherlands did find such an association, with decreased functional capacity and lower hand grip strength being seen in the group of elderly subjects with diabetes as compared to those with normal glucose levels.6 In addition, a study in the United States found a significant association between diabetes and PP. It should be noted, however, that this study recorded the complications seen in patients with diabetes due to the disease itself and found that coronary artery disease and a high BMI explained to a great extent the greater percentage of physical disability seen in the group of patients with diabetes,21 resulting in controversy regarding the direct association between T2DM, MS, and PP.
The factors found to be associated with both low PP and decreased PP were age, a history of hospitalization, and nutritional status. In this regard, it was seen that the older the age, the greater the probability of having decreased MS and low PP. The same behavior with regard to decreased MS was found in a Colombian study where progressive impairment of hand grip strength was seen, especially after 80 years of age.9 An English study on PP conducted on women only also reported that older women (60–75 years of age) had more difficulty in standing up from a chair than younger women (aged 23–34 years) because they had less mass and MS in the lower limbs than those of the younger group.23
The explanation postulated for this relationship is that leg motion becomes slower with age due to decreased physical activity. This causes reduced activation of the leg muscles that may contribute to the reinnervation of type 2 fibers by motor neurons of type 1 fibers, so decreasing MS in the legs.23 MS also decreases in the hands with age due to several factors, including muscle mass loss or atrophy in the hands, neurological changes, or change in the contractile and coordination properties of the muscle tissue of the hands.9
It has also been found that women are more likely to have low PP than men. Similarly, a study conducted in Chile found that the prevalence of functional limitations in adults <75 years was lower in males (30.8%) and higher in females (48.9%), and the same occurred in adults >75 years (males: 46.6%, females: 82.7%).24 A Mexican study reported the same trend.25 The explanation proposed for this association is that bone mass decreases more rapidly in females than in males, which makes them more prone to fall and to develop sequelae that decrease their PP.25
A history of hospitalization increases the probability of having low PP and decreased MS. In a study in the United States, elderly subjects who developed any disability had a significantly greater prevalence of prior hospitalization or restricted physical activity than those not developing disability.26 The explanation given for this factor associated with decreased MS and low PP is that bed rest causes forced immobilization. Muscle contractions of a certain strength and minimal frequency are needed to maintain MS. This is why, in the absence of any muscle contraction during immobilization, there is a rapid decrease of muscle mass in volume, type of muscle fibers (type 2 fibers decrease, replaced by type 1 fibers) and MS, while changes occur in periarticular structure and cartilage, contributing to a trend to restricted motion and contraction. These changes occur more rapidly in the lower limbs.21,27
High percent body fat increases the probability of decreased MS. An Italian study, however, did not establish this negative relationship “per se” between percent body fat and MS.28 It was, however, found that obese subjects with sarcopenia (low muscle mass) and elevated percent fat did have decreased MS, but that this did not occur in obese subjects with no sarcopenia and high percent fat. Consequently, it was concluded that the determinant factor for MS decrease is the concomitant presence of a decreased muscle mass.28
Nutritional status was found to be another factor associated with both low PP and decreased MS. Thus, as compared to eutrophic elderly subjects, those with overweight/obesity were found to be more likely to have low PP, while those with low weight were found to be more likely to have decreased MS. The same associations were found in a Japanese study where lower BMI values were associated with lower hand grip strength and knee extension/flexion strength, and lower PP with a higher BMI.29 Other US and Italian studies support this conclusion.28,30 The explanation given in the Japanese study to this relationship is that the foot center of pressure when walking increases with weight. This suggests that people with higher BMI values are more prone to lose balance, because it is more difficult to support body weight and maintain a center of gravity in a uniform position.29
Finally, in the group of patients with diabetes, the potential association between disease duration and the outcomes “low PP” and “decreased muscle strength” was analyzed, and no relationship was found even in patients with longer disease durations. This was possibly due to the exclusion criteria for patients with diabetes, as well as to the inadequate size of the group.
On the other hand, all the associated variables are common characteristics found in elderly subjects.
The measurement of both MS and PP as predictors of the state of health of patients should, therefore, be part of a more complete integral assessment. It is also recommended that such assessments be performed at outpatient clinics for elderly patients, because all the studies reviewed concluded that decreased MS and low PP are independent indicators not only of morbidity and mortality, but also of functional capacity, and this is a crucial risk factor that determines the state of health of elderly subjects.
This study has some limitations. As this was a cross-sectional study, the effect of diabetes on the functional capacity of elderly subjects over time could not be seen. On the other hand, no agreement exists on the methods to be used for assessing PP and MS. This is why the available studies on this subject used different methods, which made it difficult to compare the results achieved. In addition, there was a marked difference of age between the groups, because the population of patients with diabetes included younger people as compared to the group without diabetes, as previously discussed. Moreover, patients with diabetes had a higher prevalence of overweight/obesity which, like age, also influences PP and MS, as is shown by our results. Thus, future prospective studies could group or control by both factors (age and overweight/obesity) to establish the relationship of DM to PP and MS.
In conclusion, no association was found between T2DM and low PP or decreased MS. An association was, however, found between low PP and female sex, a history of hospitalization, overweight/obesity, and aging. Finally, decreased MS was associated with a history of hospitalization, high percent body fat, low weight, and age (the older the age, the lower the MS).
Conflicts of interestThe authors state that they have no conflicts of interest.
Please cite this article as: Palacios-Chávez M, Dejo-Seminario C, Mayta-Tristán P. Rendimiento físico y fuerza muscular en pacientes adultos mayores con diabetes y sin diabetes de un hospital público de Lima (Perú). Endocrinol Nutr. 2016;63:220–229.
