


Criteria for the diagnosis of the metabolic syndrome are currently being reconsidered, as their usefulness is not the same for all phenotypes in relation to the risk of cardiovascular disease.
AimWe analyzed the changes in metabolic parameters after a fat overload in different groups of patients.
Materials and methodsThe study included 20 healthy persons, 30 metabolic syndrome patients without morbid obesity, 80 metabolic syndrome patients with morbid obesity and 16 patients with morbid obesity without the metabolic syndrome. All the participants received a fat overload of 60g. Measurements were made before the overload and 3h afterwards of triglycerides, free fatty acids, insulin and uric acid.
ResultsMetabolic syndrome patients with morbid obesity had a lower waist-to-hip ratio, and lower plasma free fatty acid and triglycerides levels at baseline and after the overload than patients without morbid obesity. Plasma uric acid levels rose after the fat overload in the metabolic syndrome patients who had morbid obesity but not in the patients without morbid obesity. A positive relation was found between plasma triglycerides and free fatty acid levels in all the patients but not in the controls after the fat overload. A positive relation was also found between uric acid and insulin levels in the metabolic syndrome patients with morbid obesity.
ConclusionsMetabolic syndrome patients with and without morbid obesity presented different metabolic characteristics. This suggests that there are 2 different clinical phenotypes, both grouped under the metabolic syndrome umbrella.
Se están examinando de nuevo los criterios para el diagnóstico del síndrome metabólico (SM), ya que su utilidad en lo que respecta el riesgo de enfermedad cardiovascular no es igual para todos los fenotipos.
ObjetivoAnalizar los cambios en los parámetros metabólicos después de una sobrecarga grasa en diferentes grupos de sujetos.
Materiales y métodosSe incluyeron 20 sujetos sanos sin SM, 30 sujetos con SM pero sin obesidad mórbida, 80 sujetos obesos mórbidos con SM y 16 sujetos obesos mórbidos sin SM. Todos ellos recibieron una sobrecarga oral de grasa de 60g. Se midieron en todos ellos los valores de triglicéridos, ácidos grasos libres, insulina y ácido úrico antes de la sobrecarga y 3h después.
ResultadosLos sujetos con SM y obesidad mórbida presentaron un índice de cintura/cadera inferior, y valores más reducidos de ácidos grasos libres y triglicéridos antes y después de la sobrecarga que aquellos sujetos sin obesidad mórbida. Las concentraciones de ácido úrico se elevaron después de la sobrecarga oral de grasa en los sujetos obesos mórbidos con SM, pero no en los sujetos sin obesidad mórbida. Se ha encontrado una relación positiva entre las concentraciones de triglicéridos y de ácidos grasos en todos los sujetos, pero no en los sujetos sanos sin SM después de la sobrecarga de grasa. Asimismo se obtuvo una relación positiva entre las concentraciones de ácido úrico y de insulina en los sujetos obesos mórbidos con SM.
ConclusionesLos sujetos obesos mórbidos con SM presentaron diferentes características metabólicas que aquellos sujetos con SM y sin obesidad mórbida. Esto sugiere que hay 2 fenotipos clínicos diferentes agrupados bajo el concepto de síndrome metabólico.
Criteria for the diagnosis of the metabolic syndrome (MS) are used to identify those individuals especially with an increased risk of type 2 diabetes mellitus (T2DM), and also of cardiovascular disease, thus leading to a change in lifestyle and a reduction in risk. However, it is unclear whether these criteria are valid in all clinical phenotypes associated with the MS, and there are also different classifications for MS. One of these clinical phenotypes concerns morbid obesity, which is characterized by increased growth of adipose tissue, which may influence lipid metabolism.1 A vast majority of obese subjects have an increased cardiovascular risk.2
Non-esterified fatty acids or free fatty acids (FFA) are an important metabolic fuel. Compared with glucose, FFAs have a greater energy flux through the circulation. There is a wide variation in FFA concentration and flux through the circulation, reflecting the nutritional status and physical activity of the subject. The release of FFA into the circulation is regulated by hormonal, metabolic and neuronal signals. Thus, an imbalance in these regulatory mechanisms leads to an increased plasma concentration of FFA, which is associated with a variety of chronic diseases,3 including T2DM and cardiovascular disease.4
The main route of FFA delivery into the circulation in a fasting state is the metabolic pathway, which includes hydrolysis and transport of triglycerides stored in the adipocytes by the hormone-sensitive lipase for use in other tissues, such as the liver or muscle. In the non-fasting state, though, fatty acids are also released through the lipoprotein lipase (LPL), which acts on circulating triglyceride-rich lipoproteins from the diet.5 Some authors have shown that an efficient removal of fatty acids by the adipose tissue during the postprandial period is a sign of a healthy lipoprotein profile and that impaired fatty acid trapping is associated with an atherogenic lipoprotein phenotype.6 A high availability of triglycerides and plasma fatty acids is related with insulin resistance,7 decreased insulin clearance by the liver and worsening of endothelium-dependent vasodilation.8,9
Adipose tissue has limited fatty acid storage, determined by regulators that intervene in the expansion capacity of adipose tissue, such as the peroxisome proliferator-activated receptors (PPAR).10 Our group has recently reported that the expression of PPARgamma after a fat overload in patients with the MS or morbid obesity is reduced as compared with controls.11,12 Moreover, this gene regulates certain routes involved in fatty acid and triglycerides metabolism,11,13 oxidative stress and inflammation.12 Our group has also shown that plasma levels of uric acid change after an increase in oxidative stress produced by a fat or glucose overload in the general population and in healthy persons.14,15
Obesity is considered as a risk factor for developing insulin resistance and the prevalence of the MS. Increased adipose tissue has been related to an increased production of pro-inflammatory cytokines which, together with fatty acids, appear to be responsible for the development of insulin resistance. Both fasting and post-prandial free fatty acids are increased in obese patients.16 In this study, we attempted to determine the changes in metabolic parameters after a fat overload in different groups of patients with or without the MS and with or without morbid obesity.
Materials and methodsWe selected 20 healthy persons without morbid obesity (11 male and 9 female) who had no criteria for the MS according to Adult Treatment Panel III criteria (ATP III)17 and a normal oral glucose tolerance test (control group), 30 patients (23 male and 7 female) with the MS without morbid obesity (MS group), 80 patients (24 male and 56 female) with the MS and morbid obesity (body mass index [BMI]>40) (MSMO group) and 16 patients (5 male and 11 female) with morbid obesity but without the MS (MO). Patients receiving treatment for hyperlipidemia or T2DM and those taking medications that could influence gastric emptying or the absorption time were excluded from this study. All the patients were recruited by endocrinologists. After an overnight fast, all the participants underwent a 60g fat overload with a commercial preparation (Supracal, SHS International, Liverpool, UK). Only water was permitted during the process and no physical exercise was undertaken. At 3h, measurements were made of cholesterol, triglycerides and HDL cholesterol. The commercial preparation of 125mL contains 60g fat, of which 12g is saturated, 35.25g is monounsaturated, and 12.75g is polyunsaturated. Each 100mL contains less than 1g lauric acid, less than 1g myristic acid, 4.8g palmitic acid, 1.4 stearic acid, 27.7g oleic acid, 9.6g linoleic acid, 1.4g behenic acid and 0.5g lignoceric acid. This test has been previously validated in other studies by our group.12,18–20 All the participants followed the same diet on the day prior to fat overload.
Blood samples were obtained from all subjects with a 12-h fast and after 3h of fat overload from the antecubital vein and placed in chilled vacutainer tubes (BD vacutainer™, London, UK). The serum was separated by centrifugation for 10min at 4000rpm and frozen at −80° C until analysis. All the participants gave informed consent to the study, which was approved by the Ethics Committee of Virgen de la Victoria Clinical University Hospital.
Parameters evaluatedAge (in years), weight, height (to obtain the BMI, calculated as the weight in kg divided by the height in m2), waist and hip circumferences21 (to obtain the waist-to-hip ratio [WHR], calculated as the waist circumference divided by the hip circumference) were measured in all subjects. Measurements and corresponding calculations were made in serum samples for glucose, uric acid, cholesterol, triglycerides, HDL and LDL cholesterol and free fatty acids, all measured in a Dimension autoanalyzer, Dade Behring Inc. (Deerfield, IL). Additionally, insulin levels were quantified by immunoradiometric assay supplied by BioSource S.A. (Nivelles, Belgium). Insulin resistance was calculated from the homeostasis model assessment (HOMA-IR)22 with the formula: HOMA-IR=[fasting serum insulin (μU/mL)×fasting blood glucose (mmol/L)]/22.5. After the fat overload, measurements were made for uric acid, triglycerides, free fatty acids and insulin levels.
Statistical analysisANOVA was used to study the changes produced after the fat overload, using the Bonferroni test, and analysis of the effects of the fat overload on the biological variables was done by paired sample ANOVA. Spearman correlation analyses were done to study the associations between variables. In all cases the rejection level for a null hypothesis was an α=0.05 for two tails. Calculations were performed with SPSS software (version 15.0; Statistical Package for the SPSS Iberica, Madrid, Spain).
ResultsThe percentage of subjects in each group that fulfilled the ATP III criteria is shown in Table 1. The characteristics of the four study groups are shown in Table 2. There were no significant differences in age between the four groups. However, plasma triglycerides and free fatty acid levels before and after fat overload were significantly higher in the MS group than in the other groups. Plasma uric acid levels decreased after fat overload in the controls, experienced no significant changes in the MS patients, and increased in the MSMO and MO patients. The MSMO patients had a higher rate of insulin resistance than the MS patients, MO patients and the control group.
Percentages of subjects in each group that fulfilled the ATP III criteria.
| Controls (N=20) | MO (N=16) | MSMO (N=80) | MS (N=30) | |
| Waist criteria (%) | 15.00 | 100.00 | 100.00 | 70.00 |
| Glucose criteria (%) | 10.00 | 6.25 | 53.75 | 56.66 |
| HDL cholesterol criteria (%) | 15.00 | 50.00 | 70.00 | 60.00 |
| Triglycerides criteria (%) | 10.00 | 6.25 | 52.50 | 76.66 |
| Blood pressure criteria (%) | 45.00 | 31.25 | 81.25 | 90.00 |
MS, patients with the metabolic syndrome without morbid obesity; MSMO, morbidly obese patients with the metabolic syndrome; MO, morbidly obese patients without the metabolic syndrome.
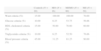
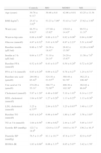
Distribution of the study variables in the four groups.
| Controls | MO | MSMO | MS | |
| Age (years) | 39.78±9.117 | 39.46±6.8 | 42.96±9.81 | 43.25±11.54 |
| BMI (kg/m2) | 25.47±3.02b | 53.23±7.09a | 53.43±7.41a | 27.62±3.56b |
| Waist (cm) | 88.55±9.913c | 137.88±15.92a | 139.83±14.43a | 99.53±11.31b |
| Waist-to-hip ratio | 0.88±0.06b | 0.88±0.11b | 0.92±0.08b | 0.94±0.06a |
| Glucose (mmol/l) | 4.87±0.32b | 5.01±0.39b | 6.97±2.23a | 5.51±0.48b |
| Baseline insulin (μIU/ml) | 9.86±3.78b | 24.36±18.41a | 26.82±15.56a | 12.26±8.86b |
| Insulin at 3h (μIU/ml) | 9.64±3.37b | 31.19±24.14a | 24.29±15.67a | 11.56±7.6b |
| Baseline FFA (mmol/l) | 0.52±0.16b | 0.43±0.15b | 0.50±0.20b | 0.72±0.28a |
| FFA at 3h (mmol/l) | 0.85±0.29b | 0.69±0.22b | 0.78±0.27b | 1.24±0.71a |
| Baseline uric acid (μmol/l) | 284.90±65.42b | 324.16±53.53a,b | 360.44±92.78a | 362.23±106.46a |
| Uric acid at 3h (μmol/l) | 274.20±55.31c | 368.77±72.56a,b | 400.30±102.30a | 362.82±86.84b |
| Cholesterol (mmol/l) | 5.97±1.20a | 4.46±0.90c | 5.10±1.03b | 6.14±1.23a |
| HDL cholesterol (mmol/l) | 1.64±0.36a | 1.27±0.28b | 1.13±0.25b | 1.13±0.36b |
| LDL cholesterol (mmol/l) | 3.25±0.77a,b | 2.84±0.51b | 3.25±0.93a,b | 3.49±1.15a |
| Baseline TG (mmol/l) | 0.83±0.24b | 0.98±0.44b | 1.80±1.48b | 3.76±3.05a |
| TG at 3h (mmol/l) | 1.64±0.56b | 1.90±0.62b | 2.44±1.25b | 5.05±3.51a |
| Systolic BP (mmHg) | 122.7±18.9b | 124.9±13.5b | 144.0±10.7a | 136.2±16.3a |
| Diastolic BP (mmHg) | 76.5±11.9b | 81.1±10.7a | 87.6±13.7a | 82.9±9.0a |
| HOMA-IR | 1.63±0.68d | 6.06±3.37b | 8.05±5.07a | 3.42±1.70c |
Different letters indicate significant differences between the means of the different groups of patients (P<0.05). Results are adjusted by sex. MS: patients with the metabolic syndrome without morbid obesity. MSMO, morbidly obese patients with the metabolic syndrome; MO, morbidly obese patients without the metabolic syndrome; TG, triglycerides; FFA, free fatty acids; BMI, body mass index; BP, blood pressure; HOMA-IR, homeostasis model assessment. Comparisons between groups were performed by ANOVA.
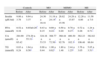
Correlation analysis showed a direct positive correlation between plasma triglycerides and free fatty acid levels before and after fat overload in all the MS patients, with or without morbid obesity (MOMS: r=0.37, r=0.44 for triglycerides vs. FFA before and after fat overload, respectively; and MS: r=0.64, r=0.94 for triglycerides vs. FFA before and after fat overload, respectively; P<0.05): this correlation was not seen in the controls or MO patients (Fig. 1a and b). A direct positive correlation was also found between plasma triglycerides levels at baseline and after fat overload and the baseline insulin levels in the MSMO patients (r=0.52, r=0.52, respectively), but not in the other groups (Fig. 2).
 Correlation between levels of triglyceridess and free fatty acids in patients with MS without morbid obesity and (b) correlation between levels of triglyceridess and free fatty acids in MS patients with morbid obesity.")

The uric acid levels correlated directly with baseline plasma insulin levels both before and after fat overload (r=0.38, r=0.37, respectively; P<0.05). The plasma uric acid levels correlated with the HOMA-IR in the MSMO patients before and after the fat overload (r=0.43, r=0.41, respectively; P<0.05) (Fig. 3), but not in the other groups (data not shown).

Analysis of variance for paired samples showed intra-group changes after the fat overload, with an increase in plasma triglycerides levels in all four groups, though this was higher in the MS patients than in the MSMO or MO patients and the controls (Table 3). Plasma FFA levels rose significantly in all four groups of patients. The MS group had the highest FFA levels, both at baseline and after the overload.
Effects of fat overload in the four study groups: intragroup comparison of means before and after fat overload.
| Controls | MO | MSMO | MS | |||||
| Before | After | Before | After | Before | After | Before | After | |
| Insulin (μIU/ml) | 9.86±3.78 | 9.64±3.37 | 24.36±18.41 | 31.19±24.14* | 26.82±15.56 | 24.29±15.67 | 12.26±8.86 | 11.56±7.6 |
| FFA (mmol/l) | 0.52±0.16 | 0.85±0.29* | 0.43±0.15 | 0.69±0.22* | 0.50±0.20 | 0.78±0.27* | 0.72±0.28 | 1.24±0.71* |
| UA (μmol/l) | 284.90±65.42 | 274.20±55.31* | 324.16±53.53 | 368.77±72.56* | 360.44±92.76 | 400.30±102.3* | 362.23±106.46 | 362.82±86.84 |
| TG (mmol/l) | 0.83±0.24 | 1.64±0.56* | 0.98±0.44 | 1.90±0.62* | 1.80±1.48 | 2.44±1.25* | 3.76±3.05 | 5.05±3.51* |
Plasma uric acid levels rose significantly after the fat overload in the MSMO and MO patients, decreased in the controls, and showed no changes in the MS patients (Table 3).
DiscussionOur main finding is that MSMO and MO subjects had a better lipid profile than MS patients without morbid obesity, and that this profile was more similar to control subjects than to the MS patients themselves. The MSMO and MO also had a different response to the fat overload and, therefore, a different metabolic capacity comparing with the MS patients. This study shows the heterogeneous nature of the classification of the MS, which includes subjects with very different phenotypes. No differences were seen in FFA levels before or after fat overload between the MSMO and MO patients and the controls, even though these patients had greater insulin resistance than the MS patients. We also noticed that uric acid metabolism was different in these groups and that this difference could be explained by plasma insulin levels, due to the influence of insulin on renal tubules and uric acid metabolism.
The ATP III criteria for defining the MS represent an effort to understand the importance of the action of insulin and its impact on cardiovascular disease.17 The criteria for diagnosing the MS in subjects are abdominal obesity, impaired fasting glucose, high fasting triglycerides levels, low fasting HDL cholesterol levels and high blood pressure. The main objective of these criteria is to diagnose the MS and to identify those individuals especially with an increased risk of T2DM, and also with an increased risk for cardiovascular disease, and thus to change their lifestyle and decrease their risk. These criteria were selected because they are more frequently found in persons with insulin resistance23 and have been associated with an increase in cardiovascular disease.24 It is well known that an increased insulin resistance is closely associated with the presence of MS. In our study, both in morbidly obese and non-obese subjects, those with MS have higher HOMA-IR levels than those subjects without MS. However, the criteria for the MS are not the result of a prospective study and do not represent the outcome of an evidence-based process, but rather the reflections of an expert panel and what was proposed by NCEP-ATPIII. Thus, not only are the cut points for the five criteria chosen arbitrarily, but also there are no reasons to believe that individual elements of the MS reflect equally the presumed basic defects or the risk of cardiovascular disease. In fact, it is unclear what led to the decision to select five criteria, nor why satisfying any three of the five is more useful clinically than the other two. In light of these considerations, there is ample reason to question the clinical usefulness of making a negative or positive diagnosis of the syndrome.25
An important component of the MS is dyslipidemia, which consists of high levels of plasma triglycerides and low levels of HDL cholesterol. These are closely linked to insulin resistance and cardiovascular risk. In fact, differences in plasma triglycerides levels account for approximately 36% of the variation in insulin-mediated glucose. Total cholesterol level is affected by the amount of different lipoproteins. A decrease in HDL synthesis is observed when the insulin resistance is increased. This is confirmed by our data showing a decrease in HDL in the three groups with high HOMA-IR. Among other factors, lipoprotein lipase, hepatic lipase, lecithin:cholesterol acyltransferase and cholesteryl ester transfer protein may play an important role in the HDL reduction in insulin resistance.26 In the groups with high insulin resistance, especially in the groups with metabolic syndrome (MSMO and MS), there is an increase in the level of VLDL-associated triglycerides, probably due to an increase in synthesis and a decrease in lipoprotein lipase activity. Furthermore, there is an increase in the level of LDL in MS and MSMO groups, probably due to increasing its precursor lipoprotein (VLDL). All these changes in lipoprotein levels can produce that total cholesterol is decreased in morbidly obese groups.
Glucose values vary widely in apparently healthy persons, with at least a six-fold variation between the most insulin sensitive and most insulin resistant of these subjects.27 In fact, it has even been suggested that one-third of the apparently healthy population is sufficiently insulin resistant to develop clinical disease or associated complications.28,29 However, it should be noted that insulin resistance is not a disease but rather a physiologic state that can lead to the development of associated clinical syndromes. Nevertheless, the presence of insulin resistance does not necessarily lead to these syndromes, which can develop in the absence of insulin resistance. Insulin resistance, though, can be considered a conceptual framework within which to place unrelated biological events in a pathophysiological construct.25
In our results, we saw that although the MSMO patients had greater insulin resistance, their lipid profile (FFA and triglycerides levels) was similar to that of the controls, which means that not all individuals with insulin resistance necessarily develop lipid metabolism disorders, as has been considered in the literature.
Another component of the MS that is not included among the definition criteria is postprandial hyperlipidemia. Our group has reported that greater postprandial hyperlipidemia is independently associated with other components of the MS.19 Also, the increase of insulin resistance can lead to an increased insulin secretion to compensate for the fat overload effects. This happens in the MO group, in which there is a significant increase of insulin after fat overload. However, in the two groups with metabolic syndrome (MSMO and MS), this increase does not occur, despite having high insulin resistance. This may be due to failure of β-cell function, which worsens in direct proportion with number of criteria of metabolic syndrome.30
We are currently witnessing a deconstruction of the MS.25 The original constructions of the criteria are beginning to crumble and are being questioned. Proof of this is that new tools to define partial syndromes are being described, such as the basic MS with obesity, increased triglycerides and low HDL; and the hypertriglyceridemic waist.31–33
Our data show that obese patients with or without the MS have higher levels of insulin resistance, but a lower postprandial lipidemia and better metabolism of fatty acids and triglycerides than MS patients without morbid obesity, and very similar to controls. Thus, a possible differential characteristic may be that patients with morbid obesity have a greater capacity for fat storage than MS patients without morbid obesity, and can withdraw or clarify fatty acids from the blood. Moreover, the MSMO group has FFA levels similar to the control and MO groups, suggesting that MSMO patients have a similar capacity to remove the FFA from circulation.34 Some authors have related this fat storage capacity and the fatty acids composition with beta cell function.35,36 However, the high insulin resistance of MSMO group produces an increase, although not significant, in production and secretion of VLDL-associated triglycerides, as in the MS group.34
We therefore believe that the diagnostic criteria for the MS should be reconsidered in cases of extreme obesity. Patients with morbid obesity always fulfill the waist criteria, although, as we demonstrated in our study, these patients have a lower waist-to-hip ratio than MS patients without morbid obesity. Then they just have to fulfill two criteria from the remaining four, mainly HDL and blood pressure. However, in the MS group, there are a lower percentage of subjects who fulfill the waist criteria. Then, in this group more subjects must fulfill 3 of the 4 remaining criteria to be classified as MS, mainly triglycerides and blood pressure. We suggest that this can increase the mean of triglycerides, as is showed in the MS group. However, the percentage of subjects that fulfill the HDL criteria is almost similar in MO, MSMO and MS groups. This can infer that the MS group shows a worse lipid profile that MO and MSMO groups.
Another component of the MS that has received little attention is the uric acid level. We have shown that plasma uric acid levels can act as a circulating antioxidant in healthy persons,14 and that these levels fall after glucose overload in a control population,15 the fall being associated with triglycerides levels and insulin resistance. The data here show that plasma uric acid levels behave differently depending on the phenotype. There is a significant decrease after fat overload in controls, hardly any variation in MS patients without morbid obesity, and a significant increase in MSMO and MO patients, as we also have shown in a previous study.20 This may be partly explained by the insulin levels, as high levels result in renal tubular reabsorption of sodium and uric acid, causing an increase in plasma uric acid levels. Moreover, the reduction in uric acid in controls supports our idea, shown in other studies, in which uric acid acts as an antioxidant in controls as a response to increased oxidative stress after fat overload,14 but does not act as an antioxidant in patients with MS because the system is saturated. It seems that significant increase in uric acid after a fat overload in morbidly obese patients could be also associated to oxidative stress.20 The alteration of the antioxidant mechanisms in obesity has been shown in both humans and in experimental animal models.20,37,38 In obesity the organism is unable to provide adequate levels of antioxidants to compensate for the production of free radicals.37 This increase in uric acid in morbidly obesity could counteract the possible increase in the oxidizing molecules and the decreased in the antioxidant systems.20
Here, we describe for the first time the behavior of free fatty acids after a fat overload in MSMO, MO, MS patients without morbid obesity, and control subjects, noting a different management of the lipids after a fat overload depending on the phenotype. We also found that uric acid levels increased significantly in the MSMO and MO patients, decreased in controls, and remained unchanged in the MS patients, thus demonstrating the different behavior of uric acid according to the phenotype and insulin levels. These data lead us to conclude that the diagnostic criteria for MS in patients with morbid obesity need to be redefined for better risk assessment in these patients. Patients with the MS and morbid obesity have different features from patients with the MS without morbid obesity, primarily in terms of lipid metabolism and plasma uric acid levels, suggesting that they are very different clinical phenotypes under the same umbrella of the MS.
ContributionsFrancisco J. Tinahones and Lourdes Garrido-Sánchez have contributed equally.
Eduardo García-Fuentes and Fernando Cardona have contributed equally.
Conflict of interest statementNone declared.
The authors wish to thank all the subjects for their collaboration, and IBIMA. We also gratefully acknowledge the help of Ian Johnstone for his expertise in preparing this manuscript. This work was supported in part by a grant from the Instituto de Salud Carlos III (CP07/0095, CP04/0133, PI08/1655), MCYT (SAF 2006/12894) and Servicio Andaluz de Salud (0438/2006, 0255/2007 and PI0325/08). L. Garrido-Sanchez is supported by a fellowship from the Programa Juan de la Cierva (JCI-2009-04086). E. Garcia-Fuentes is supported by the Research Stabilization Program of the Instituto de Salud Carlos III (ISCIII). CIBER Fisiopatología de la Obesidad y Nutrición (CIBEROBN) and CIBER de Diabetes y Enfermedades Metabólicas Asociadas (CIBERDEM) are ISCIII projects.