


To describe the relationship between metalloproteinase (MMP) 2, MMP-9, and leptin in drivers of public service vehicles with metabolic syndrome in the city of Armenia (Quindio, Colombia).
MethodsLeptin was measured using Millipore ELISA kits. MMP-2 and MMP-9 were measured with ELISA kits from R&D Systems.
ResultsFifty-seven male drivers with metabolic syndrome with a mean age of 45.35years, BMI of 29.81, and an abdominal circumference of 105.75cm were identified. Blood pressure values were 126.5/82.5mmHg. Leptin, MMP-2, and MMP-9 levels were 24.6ng/mL, 28.1ng/mL, and 7.5ng/mL respectively.
The relationship between leptin and waist circumference was statistically significant (p<0.001). The explained variation (R2) in waist circumference, is explained in an 80.12% for the study variables, has a statistically significant association with BMI (p<0.001), MMP-2 (p=0.01), age (p=0.01), SBP (p<0.001) and DBP (p<0.001). The R2 of leptin, is explained in a 69.56% for the study variables, has a statistically significant association with BMI (p<0.001), MMP-2 (p=0.05) and triglycerides (p=0.02). The R2 of MMP-2, explained in 41.82% of the study variables and has a statistically significant association with waist circumference (p=0.01), glucose (p=0.01) and age (p=0.03).
ConclusionsStatistically significant associations were found between waist circumference and MMP-2; leptin and MMP-2, and MMP-2 and waist circumference and blood glucose.
Describir la relación entre la metaloproteinasa (MMP) 2, la MMP-9 y la leptina en conductores de vehículo de servicio público con síndrome metabólico en la ciudad de Armenia, Quindío.
MétodosLa leptina se midió con la técnica de ELISA de laboratorio Millipore y las metaloproteinasas con la técnica de ELISA de R&D Systems.
ResultadosSe identificaron 57 conductores con síndrome metabólico, sexo masculino, con edad promedio de 45,35años, IMC de 29,81 y un perímetro abdominal de 105,75cm. La presión arterial (PA) fue de 126,5/82,5mmHg. La leptina se encontró en 24,6ng/ml; la MMP-2 en 28,1ng/ml y la MMP-9 en 7,5ng/ml.
La relación entre la leptina y el perímetro abdominal fue estadísticamente significativa (p<0,001). La variación explicada (R2) del perímetro abdominal se explica en un 80,12% por las variables del estudio y tiene una relación estadísticamente significativa con el IMC (p<0,001), la MMP-2 (p=0,01), la edad (p=0,01), la PAS (p<0,001) y la PAD (p<0,001). La R2 de la leptina se explica en un 69,56% por las variables del estudio y tiene una relación estadísticamente significativa con el IMC (p<0,001), la MMP-2 (p=0,05) y los triglicéridos (p=0,02). La R2 de la MMP-2 se explica en un 41,82% por las variables del estudio y tiene una relación estadísticamente significativa con el perímetro abdominal (p=0,01), la glucemia (p=0,01) y la edad (p=0,03).
ConclusionesSe encontraron relaciones estadísticamente significativas entre el perímetro abdominal con la MMP-2; de la leptina con la MMP-2, y de la MMP-2 con el perímetro abdominal y la glucemia.
Metabolic syndrome (MS) is a condition of multifactorial origin characterized by the presence of changes such as insulin resistance, hyperinsulinism, obesity, impaired glucose metabolism, high blood pressure (HBP), and dyslipidemia1,2 involving a high cardiovascular risk and representing an increasing public health problem.
The diagnostic criteria for MS are based on clinical and laboratory variables and vary depending on the various medical bodies.3 Although the Adult Treatment Panel III (ATP-III) of the National Cholesterol Education Program defined MS4 in 2001, other international organizations such as the American Heart Association/National Heart, Lung, and Blood Institute (AHA/NHLBI), and the International Diabetes Federation (IDF) European Group for the Study of Insulin Resistance (EGIR) have also issued definitions. The Colombian consensus on endocrinology5 assimilates Colombians to South Asian populations, and for the purposes of this study, the criteria established by the Latin American Diabetes Association (ALAD) were used. These criteria include increased waist circumference plus two of the following: high triglyceride levels (TG≥150mg/dL or on specific lipid-lowering treatment), low HDL cholesterol (HDL-C<40mg/dL in males and <50mg/dL in females or current treatment for low HDL-C), high fasting blood glucose (fasting blood glucose >100mg/dL or oral carbohydrate intolerance or diagnosed diabetes mellitus) and high blood pressure (BP≥130/85mmHg or treatment for HBP). Waist circumference is considered to be increased if greater than 94 in males and 88 in females.6
MS components result from changes induced by impaired metabolism triggered by obesity, oxidative stress, and chronic inflammation. HBP, dyslipidemia, and glucose intolerance result from the initial damage caused by obesity. Multiple studies support the idea of a morbid process induced by a chronic oxidative and proinflammatory status.7
The current theoretical model of obesity includes an inflammatory process such as the initial process triggering the metabolic and vascular changes of MS. Lipid accumulation promoted by a high anabolic rate induces an inflammatory process resulting from biomolecular activation of proinflammatory substances produced by oxidative stress derived from dysregulated fatty acid and TG metabolism. Oxidative stress is promoted by proatherogenic substances that increase the expression of proinflammatory cytokines and adhesion molecules induced and secreted by adipocytes and tissue leukocytes. Angiotensin II, leptin, and other molecules promote the occurrence of a chronic oxidative and proinflammatory environment. In addition, decreases in protective substances increase the deviation of metabolic imbalance toward atherogenesis, luminal thrombosis, and hypertension. The result of generalized inflammation is the production of a number of cytokines that induce peripheral resistance to insulin action. Inflammation also promotes the synthesis of metalloproteinases that degrade the extracellular matrix of adipose tissue and directly and indirectly promote adipocyte hypertrophy and hyperplasia, amplifying the chronic oxidative and inflammatory process. Adiponectin expression is downregulated, decreasing serum adiponectin levels. Finally, oxidative stress maximizes the generation of resistin, a protein involved in insulin resistance, and the positive feedback of chronic inflammation.8,9
Other disorders associated with MS include increases in levels of apoB y apoCIII, prothrombotic factors (fibrinogen), serum viscosity, asymmetric dimethylarginine, homocysteine, leukocyte count, and proinflammatory cytokines and C-reactive protein. Non-alcoholic fatty liver disease is relatively common and coexists with non-alcoholic steatohepatitis, including not only triglyceride (TG) accumulation, but also inflammation.9,10 Polycystic ovary syndrome is often associated with MS.9,11 Hyperuricemia occurring in MS results from defects in insulin action for uric action reabsorption by renal tubules, and microalbuminuria also appears to be caused by changes in endothelial physiology in a state of insulin resistance.9,12 A disorder often associated with obesity, HBP, and insulin resistance, and thus with MS, is obstructive sleep apnea.9
The significance of leptin from the pathophysiological viewpoint is recognized,8 as is the influence of matrix metalloproteinases (MMPs), which remodel the extracellular matrix,13 especially MMP-2, an enzyme that may be secreted by adipocytes and is increased in obesity.14
Public service vehicle drivers are a population with a susceptibility to MS15 because their lifestyle includes various risk factors that favor its occurrence: long work shifts spent sitting, a sedentary life, smoking, alcohol consumption, and dietary habits including high carbohydrate and lipid consumption, in addition to stress and altered sleep-wake periods.16
In Armenia (Quindío, Colombia) there are 1,716 taxis, the drivers of which work day and night shifts. These drivers are usually male and are exposed to many risks that may endanger their health, such as noise, vibration, traffic accidents, a sedentary lifestyle as they spend all day sitting in their cabs, obesity, alcohol consumption and smoking, in addition to poor dietary habits because many of them eat food with a high saturated fat, sugar, and salt content. This explains why our study was conducted in this population.
This study was intended to describe the relationship between MMP-2, MMP-9, and leptin in public service vehicle drivers with MS in the city of Armenia, Quindío.
Subjects and methodsA relational, cross-sectional study was conducted during the first six months of 2014. Sample size was estimated for a finite population using the following formula:

A sample of 196 male drivers was estimated. Two hundred drivers who agreed to participate were randomly selected from the database. Of these, 125 signed the informed consent and 8 withdrew, leaving 117 drivers, of whom 60 did not meet the MS criteria, while 57 drivers met the MS criteria. These 57 drivers were the sample used in this study (Fig. 1).The study was approved by the ethics committee of Universidad del Quindío.
 for the diagnosis of metabolic syndrome, while 57 drivers met the criteria. These 57 subjects were the sample of this study.")
Flow of study participants. A sample of 196 male drivers was estimated. Two hundred drivers who agreed to participate were randomly selected from the database. Of these, 125 signed the informed consent form and 8 withdrew, leaving 117 drivers, of whom 60 did not meet the criteria of the Latin American Diabetes Association (ALAD) for the diagnosis of metabolic syndrome, while 57 drivers met the criteria. These 57 subjects were the sample of this study.
Blood pressure (BP) and waist circumference were measured as recommended by the Colombian Ministry of Health. Blood glucose and lipid profile were measured using standard laboratory methods. Leptin was measured using Millipore ELISA kits. MMP-2 and MMP-9 were measured with the ELISA procedure of R&D Systems.
The condition of all participants was described, and drivers with and without MS were identified based on the listed criteria. A descriptive analysis of the data was performed, and mean and standard deviation were calculated. Linear and multiple regression models were adjusted to analyze the relations of variables between those who had MS. Statgraphics Centurion 15 software was used for statistical processing.
ResultsGeneral characteristics of the sampleAll 117 public service vehicle drivers participating in the study were males with a mean age of 45.8 years, a body mass index (BMI) of 28kg/m2, and a waist circumference of 100cm. Mean blood pressure (MBP) was 125.7/82.1mmHg. Fasting blood glucose levels were normal, with a mean value of 85.1mg/dL. The mean total cholesterol level was 198mg/dL, the mean TG level was 207.5mg/dL, and the mean HDL-C level was 33.1mg/dL. The criterion most commonly found was low HDL-C (less than 40mg/dL), which occurred in 90.25% of drivers (102).
Taxi drivers accounted for 68.51% of the participants, while the remaining 31.48% of the participants drove buses. A majority of drivers (55.56%) worked both during the day and at night.
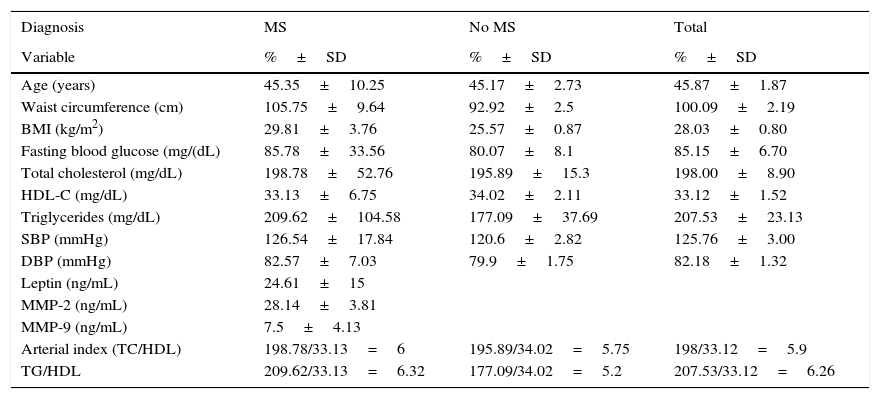
Fifty-seven drivers, i.e. 48.71% of the population, had MS (increased waist circumference plus two criteria recognized by ALAD).Table 1 shows the general characteristics of the sample with and without MS.
General characteristics of the sample of public service vehicle drivers with and without metabolic syndrome.
| Diagnosis | MS | No MS | Total |
|---|---|---|---|
| Variable | %±SD | %±SD | %±SD |
| Age (years) | 45.35±10.25 | 45.17±2.73 | 45.87±1.87 |
| Waist circumference (cm) | 105.75±9.64 | 92.92±2.5 | 100.09±2.19 |
| BMI (kg/m2) | 29.81±3.76 | 25.57±0.87 | 28.03±0.80 |
| Fasting blood glucose (mg/(dL) | 85.78±33.56 | 80.07±8.1 | 85.15±6.70 |
| Total cholesterol (mg/dL) | 198.78±52.76 | 195.89±15.3 | 198.00±8.90 |
| HDL-C (mg/dL) | 33.13±6.75 | 34.02±2.11 | 33.12±1.52 |
| Triglycerides (mg/dL) | 209.62±104.58 | 177.09±37.69 | 207.53±23.13 |
| SBP (mmHg) | 126.54±17.84 | 120.6±2.82 | 125.76±3.00 |
| DBP (mmHg) | 82.57±7.03 | 79.9±1.75 | 82.18±1.32 |
| Leptin (ng/mL) | 24.61±15 | ||
| MMP-2 (ng/mL) | 28.14±3.81 | ||
| MMP-9 (ng/mL) | 7.5±4.13 | ||
| Arterial index (TC/HDL) | 198.78/33.13=6 | 195.89/34.02=5.75 | 198/33.12=5.9 |
| TG/HDL | 209.62/33.13=6.32 | 177.09/34.02=5.2 | 207.53/33.12=6.26 |
Drivers with MS were male with a mean age of 45.35 years, a mean BMI of 29.81, and a mean waist circumference of 105.75cm. MBP was 126.5/82.5mmHg.
The mean total cholesterol level was 198.8mg/dL, the mean TG level was 209.6mg/dL, and mean HDL-C was below the normal limits (33.13mg/dL). Total/HDL cholesterol and TG/HDL ratios were elevated at 6 and 6.32 respectively. The mean blood glucose level was 85.8mg/dL.
The mean leptin level was 24.6ng/mL, above the normal values (2.0–5.6ng/mL in males); mean MMP-2 and MMP-9 levels were 28.1 and 7.5 respectively.
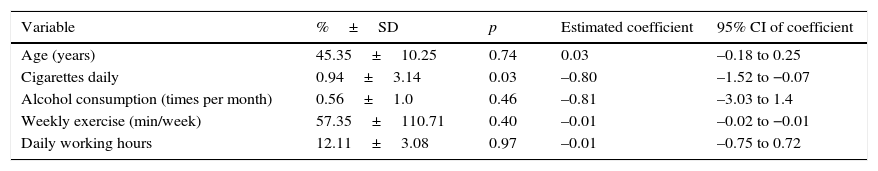
Table 2 shows the risk factors for drivers with MS. Based on the evidence,5,6 the following were identified: drivers worked 12.11h daily on average. Fourteen percent (8 subjects) smoked less than one cigarette daily (0.94 on average), while 86% did not smoke. Alcohol consumption was reported by 31.57% (18 drivers), who drank less than one standard drink per month (0.56 on average). A statistically significant relationship was found between waist circumference and smoking (p=0.03).
Risk factors in the lifestyle of drivers with metabolic syndrome.
| Variable | %±SD | p | Estimated coefficient | 95% CI of coefficient |
|---|---|---|---|---|
| Age (years) | 45.35±10.25 | 0.74 | 0.03 | –0.18 to 0.25 |
| Cigarettes daily | 0.94±3.14 | 0.03 | –0.80 | –1.52 to −0.07 |
| Alcohol consumption (times per month) | 0.56±1.0 | 0.46 | –0.81 | –3.03 to 1.4 |
| Weekly exercise (min/week) | 57.35±110.71 | 0.40 | –0.01 | –0.02 to −0.01 |
| Daily working hours | 12.11±3.08 | 0.97 | –0.01 | –0.75 to 0.72 |
The dependent variable was waist circumference, which had an explained variation (R2) of 9.05%. The adjustment variable in the model was working time.
As regards exercise as a protective factor, 63.79% reported that they practiced no exercise, while 36.21% performed some physical exercise. The mean exercise time was 57.35min per week.
Relations between the different study variablesIn this study, the linear relationship of leptin to waist circumference was statistically significant (p<0.001), with an explained variation (R2) of 43.66%.
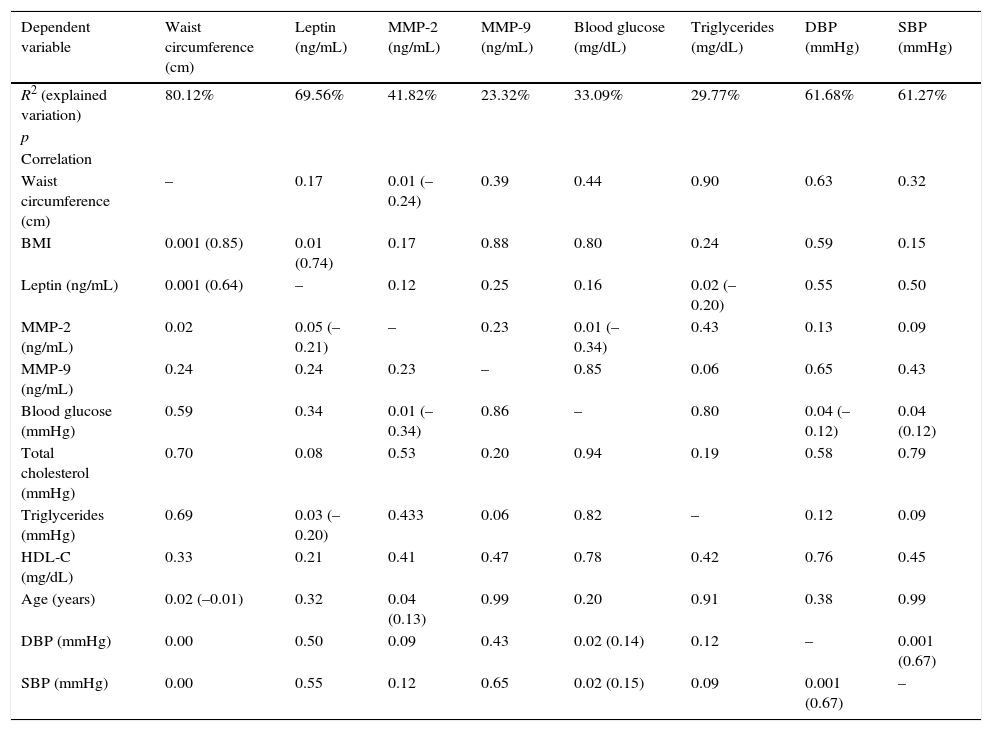
Multiple regression was performed between the study variables, identifying R2, whose results are shown in Table 3.
Relationships between variables in drivers with metabolic syndrome.
| Dependent variable | Waist circumference (cm) | Leptin (ng/mL) | MMP-2 (ng/mL) | MMP-9 (ng/mL) | Blood glucose (mg/dL) | Triglycerides (mg/dL) | DBP (mmHg) | SBP (mmHg) |
|---|---|---|---|---|---|---|---|---|
| R2 (explained variation) | 80.12% | 69.56% | 41.82% | 23.32% | 33.09% | 29.77% | 61.68% | 61.27% |
| p | ||||||||
| Correlation | ||||||||
| Waist circumference (cm) | – | 0.17 | 0.01 (–0.24) | 0.39 | 0.44 | 0.90 | 0.63 | 0.32 |
| BMI | 0.001 (0.85) | 0.01 (0.74) | 0.17 | 0.88 | 0.80 | 0.24 | 0.59 | 0.15 |
| Leptin (ng/mL) | 0.001 (0.64) | – | 0.12 | 0.25 | 0.16 | 0.02 (–0.20) | 0.55 | 0.50 |
| MMP-2 (ng/mL) | 0.02 | 0.05 (–0.21) | – | 0.23 | 0.01 (–0.34) | 0.43 | 0.13 | 0.09 |
| MMP-9 (ng/mL) | 0.24 | 0.24 | 0.23 | – | 0.85 | 0.06 | 0.65 | 0.43 |
| Blood glucose (mmHg) | 0.59 | 0.34 | 0.01 (–0.34) | 0.86 | – | 0.80 | 0.04 (–0.12) | 0.04 (0.12) |
| Total cholesterol (mmHg) | 0.70 | 0.08 | 0.53 | 0.20 | 0.94 | 0.19 | 0.58 | 0.79 |
| Triglycerides (mmHg) | 0.69 | 0.03 (–0.20) | 0.433 | 0.06 | 0.82 | – | 0.12 | 0.09 |
| HDL-C (mg/dL) | 0.33 | 0.21 | 0.41 | 0.47 | 0.78 | 0.42 | 0.76 | 0.45 |
| Age (years) | 0.02 (–0.01) | 0.32 | 0.04 (0.13) | 0.99 | 0.20 | 0.91 | 0.38 | 0.99 |
| DBP (mmHg) | 0.00 | 0.50 | 0.09 | 0.43 | 0.02 (0.14) | 0.12 | – | 0.001 (0.67) |
| SBP (mmHg) | 0.00 | 0.55 | 0.12 | 0.65 | 0.02 (0.15) | 0.09 | 0.001 (0.67) | – |
MMP: metalloproteinase. In associated variables, Pearson's correlation coefficient is provided below the p value.
Study variables explained 80.12% of the R2 of waist circumference, which had a statistically significant relationship with BMI (p<0.001), MMP-2 (p=0.01), age (p=0.01), systolic BP (SBP) (p<0.001), and diastolic BP (SBP) (p<0.001).
Study variables explained 69.56% of leptin variation (R2), which had a statistically significant relationship with the BMI (p<0.001), MMP-2 (p=0.05), and TG (p=0.02).
Study variables explained 41.82% of the R2 of MMP-2, which had a statistically significant relationship with waist circumference (p=0.01), blood glucose (p=0.01), and age (p=0.03).
Study variables explained 33.09% of the R2 of blood glucose, which had a statistically significant relationship with MMP-2 (p=0.03), SBP (p=0.02), and DBP (p=0.01).
Study variables explained 29.77% of the R2 of TG, which had a statistically significant relationship with leptin (p=0.02).
Study variables explained 61.68% of the R2 of SBP, which had a statistically significant relationship with DBP (p<0.001).
Study variables explained 61.27% of the R2 of DBP, which had a statistically significant relationship with blood glucose (p=0.02) and SBP (p<0.001).Fig. 2, showing the relations between variables, is based on the information provided in Table 3.
Discussion
A comparison of the prevalence of MS in drivers from Armenia (48.71%) with, for example, its occurrence in a working population in Spain (10.2% according to the MESYAS study),17 shows the high prevalence of this condition in public service vehicle drivers in that city.
MS definition implies a remodeling process of extracellular matrix that is expressed as increased waist circumference. In Colombia, 24.6% of males and 44.6% of females had abdominal obesity.18
Leptin levels higher than normal were found (2.0–5.6ng/mL in males). Since leptin was discovered in 1994, various studies have reported a relationship between leptin, obesity, and waist circumference.19 In this study, the relationship of leptin with waist circumference was statistically significant.
Leptin is increased in obesity and promotes a chronic oxidative and proinflammatory environment.8 Studies suggest that peripheral resistance to leptin of an idiopathic cause, similar to that occurring with insulin, apparently develops, i.e. unknown biochemical mechanisms modify leptin receptor sensitivity and decrease the dynamic potency of leptin in the target cell. In addition, the intrinsic capacity of leptin to activate neurons of the sympathetic nervous system (SNS) causes a pathological hyperadrenergic state which is thought to be involved in the development of HBP in MS and excess lipolysis.20
The metalloproteinase levels found were 28.1ng/mL for MMP-2 and 7.5ng/mL for MMP-9. As compared to another study conducted by Nieto et al.21 in the same city on young subjects with no identifiable diseases, MMP-2 levels in our study were lower than those found in that study (52.05ng/mL). MMP-9 levels were however similar to those in our study (5.29ng/mL). Hopps et al.22 found a significant increase in plasma levels of both MMP-2 and MMP-9 in the whole group of subjects with MS; Yadav et al.23 also reported significantly higher serum levels of MMP-2 and MMP-9 (p<0.001) in patients with MS as compared to the control group.
As regards other variables related to MS diagnosis, special mention should be made of total cholesterol and blood glucose, whose mean levels were within normal limits (only five drivers were diagnosed with diabetes mellitus). TG levels were increased, and HDL cholesterol was below normal limits. Low HDL cholesterol is a common finding in several studies on subjects with cardiovascular risk in the city of Armenia.24
The TG/HDL ratio was increased. This ratio has been recognized as a marker of insulin resistance and MS.25 Peripherally, resistance to leptin increases its proinflammatory actions on adipose tissue, promoting the development of insulin resistance and atherogenic vascular remodeling processes.8
Multiple regression between the different variables showed that the explained variation of waist circumference in this study had a statistically significant relationship with the BMI, MMP-2, age, SBP, and DBP. Mieczkowska et al.26 found significant relationships between waist circumference and HDL, TG, and MMP-9 in females.
In this study, the explained variation of leptin had a statistically significant relationship with the BMI, MMP-2, and TG. Moon et al.14 found that MMP-2 secretion is significantly increased in cultures treated with leptin and accelerates adipocyte differentiation, which suggests that MMP-2 is a necessary mediator in adipogenesis.
In this study, the explained variation of MMP-2 was significantly related to waist circumference, blood glucose, and age. Moon et al.14 showed that MMP-2 may be secreted by adipocytes and is increased in obesity. Bastard et al.27 showed obesity to be associated with low grade inflammation of white adipose tissue and also that leptin may modulate the production of TNF-alpha and macrophage activation. In rodent models, obesity plays a significant role in the pathogenesis of insulin resistance, but the role of glucose metabolism in humans is controversial. IL-6 production in human adipose tissue is increased during obesity.8 However, Sbardella et al.28 suggested that prohomeostatic actions predominate in MMP-2 and proinflammatory actions predominate in MMP-9.
The known risk factors include cigarette smoking, for which statistical significance was found. The Machado and Machado study29 of cardiovascular risk factors conducted in 10 Colombian towns reported smoking in 6.4%. A causal relationship has been found between cigarette smoking and health risk; diabetic patients who smoke are more likely to experience macrovascular and microvascular problems, leading to increased morbidity and mortality.5
As regards exercise as a protective factor, 63.79% of our study subjects took no exercise. The mean exercise time was 57.35min per week. The WHO recommends 150min of exercise weekly, and exercise has been recognized as providing a wide range of benefits.30
ConclusionThe explained variation of waist circumference has a statistically significant relationship with the BMI, MMP-2, age, SBP, and DBP. Leptin variation has a statistically significant relationship with the BMI, MMP-2, and TG. Variation in MMP-2 has a statistically significant relationship with waist circumference, blood glucose, and age.
To sum up, statistically significant relationships were found between waist circumference and MMP-2, between leptin and MMP-2, and between MMP-2 and waist circumference and blood glucose in public service vehicle drivers with MS.
FundingThe project was funded with resources from the Research Group in Cardiovascular and Metabolic Diseases (Gecavyme), School of Health Sciences, Universidad del Quindío, Armenia, Colombia.
Conflicts of interestThere are no conflicts of interest.
We thank medical students Cristian David Rodríguez, José Danilo Jojoa, and Luis Felipe Orozco; bacteriologists María del Socorro López and Luis Miguel Arredondo, and laboratory assistant Martha Cecilia Giraldo for their help.
Please cite this article as: Nieto Cárdenas OA. Metaloproteinasas y leptina en conductores de vehículo de servicio público con síndrome metabólico en Armenia, Quindío. Endocrinol Nutr. 2015;62:430–436.
