


To analyze lipid changes and their relationship with 25-hydroxy vitamin D3 (25-OH-D) levels in patients under 18 years old with type 1 diabetes mellitus (T1DM).
Material and methodsA cross-sectional, descriptive study. Patients under 18 years with T1DM were enrolled by consecutive, nonrandomized sampling. Data collected included sex, age, pubertal stage, time since T1DM onset, weight, height, body mass index (BMI), waist circumference, glycosylated hemoglobin (HbA1c), 25-OH-D, total cholesterol (TC), LDL cholesterol (LDL-C), HDL cholesterol (HDL-C), and triglycerides (TG). Results were stratified by sex, age, and pubertal stage. Data were analyzed using SPSS®.
ResultsNinety patients with a mean age of 11.7±3.6 years (51.1% males) and mean HbA1c levels of 7.5±1.3% were enrolled. Of these, 26.6% had 25-OH-D levels <20ng/mL and 13.3% 25-OH-D levels ≤15ng/mL. No differences were found in 25-OH-D between patients with overweight or obesity and the rest. HDL-C levels <40ng/mL were found in 1.1%, 34.4% had LDL-C levels ≥100mg/dL, and 2.2% had TG levels ≥150mg/dL. Patients with 25-OH-D <20ng/mL had higher TG levels than the rest (76.80±45.62 vs 57.55±26.08; P=.04) in the multivariate analysis controlled for BMI, waist circumference, and HbA1c. A correlation was found between 25-OH-D and TG levels (−0.230; P=.029).
ConclusionsPatients in our population with vitamin D deficiency had higher TG levels. Long-term follow-up should be performed to understand the potential impact of such levels on diabetes-related complications.
Analizar en menores de 18 años con diabetes mellitus tipo 1 (DM1) las alteraciones lipídicas y su relación con los niveles de 25 hidroxi vitamina D3 (25-OH-D).
Material y métodosEstudio transversal y descriptivo. Se incluyen menores de 18 años con DM1 mediante un muestreo no aleatorizado consecutivo. Determinaciones: sexo, edad, estadio puberal, tiempo de evolución de la DM1, peso, talla, índice de masa corporal, perímetro abdominal, hemoglobina glucosilada (HbA1c) 25-OH-D, colesterol total, LDL-colesterol, HDL-colesterol y triglicéridos (TG). Se estratifican los resultados para sexo, edad y estadio puberal. Se analizan los datos con el programa SPSS®.
ResultadosSe recogen 90 pacientes: edad media de 11,7±3,6 años, predominio masculino (51,1%) y HbA1c media de 7,5±1,3%. El 26,6% presentan 25-OH-D <20ng/ml y el 13,3% 25-OH-D≤15ng/ml. No se observan diferencias en la 25-OH-D en pacientes con sobrepeso-obesidad respecto al resto. El 1,1% presentan HDL-colesterol<40ng/ml, el 34,4% LDL-colesterol≥100mg/dl y el 2,2% TG≥150mg/dl. Los pacientes con 25-OH-D<20ng/ml presentan valores superiores de TG que el resto (76,80±45,62 vs 57,55±26,08; p=0,04) en el análisis multivariante para índice de masa corporal, perímetro abdominal y HbA1c. Se observa correlación entre los niveles de 25-OH-D y los TG (−0,230; p=0,029).
ConclusiónEn nuestra población los pacientes con insuficiencia de vitamina D muestran valores de TG superiores. Debe realizarse un seguimiento a largo plazo para conocer las repercusiones sobre las complicaciones relacionadas con la diabetes.
The diagnosis of hyperlipidemia during childhood is very important for the prevention of cardiovascular disease, because lipid levels in childhood are related to the lipid profile in adulthood.1 This appears to be particularly relevant in patients with type 1 diabetes mellitus (T1DM), a group with an increased risk of vascular complications.
Low vitamin D levels have in turn been reported as being correlated to a lipoprotein profile of increased cardiovascular risk and to the presence of other unfavorable factors, such as increased blood pressure or overweight.2
Few studies have been conducted to date on the relationship between vitamin D and the lipoprotein profile in pediatric patients with T1DM. This study was therefore intended to analyze changes in lipid metabolism and their relationship to 25-hydroxyvitamin D3 (25-OH-D) levels in patients under 18 years of age with T1DM.
Patients and methodsStudy design and inclusion criteriaA cross-sectional, observational, descriptive study was conducted on patients diagnosed with T1DM being monitored at the pediatric endocrinology outpatient clinic of Hospital General Universitario in Ciudad Real. Data were prospectively collected from January 1 to December 31 2013, and the study sample was enrolled using consecutive, non-randomized sampling.
The inclusion criteria were as follows: the diagnosis of T1DM (positive insulin and/or glutamic acid decarboxylase and/or tyrosine phosphatase antibodies), intensive insulin therapy (at least three subcutaneous doses of rapid-acting insulin daily or two subcutaneous doses of slow-acting insulin daily, or with continuous insulin infusion systems). The exclusion criteria included: the diagnosis of any other form of diabetes, the requirement of less than three doses of subcutaneous insulin daily, T1DM duration shorter than one year, the diagnosis of concomitant malabsorption diseases, and chronic treatment with corticosteroids or antiepileptic drugs.
Based on these inclusion and exclusion criteria, the data collection period, and department statistics, the sample size was initially estimated at 100 patients.
Study variablesThe qualitative variables collected included sex, the pubertal development stage, the time since the diagnosis of T1DM, and the season in which 25-OH-D was measured. The quantitative variables recorded included age, weight, height, and the body mass index (BMI), abdominal circumference, glycosylated hemoglobin (HbA1c), 25-OH-D levels, and the lipoprotein profile, including total cholesterol (TC), high density lipoprotein cholesterol (HDL-C), low density lipoprotein cholesterol (LDL-C), and triglycerides (TG).
Weight was measured using an electronic scale with a scale ranging from 0 to 120kg and with a precision of 100g with the patients in their underwear. Height was measured using a rigid wall-mounted stadiometer with a scale ranging from 60 to 200cm and a precision of 0.1cm with the patients not wearing shoes.
Following the recommendations of the Clinical practice guidelines on the prevention and treatment of obesity in children and adolescents of the Spanish Ministry of Health,3 the BMI was assessed by taking as reference the charts of the semilongitudinal study by Hernández et al.,4 who defined overweight as a BMI equal to or higher than the 90th percentile (P90) for age and sex, and obesity as a BMI equal to or higher than the 97th percentile (P97) for age and sex.
Abdominal circumference was measured at the end of expiration, with the patient standing, at the midpoint between the lower costal margin and the iliac crest. The charts reported by Fernández et al.5 were used as reference values, and the results were given as standard deviations (SD) of the mean for age and sex.
The Tanner stage of pubertal development (I, II, III, IV, or V) was assessed, with stage I corresponding to the prepubertal stage and stages II–V to the different degrees of development up to adult maturity.25-OH-D levels were measured by chemiluminescence using Immulite 2000® equipment, and expressed as ng/mL. Based on the current reference values for defining vitamin D status in children and adolescents,6 the following cut-off points were established: vitamin D sufficiency for 25-OH-D levels ≥20ng/mL (50nmol/L), vitamin D insufficiency for 25-OH-D levels ranging from 15 to 20ng/mL (37.5–50nmol/L), and vitamin D deficiency for 25-OH-D levels ≤15ng/mL (37.5nmol/L).
The lipoprotein profile (TC, HDL-C, LDL-C, and TG) was tested in blood under fasting conditions. The reference values used to define hyperlipidemia were those reported in the consensus of the International Society for Pediatric and Adolescent Diabetes (ISPAD).7 HbA1c was measured in blood under fasting conditions, and the results were expressed based on equivalence for the procedure used in the Diabetes Control and Complications Trial (DCCT). An ADAMS A1c model HA-8160 analyzer (Menarini Diagnóstica SA), using high-performance liquid chromatography, was used.
Statistical analysisSPSS® software was used. Descriptive statistical analyses were performed for qualitative variables, displayed using frequency distribution tables, and for qualitative variables, displayed using central frequency and dispersion statistics. An inferential statistical analysis was performed using a Pearson's correlation test (between quantitative variables) and a Student's t test for differences in means (between qualitative and quantitative variables) for independent samples, after verifying the normal distribution of the variables using a Kolmogorov–Smirnov test. A value of p<0.05 was considered statistically significant. Data were stratified by sex and Tanner stage of pubertal development. The study was completed with a linear regression analysis.
Ethical and confidentiality issuesThis study was conducted in accordance with the principles of the Declaration of Helsinki and its revisions related to research in humans, and after receiving the favorable opinion of the Clinical Research Ethics Committee of Hospital General Universitario in Ciudad Real.
ResultsSample descriptionData from only 90 of the 100 patients initially planned were collected as previously described, as 10 patients either declined to give their consent or did not attend the scheduled visits during the period of the study. Males slightly predominated (51.1%) in the study sample, which had a mean age of 11.7±3.6 years. The median time since the diagnosis of T1DM was 5.03 years (1–16.9 years). Signs of pubertal development were seen in 62.2% of patients (Tanner II 11.1%, Tanner III 13.3%, Tanner IV 25.6%, and Tanner V 12.2%). A BMI≥P90 (overweight-obesity) and a BMI≥P97 (obesity), based on the reference values used, were seen in 24.4% and 16.7% of the study sample respectively. The mean HbA1c of the sample was 7.5±1.3%.
25-hydroxyvitamin D3 levelsAmong the study patients, 26.6% had 25-OH-D levels less than 20ng/mL, half of whom (13.3% of the sample) had values ≤15ng/mL, representing vitamin D deficiency according to the prior categorization. No significant differences were found in 25-OH-D levels after stratification by sex and pubertal development. As regards mean 25-OH-D levels by season, values were significantly higher in summer (37.89ng/mL) and autumn (34.46ng/mL) as compared to winter (22.54ng/mL) and spring (27.56ng/mL) (p=0.01).
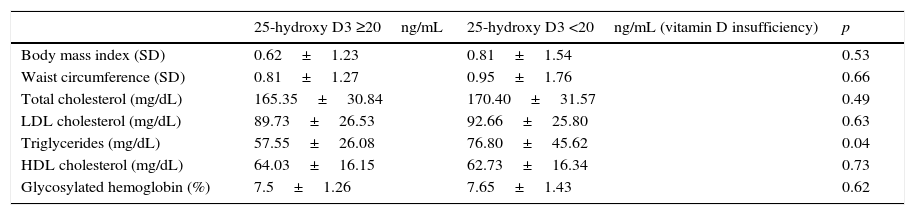
No statistically significant differences were seen in 25-OH-D levels between patients with overweight and normal weight (29.25±11.28 vs 27.14±10.90ng/mL; p=0.43) or between patients with obesity and the rest (27.55±11.15 vs 28.17±10.34ng/mL; p=0.84). There were no significant differences either in the BMI and waist circumference between patients with vitamin D insufficiency and the rest (Table 1).
Body adiposity, lipid profile, and glycosylated hemoglobin in patients with and without vitamin D insufficiency.
| 25-hydroxy D3 ≥20ng/mL | 25-hydroxy D3 <20ng/mL (vitamin D insufficiency) | p | |
|---|---|---|---|
| Body mass index (SD) | 0.62±1.23 | 0.81±1.54 | 0.53 |
| Waist circumference (SD) | 0.81±1.27 | 0.95±1.76 | 0.66 |
| Total cholesterol (mg/dL) | 165.35±30.84 | 170.40±31.57 | 0.49 |
| LDL cholesterol (mg/dL) | 89.73±26.53 | 92.66±25.80 | 0.63 |
| Triglycerides (mg/dL) | 57.55±26.08 | 76.80±45.62 | 0.04 |
| HDL cholesterol (mg/dL) | 64.03±16.15 | 62.73±16.34 | 0.73 |
| Glycosylated hemoglobin (%) | 7.5±1.26 | 7.65±1.43 | 0.62 |
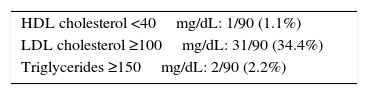
Taking into account the reference values established for children by the International Society for Pediatric and Adolescent Diabetes (ISPAD),7 the proportions of patients in our sample with HDL-C <40mg/dL, LDL-C ≥100mg/dL, and TG ≥150mg/dL are provided (Table 2). No correlation was seen between the different components of the lipid profile and HbA1c values or the time since the onset of T1DM.
Lipid profile changes in the study sample based on the consensus of the International Society for Pediatric and Adolescent Diabetes for children.
| HDL cholesterol <40mg/dL: 1/90 (1.1%) |
| LDL cholesterol ≥100mg/dL: 31/90 (34.4%) |
| Triglycerides ≥150mg/dL: 2/90 (2.2%) |
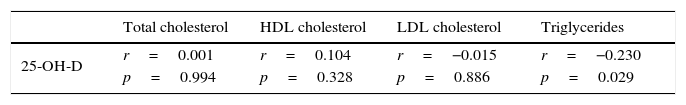
Patients with vitamin D insufficiency had higher TG values than the other patients with 25-OH-D levels ≥20ng/mL (Table 1), and a linear regression analysis showed that this relation was independent of the BMI, abdominal circumference, and HbA1c (p=0.04). No differences were seen, however, between the two groups regarding TC, HDL-C, or LDL-C levels (Table 1). A negative correlation was also shown between 25-OH-D and TG levels (r=−0.230; p=0.029), but not with the other lipoprotein profile parameters (Table 3).
DiscussionAlthough most studies of the lipid profile of patients with T1DM have been conducted in adults, some studies performed on pediatric populations have reported frequent lipid profile changes in children and adolescents with T1DM. Thus, 22.5% were found to have TC levels ≥200mg/dL, 10.8% LDL-C levels ≥130mg/dL, and 23.7% HDL-C levels <42mg/dL.8 TC and LDL-C levels also positively correlated to HbA1c, and TC levels additionally correlated to T1DM duration.8,9 These prevalence rates of lipid profile changes are markedly higher than those seen in our series, where no correlation was seen with HbA1c levels or with the time since the onset of T1DM.
As regards the association between 25-OH-D and the lipoprotein profile, studies on pediatric populations have found that children with lower 25-OH-D levels showed higher TC, LDL-C,10 and TG levels,11,12 with a negative correlation seen between 25-OH-D and CT, LDL-C, and apolipoprotein B.10 In our population of pediatric patients with T1DM, however, a significant association was also seen with TG, which was in turn independent of the BMI and waist circumference. An association independent of body adiposity between 25-OH-D and other cardiovascular and metabolic risk factors such as high blood pressure, hyperglycemia, and decreased HDL-C levels has also been reported in childhood and adolescence.12,13 In this regard, a negative correlation was found in our series between 25-OH-D and TG, but not with any of the other parameters tested. However, despite these observations, it has not been shown that vitamin D supplementation in pediatric patients has any impact on the lipid profile, insulin resistance markers such as the HOMA index, or inflammation markers such as C-reactive protein.14
Adult patients with T1DM have been reported to have a lower prevalence of hyperlipidemia as compared to non-diabetic populations or patients with T2DM.15 Despite this observation, however, patients with T1DM paradoxically have a greater risk of developing cardiovascular diseases. It has been reported that patients with insulin resistance data show a more atherogenic lipid profile, so that males have higher LDL-C levels and females lower HDL-C levels.16 In this regard, it has been noted that vitamin D deficiency could have an impact on the inhibition of the differentiation of adipose tissue and lipoprotein lipase, thus implying the presence of an atherogenic lipid profile.17,18 Hypovitaminosis D may therefore have an impact on the presence of the different cardiovascular risk factors, and its measurement should thus be considered when these patients are evaluated. On the other hand, statin treatment has been associated with increased plasma vitamin D levels, and has been attributed to a pleiotropic effect of these drugs.19
As regards the lipid profile and the complications related to T1DM in pediatric patients, it has been reported that peptides such as advanced glycation end products could be related to their etiopathogenesis.20 Thus, advanced glycation end products have been found to be increased in children with T1DM as compared to healthy controls, and to positively correlate to TC and TG levels.20 It has also been noted that changes in the metabolism of residual lipoproteins could contribute to the arterial deposition of cholesterol. Specifically, it has been reported that apoB48 levels are increased in patients with T1DM, which may be related to the development of associated complications.21
In conclusion, although the proportion of patients with changes in their lipoprotein profile was lower in our sample than in other studies, the group with vitamin D insufficiency had TG levels significantly higher than the rest of the sample. Monitoring is therefore required to ascertain the potential long-term impact of this on the metabolic control of T1DM and the development of associated complications, and the potential impact of vitamin D supplementation on these factors. Future studies are also needed to analyze vitamin D levels and the metabolic control of T1DM in relation to factors not addressed in this study, such as dietary habits, sun exposure time, and the practice of physical exercise.
Conflicts of interestThe authors state that they have no conflicts of interest.
Please cite this article as: Zambrana-Calví GDR, Palomo-Atance E, Gourdet ME, León-Martín A, Ballester-Herrera MJ, Giralt-Muiña P. Alteraciones lipídicas y su relación con los niveles de vitamina D en menores de 18 años con diabetes tipo 1. Endocrinol Nutr. 2016;63:126–131.
