


Diabetes has become a co-morbidity with a negative impact on nutritional status, lung function and survival in cystic fibrosis.
ObjectiveTo identify any changes in intermediate points after a 2-h oral glucose tolerance test (OGTT), pancreatic β-cell dysfunction, and insulin resistance in cystic fibrosis-related diabetes.
MethodsIt was carried out a retrospective analysis in a cohort of 64 patients affected of cystic fibrosis, older than 14 years, using the first pathological OGTT. Peripheral insulin resistance was measured using the homeostasis model assessment for insulin resistance (HOMA-IR), and pancreatic β-cell function was calculated according to Wareham. Time to maximum plasma insulin and glucose levels and area under the curve (AUC0–120) were also measured.
ResultsTwenty-eight women and 36 men with a mean age of 26.8 years were enrolled, of whom 26.7% had normal glucose tolerance (NGT), 18.3% cystic fibrosis-related diabetes without fasting hyperglycemia (CFRD w/o FPG), 10% indeterminate (INDET), and 45% impaired glucose tolerance (IGT). HOMA-IR values were not significantly different between the diagnostic categories. Patients with any pathological change had worse β-cell function, with a significant delay in insulin secretion, although there were no differences in total insulin production (AUC0–120). Time to maximum glucose levels was significantly shorter in NGT patients as compared to other categories, with glucose AUC0–120 being higher in the different diagnostic categories as compared to NGT.
ConclusionsIn over half the cases, peak blood glucose levels during a standard OGTT are reached in the intermediate time points, rather than at the usual time of 120min. Patients with cystic fibrosis and impaired glucose metabolism have a delayed insulin secretion during the standard OGTT due to loss of first-phase insulin secretion, with no differences in total insulin production. Absence of significant changes in HOMA-IR suggests that β-cell dysfunction is the main pathogenetic mechanism.
La diabetes se ha convertido en una comorbilidad prevalente que tiene un impacto negativo sobre el estado nutricional, la función pulmonar y la supervivencia en la fibrosis quística.
ObjetivoIdentificar alteraciones en los puntos intermedios del test de tolerancia oral a la glucosa de 2h (OGTT), la disfunción de la célula β pancreática y la resistencia insulínica en la diabetes relacionada con la fibrosis quística.
MétodosAnalizamos de forma retrospectiva una serie de 64 pacientes mayores de 14 años, mediante los datos del primer OGTT patológico durante su seguimiento. Se determinaron la resistencia insulínica, usando el modelo HOMA-IR, la función de la célula β pancreática según Wareham, el tiempo en alcanzar la concentración máxima plasmática de insulina y glucosa y el área bajo la curva (AUC0–120).
ResultadosSe incluyeron 28 mujeres y 36 varones. La media de edad de la serie fue de 26,8 años. El 26,7% tenía una tolerancia normal (TGN), un 18,3% diabetes sin alteración de la glucosa en ayunas (CFRD sin FPG), el 10% una alteración indeterminada (INDET) y el 45% intolerancia hidrocarbonada (IGT). En los valores del HOMA-IR no se encontraron diferencias entre ningún grupo. Los casos con alguna alteración diagnóstica tenían una peor función de la célula β, con un retraso significativo en la secreción de insulina, aunque no hubo diferencias en su producción total (AUC0–120). El tiempo en alcanzar el pico máximo de glucosa era significativamente menor en los TGN frente al resto de categorías, siendo el AUC0–120 de glucosa mayor en las distintas categorías diagnósticas frente a TGN.
ConclusionesEn más de la mitad de los casos el pico máximo de glucemia en la OGTT se alcanza en puntos intermedios y no en el tiempo clásico de 120min. La secreción precoz de insulina está retrasada en los pacientes con fibrosis quística y alteraciones en el metabolismo de la glucosa, sin llegar a observarse diferencias en la producción total de la misma. La ausencia de alteraciones significativas en el HOMA-IR sugiere que la disfunción de la célula β es el principal mecanismo patogénico.
Cystic fibrosis (CF) is the fatal genetic disease with autosomal recessive inheritance most common among Caucasians. CF results from a mutation in the gene that encodes the protein called cystic fibrosis transmembrane conductance regulator (CFTR), located in the long arm of chromosome 7 (7q31.2). More than 1500 mutations have been identified, but the most common one is the deletion of phenylalanine at position 508 (ΔF508), which affects approximately 94% of subjects; no other mutation occurs in more than 5% of individuals.1,2 The incidence of CF in Spain ranges from one per 2810–8028 live newborns, depending on the different prevalence of the ΔF508 mutation.3,4 The survival rate of patients with CF has significantly improved in the last decades as the result of advances in respiratory and nutritional medical care, which has allowed for a life expectancy of between 30 and 40 years.5 Cystic fibrosis-related diabetes (CFRD) and other carbohydrate metabolism changes are among the most common current comorbidities, although the first cases reported of CFRD and impaired glucose tolerance (IGT) in CF date back to 1955.5 The prevalence of CFRD increases with age: 9% at 5–9 years, 26% at 10–20 years, and up to 50% at around 30 years. From 15 to 30 years of age, the proportion of patients with normal glucose tolerance (NGT) decreases almost linearly, but this is difficult to estimate because glucose tolerance varies from year to year in patients with CF.6–10 The risk of death attributable to diabetes in CF ranges from 31% to 55% regardless of other complications of CF.11 However, the overall mortality rate has decreased in recent years from 6.7 (1992–1997) to 3.5 (2003–2008) per 100 person-years.12 The early diagnosis of CFRD and adequate therapeutic management are therefore essential in the monitoring of these patients, not only in childhood, but also as a determinant clinical factor for prognosis in adolescence and adulthood.
The oral glucose tolerance test (OGTT) is the diagnostic test of choice because basal fasting plasma glucose (FPG) levels used as the only screening test would leave undiagnosed more than 2/3 of patients with CFRD.13 However, a blood glucose peak at 120min may be absent in a high number of patients with CF, and it is therefore considered necessary to draw samples every 30min during this test. It has been noted that subjects with CF but no CFRD have peak blood glucose levels at 30, 60, and 90min, but blood glucose levels similar to healthy controls both at baseline and 120min,14 and that these more subtle changes may have clinical relevance.15,16 Thus, in recent years various authors have suggested that blood glucose levels at 60 and 90min may be more sensitive for detecting glucose intolerance in these patients.14 The US Cystic Fibrosis Foundation17 and the International Society of Pediatric & Adolescent Diabetes18 do not differentiate between CFRD with or without FPG because it has recently been suggested that treatment of both would involve benefits for nutritional status and lung function.19,20
The study objectives were to assess OGTT curve changes (particularly, at these intermediate points), insulin resistance, and pancreatic β-cell function between patients with NGT and the different diagnostic categories of carbohydrate metabolism changes in a cohort of adolescent and adult patients with CF.
Material and methodsSubjectsA number of variables were collected from patients with CF followed up by the multidisciplinary cystic fibrosis unit of Hospital Universitario Ramón y Cajal during 2011–2012. Patients were diagnosed with CF using the criteria of Rosenstein and Cutting (1998) and the European Cystic Fibrosis Society.
Patients recruited into the study met the following criteria: diagnosis of CF, age older than 14 years, and annual screening for diabetes using OGTT. Exclusion criteria included: age under 14 years and incomplete OGTT data, the absence of records of lung function and nutritional parameters coinciding in time, pregnancy, HIV, HCV and/or HBV infection, and organ transplant at the time or before OGTT.
MethodsData were collected from clinical histories, both electronic and those kept in hospital files. Data from the year of diagnosis of the first pathological screening OGTT, i.e. with some of the diagnostic categories defined by the American Diabetes Association (ADA),17 were analyzed. In patients with no pathological OGTT, data from the most recently performed OGTT were collected.
The study was approved by the local ethics committee (registry number 063/12).
Oral glucose tolerance testThe OGTT consists of the administration of an oral solution containing 1.75g/kg of glucose (maximum dose 75g) dissolved in water. Blood samples are subsequently drawn to measure insulin and glucose levels at baseline and 30, 60, 90, and 120min.
Study groups were defined based on the criteria for CFRD and other glucose metabolism changes–IGT and indeterminate glucose tolerance (INDET)–of the North American CF Consensus Conference (2010) and the American Diabetes Association (ADA).12,17 The OGTT was performed during a stabile phase of the disease lasting at least 6 weeks–defined as the absence of intercurrent infections, systemic corticosteroid and/or antibiotic therapy, or hospitalization–and as an annual screening method from the age of 10 years, as recommended by the US Cystic Fibrosis Foundation17 and the International Society of Pediatric & Adolescent Diabetes.18
Plasma glucose levels were measured using the glucose oxidase method (Beckman Glucose Analyser; Beckman Instruments, Fullerton, CA, USA). Serum insulin levels were measured using a solid-phase chemiluminescent immunometric assay (IMMULITE 2000, Siemens Medical Solutions Diagnostics. Los Angeles, CA, USA). Maximum intra-assay and inter-assay coefficients were 5.5% and 7.3% for insulin. Analytical sensitivity of the assay for insulin was 2mU/L. Blood glucose values are given in mg/dL, and insulin levels in mU/L.
Insulin resistance was tested using the homeostasis model HOMA-IR, which only requires basal glucose and insulin levels (G0 [mmol/L)×I0/22.5)21. Pancreatic β-cell function (mU/mmol) was assessed as the ratio of insulin increase at 30min (I30−I0mU/L) to glucose at 30min during the OGTT (in mmol/l) based on the model of Wareham et al.22 and on the methodology of Yung et al.23
Respiratory function tests were performed using a spirometry system following the procedures modified in 1987 by the National Institute for Occupational Safety and Health and the American Thoracic Society. The results of the forced expiratory volume in 1s (FEV1) are given as the percentage of the predicted value for age, sex, race, weight, and height according to the recommendations of the Spanish Society of Pneumonology and Thoracic Surgery (SEPAR).
Statistical analysisQuantitative variables are given as their respective frequencies, and normally distributed continuous variables as mean (and standard deviation). Variables not normally distributed are given as median and interquartile range (IQR, Ip25–p75). The normal distribution of variables was verified using a Kolmogorov–Smirnov test.
A bimodal Student's t test for independent data was used as a parametric test in continuous variables with a normal distribution. A Mann–Whitney U test was used for normally distributed variables, except in cases where a logarithmic data transformation showed a better fit of the model in the comparison of the different diagnostic categories in the area under the curve (AUC0–120) and in time to reach peak plasma insulin and glucose concentration (Tmax in minutes). Times to peak insulin and glucose concentration were calculated assuming a Gaussian distribution of data in the OGTT.
A value of p<0.05 (two-sided) was considered significant in all tests. Statistical analyses were performed using software SPSS version 18.0 (Chicago, IL, USA) and MedCalc Statistical Software version 13.1.2 (MedCalc Software bvba, Ostend, Belgium; http://www.medcalc.org; 2014).
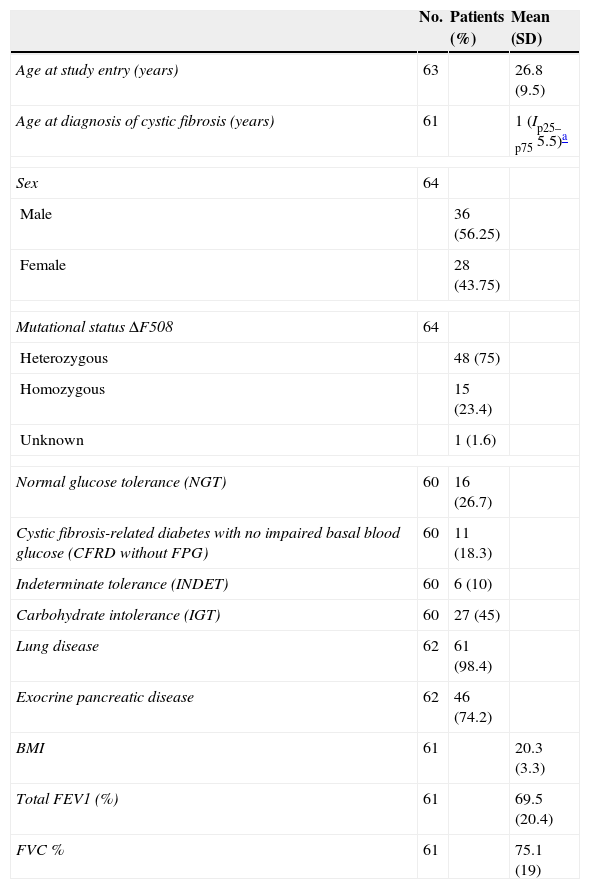
ResultsMean patient age at study entry was 26.8 years (SD 9.5). The sample consisted of 64 patients, of which 60 were finally included in the analysis. Table 1 shows the general characteristics of the sample.
Clinical, genetic, and lung function characteristics of patients undergoing oral glucose tolerance test and with blood glucose disorders related to cystic fibrosis.
| No. | Patients (%) | Mean (SD) | |
|---|---|---|---|
| Age at study entry (years) | 63 | 26.8 (9.5) | |
| Age at diagnosis of cystic fibrosis (years) | 61 | 1 (Ip25–p75 5.5)a | |
| Sex | 64 | ||
| Male | 36 (56.25) | ||
| Female | 28 (43.75) | ||
| Mutational status ΔF508 | 64 | ||
| Heterozygous | 48 (75) | ||
| Homozygous | 15 (23.4) | ||
| Unknown | 1 (1.6) | ||
| Normal glucose tolerance (NGT) | 60 | 16 (26.7) | |
| Cystic fibrosis-related diabetes with no impaired basal blood glucose (CFRD without FPG) | 60 | 11 (18.3) | |
| Indeterminate tolerance (INDET) | 60 | 6 (10) | |
| Carbohydrate intolerance (IGT) | 60 | 27 (45) | |
| Lung disease | 62 | 61 (98.4) | |
| Exocrine pancreatic disease | 62 | 46 (74.2) | |
| BMI | 61 | 20.3 (3.3) | |
| Total FEV1 (%) | 61 | 69.5 (20.4) | |
| FVC % | 61 | 75.1 (19) | |
NGT after the OGTT was found in 26.7% (n=16). CFRD without FPG was detected in 18.3% (n=11) of patients. There were no cases of CFRD with FPG. The INDET category was found in 10% (n=6), and IGT in 45% (n=27) of patients. In no patient was impaired FPG detected.
Glycemic status and glucose and insulin response in the OGTTPeak blood glucose level was reached at 30min in 10.9% of patients, at 60min in 50%, at 90min in 15.6%, and at 120min in 6.3% of patients. Peak insulin level was found at 120min in 40.6% of patients, while 25% reached it at 90min, 10.9% at 60min, and 3.1% at 30min of the OGTT.
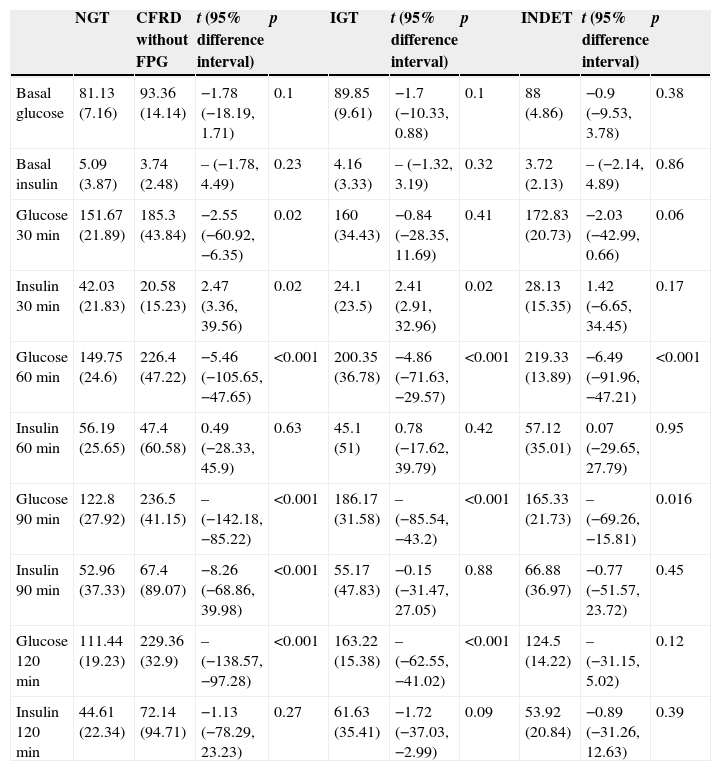
A comparison of patients with NGT and those with CFRD criteria without FPG (Table 2; Fig. 1) showed a statistically significant difference in mean plasma glucose levels from minute 30 of the test (p=0.018), a difference that persisted in the next measurements at 60, 90, and 120min (p<0.001 at each of these points). As regards plasma insulin levels, the differences consisted of lower values at 30min in patients with CFRD without FPG (p=0.022) and higher values at 90min (p<0.001) (Table 2; Fig. 2).
Differences in the OGTT curve between NGT and the different categories of carbohydrate disorders.
| NGT | CFRD without FPG | t (95% difference interval) | p | IGT | t (95% difference interval) | p | INDET | t (95% difference interval) | p | |
|---|---|---|---|---|---|---|---|---|---|---|
| Basal glucose | 81.13 (7.16) | 93.36 (14.14) | −1.78 (−18.19, 1.71) | 0.1 | 89.85 (9.61) | −1.7 (−10.33, 0.88) | 0.1 | 88 (4.86) | −0.9 (−9.53, 3.78) | 0.38 |
| Basal insulin | 5.09 (3.87) | 3.74 (2.48) | – (−1.78, 4.49) | 0.23 | 4.16 (3.33) | – (−1.32, 3.19) | 0.32 | 3.72 (2.13) | – (−2.14, 4.89) | 0.86 |
| Glucose 30min | 151.67 (21.89) | 185.3 (43.84) | −2.55 (−60.92, −6.35) | 0.02 | 160 (34.43) | −0.84 (−28.35, 11.69) | 0.41 | 172.83 (20.73) | −2.03 (−42.99, 0.66) | 0.06 |
| Insulin 30min | 42.03 (21.83) | 20.58 (15.23) | 2.47 (3.36, 39.56) | 0.02 | 24.1 (23.5) | 2.41 (2.91, 32.96) | 0.02 | 28.13 (15.35) | 1.42 (−6.65, 34.45) | 0.17 |
| Glucose 60min | 149.75 (24.6) | 226.4 (47.22) | −5.46 (−105.65, −47.65) | <0.001 | 200.35 (36.78) | −4.86 (−71.63, −29.57) | <0.001 | 219.33 (13.89) | −6.49 (−91.96, −47.21) | <0.001 |
| Insulin 60min | 56.19 (25.65) | 47.4 (60.58) | 0.49 (−28.33, 45.9) | 0.63 | 45.1 (51) | 0.78 (−17.62, 39.79) | 0.42 | 57.12 (35.01) | 0.07 (−29.65, 27.79) | 0.95 |
| Glucose 90min | 122.8 (27.92) | 236.5 (41.15) | – (−142.18, −85.22) | <0.001 | 186.17 (31.58) | – (−85.54, −43.2) | <0.001 | 165.33 (21.73) | – (−69.26, −15.81) | 0.016 |
| Insulin 90min | 52.96 (37.33) | 67.4 (89.07) | −8.26 (−68.86, 39.98) | <0.001 | 55.17 (47.83) | −0.15 (−31.47, 27.05) | 0.88 | 66.88 (36.97) | −0.77 (−51.57, 23.72) | 0.45 |
| Glucose 120min | 111.44 (19.23) | 229.36 (32.9) | – (−138.57, −97.28) | <0.001 | 163.22 (15.38) | – (−62.55, −41.02) | <0.001 | 124.5 (14.22) | – (−31.15, 5.02) | 0.12 |
| Insulin 120min | 44.61 (22.34) | 72.14 (94.71) | −1.13 (−78.29, 23.23) | 0.27 | 61.63 (35.41) | −1.72 (−37.03, −2.99) | 0.09 | 53.92 (20.84) | −0.89 (−31.26, 12.63) | 0.39 |

Mean glucose concentration in mg/dL after an oral glucose tolerance test in patients with cystic fibrosis and different diagnostic categories of carbohydrate metabolism disorders. NGT vs CFRD without FPG: p=0.018 at 30min; p<0.001 at 60, 90, and 120min. NGT vs IGT: p<0.001, at 60, 90, and 120min; p=NS at 30min. NGT vs INDET: p=NS at 30 and 120min; p<0.001 at 60min and p=0.016 at 90min. CFRD without FPG: cystic fibrosis-related diabetes with no impaired fasting blood glucose; IGT: impaired glucose tolerance; INDET: indeterminate glucose tolerance; NGT: normal glucose tolerance.

Mean insulin concentration in mU/L after the oral glucose tolerance test in patients with cystic fibrosis and different diagnostic categories of carbohydrate metabolism disorders. NGT vs CFRD without FPG: p=0.022 at 30min; p<0.001 at 90min; p=NS at 60 and 120min. NGT vs IGT: p=0.021 at 30min; p<0.001 at 60, 90, and 120min. NGT vs INDET: p=NS at 30, 60, 90, and 120min. CFRD without FPG: cystic fibrosis-related diabetes with no impaired fasting blood glucose; IGT: impaired glucose tolerance; INDET: indeterminate glucose tolerance; NGT: normal glucose tolerance.
In the comparison of glucose and insulin values in the NGT and IGT groups (Table 2), differences persisted for glucose levels at 60, 90, and 120min (p<0.001 at each of these points), and also at the lowest insulin levels at 30min in the IGT group (p=0.021). In the NGT and INDET groups, differences were also seen in plasma glucose levels at 60 and 90min (p<0.001 and p=0.016 respectively).
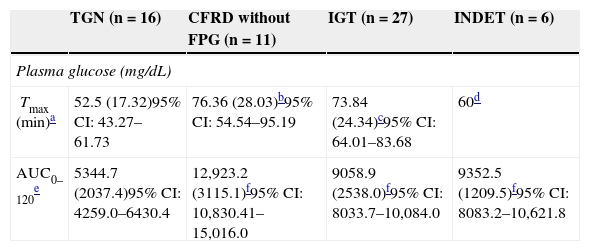
The time to glucose peak (Tmax minutes) was significantly shorter in patients with NGT as compared to all other categories (NGT 52.5min [17.32] vs 71.59min [24.39], t=−2.87, −19.09 [95% CI: −32.4, −5.78], p=0.005). Glucose Tmax of the CFRD without FPG and IGT groups was also significantly delayed as compared to the NGT (Table 3) but not the INDET group. Differences in AUC0–120 for glucose were also found between the NGT and all other categories (5344.7 [2037.4] vs 10,178.9 [3050.3], t=−5.87, −4834.2 [95% CI: −6484.1, −3184.3], p<0.001), and higher values were also reached in each of them as compared to NGT (Table 3).
Categories of carbohydrate disorders and plasma glucose parameters as a function of the area under the curve and time to peak concentration.
| TGN (n=16) | CFRD without FPG (n=11) | IGT (n=27) | INDET (n=6) | |
|---|---|---|---|---|
| Plasma glucose (mg/dL) | ||||
| Tmax (min)a | 52.5 (17.32)95% CI: 43.27–61.73 | 76.36 (28.03)b95% CI: 54.54–95.19 | 73.84 (24.34)c95% CI: 64.01–83.68 | 60d |
| AUC0–120e | 5344.7 (2037.4)95% CI: 4259.0–6430.4 | 12,923.2 (3115.1)f95% CI: 10,830.41–15,016.0 | 9058.9 (2538.0)f95% CI: 8033.7–10,084.0 | 9352.5 (1209.5)f95% CI: 8083.2–10,621.8 |
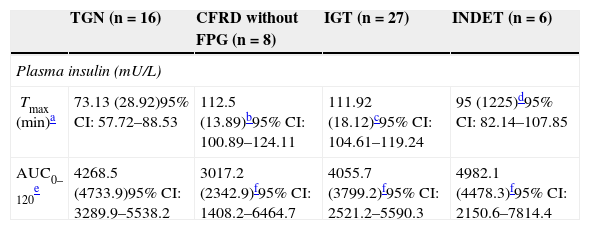
Plasma insulin Tmax (minutes) was even more delayed if patients had any carbohydrate metabolism disorder (NGT 73.13 [28.92] vs 109.50 [17.39], Z=4.37, p<0.001); it was particularly delayed in the IGT and all other categories (IGT 111.92 [18.12] vs 88.00 [28.33]; Z=3.58, p<0.001). In addition, these differences in Tmax for insulin persisted when NGT was compared to CFRD without FPG or IGT, but not in the case of INDET.
In AUC0–120 for insulin, no significant differences were found when the groups were compared to NGT (Table 4).
Categories of carbohydrate disorders and plasma insulin parameters as a function of the area under the curve and time to peak concentration, insulin resistance (HOMA-IR), and pancreatic β-cell function.
| TGN (n=16) | CFRD without FPG (n=8) | IGT (n=27) | INDET (n=6) | |
|---|---|---|---|---|
| Plasma insulin (mU/L) | ||||
| Tmax (min)a | 73.13 (28.92)95% CI: 57.72–88.53 | 112.5 (13.89)b95% CI: 100.89–124.11 | 111.92 (18.12)c95% CI: 104.61–119.24 | 95 (1225)d95% CI: 82.14–107.85 |
| AUC0–120e | 4268.5 (4733.9)95% CI: 3289.9–5538.2 | 3017.2 (2342.9)f95% CI: 1408.2–6464.7 | 4055.7 (3799.2)f95% CI: 2521.2–5590.3 | 4982.1 (4478.3)f95% CI: 2150.6–7814.4 |
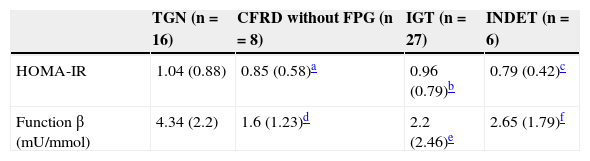
No significant differences were found in HOMA-IR values (Table 5) (NGT 1.04 [0.88] vs CFRD without FPG 0.85 [0.58]; Z=–0.45, p=0.68; vs IGT 0.96 [0.79], Z=–0.1, p=0.93; vs INDET 0.79 [0.42]; Z=–0.04, p=0.97).
Categories of carbohydrate disorders and insulin resistance parameters (HOMA-IR) and pancreatic β-cell function.
Statistical differences were however seen in the measurement of β-cell function (Table 5) when patients with NGT were compared to those with CFRD without FPG and IGT (NGT 4.34 [2.2]mU/mmol vs CFRD without FPG 1.6 [1.23]mU/mmol, t=3.24, 2.74 [95% CI: 0.98–4.5], p=0.004; vs IGT 2.2 [2.46]mU/mmol, t=2.78, 2.14 [95% CI: 0.58–3.69], p=0.008), but not in the INDET, which maintained a more preserved insulin secretion (vs INDET 2.65 [1.79]mU/mmol, t=1.66, 1.68 [95% CI: −0.44, −3.81], p=0.11).
DiscussionPancreatic β-cell dysfunction is one of the main physiopathogenetic factors in the development of CFRD.8,24 The first phase of insulin secretion in response to an intravenous glucose overload and to other insulin secretion stimuli is impaired in adults with CF. Such impairment has also been reported after oral glucose overload.8,25,26 The time required to reach peak insulin levels is delayed from 30–60min in healthy subjects to 90–120min in subjects with CFRD.8 This loss of the first phase of insulin secretion may occur even in subjects with CF and NGT.6,18,25,26
The results of our series are similar to those reported by Hammed et al.15 despite the use of methods not fully superimposable. In their study, the authors reported that glucose peak was reached at 60min in half the cases and at 90min in 33%; insulin peak was also delayed, occurring at 120min in 42% and at 90min in 24%.
It may thus be inferred that blood glucose peak is not reached in most CF patients at the classical time of 120min, as required for the diagnosis of CFRD. In this regard, further study of the importance of blood glucose values at the intermediate OGTT points is needed. It has been suggested that subjects with CF without CFRD already experience hyperglycemia at 30, 60, and 90min, but have blood glucose levels similar to healthy controls at baseline and 120min. Therefore, blood glucose levels at 60 and 90min could be more sensitive for detecting glucose intolerance in these patients.14 These results may be clinically relevant, because an association has recently been suggested between impaired lung function and the presence of hyperglycemia at the intermediate OGTT points–specifically with a blood glucose value at 60min higher than 140mg/dL–while no correlation was found between lung function and blood glucose values at 120min.16 With regard to this, there are several studies using continuous glucose monitoring systems as a method for early diagnosis in these patients, who would have a normal blood glucose profile using the OGTT.14,27,28
Glucose AUC0–120 in our series was greater in patients with some carbohydrate metabolism disorder as compared to the NGT group. These results are similar to those reported by other researchers.23,29,30
A comparison of blood glucose data in the OGTT in the year of diagnosis in the NGT group to the other categories found significant differences at the intermediate points, including at 30min in cases of CFRD. As suggested by Lee et al., the possibility of using a simpler test as a screening method should be studied. Lee et al.31 studied the glucose challenge test with 50g of glucose (1h-GCT), measuring blood glucose at 60min. Thirty-one patients with CF were given the 1h-GCT, and the OGTT 1 week later. Hyperglycemia was detected in 9 patients in both tests, but in 11 patients in the 1h-GCT only (blood glucose 140mg/dL), because they normalized blood glucose levels at 2h of the OGTT. The authors concluded that the 1h-CGT may be a helpful test for detecting postprandial hypoglycemia, and also for identifying patients with an impaired 2h-OGTT.
In our series, most patients showed an insulin peak at 90 and 120min. Several previous studies have shown changes in the first and second phases of insulin secretion using hyperglycemic clamp and the intravenous glucose tolerance test.29,32–36 Our results show significant differences in mean time to the insulinemic peak, which was shorter in subjects with NGT, but no differences were found in AUC0–120 (i.e. in total insulin secretion). In other words, the characteristic of patients with CF and a carbohydrate metabolism disorder is delayed insulin secretion, rather than the total insulin amount produced. Battezzati et al.33 found that insulin production during the OGTT reached levels similar to healthy controls, despite β-cell dysfunction and impaired insulin secretion in the early phase in patients with CF, and suggested that the absolute insulin secretion rate (or insulin AUC0–120) is not an accurate measure for describing the effects on β-cell function, and that delayed insulin secretion and total secretion are different factors affecting glucose tolerance. However, other authors found a decrease in total insulin secretion when AUC0–120 in CF patients and healthy controls was compared.23,37
In our series, patients with NGT had better β-cell function than patients with CFRD without FPG or IGT. The INDET group had better preserved insulin secretion, and there were no significant differences. Yung et al.23 studied in their series a subgroup of 30 CF patients with different diagnostic categories of carbohydrate disorders and 16 healthy controls, and noted that β-cell function was decreased in subjects with CF as compared to healthy controls (p<0.001). Patients with CF also had significantly higher blood glucose levels at 90min as compared to healthy controls, but both groups had similar blood glucose levels at 120min.
As regards HOMA-IR, values suggesting insulin resistance were not found in any group. This method was first reported by Matthew et al. in 1985,21 and has been used to test insulin resistance in patients with type 2 diabetes and non-diabetics, although it has not been defined as an accurate method in insulin deficiency states.38 The results of this index should be interpreted with caution, because both normal and decreased peripheral sensitivity states, increased sensitivity but with decreased hepatic sensitivity, and decreased hepatic sensitivity have been reported in patients with CF.19
In this regard, Yung et al.23 studied the implication of insulin resistance in diabetes development in 68 adults with CF without CFRD and 46 healthy controls, and found no significant differences either in mean HOMA-IR values as compared to healthy controls or between the different diagnostic categories of carbohydrate metabolism disorders. Other authors studied the hyperinsulinemic–euglycemic clamp in patients with CF and found no impaired insulin sensitivity.39,40
Our series had design limitations. A retrospective study was conducted without a control group of healthy patients and with a relatively small patient sample, which may have affected its statistical power and did not allow for adjustment for other values (such as sex or age). In addition, a part of the sample consisted of adolescents, and their unique characteristics may have influenced the analysis of the variables. However, we think that the results obtained were comparable in several aspects to series where higher numbers of patients were analyzed.
ConclusionsAs regards OGTT characteristics, blood glucose peak was reached at intermediate points rather than at the classical times of 0 and 120min in half of the cases. We therefore suggest that intermediate time points of the curve may provide relevant information for assessing metabolic status in these patients. Prospective studies to analyze the relationship of hyperglycemia at these intermediate points to clinical and lung function impairment in CF are needed.
When the homeostasis model HOMA-IR was used, no relevant role of insulin resistance in the clinical stability phase was found in these patients.
Patients with some diagnostic impairment had pancreatic β-cell dysfunction, with a delay occurring in the early phase of insulin secretion with no differences in total insulin production (AUC0–120).
Conflict of interestThe authors state that there are no conflicts of interest that could be perceived as detrimental to the impartiality of the research published.
Please cite this article as: Cano Megías M, González Albarrán O, Guisado Vasco P, Lamas Ferreiro A, Máiz Carro L. Resistencia insulínica, disfunción de la célula β pancreática y diferencias en los puntos intermedios de las curvas de glucemia e insulina tras una sobrecarga oral estándar de glucosa en adultos con fibrosis quística. Endocrinol Nutr. 2015;62:91–99.
