


To assess the relationship of epicardial adipose tissue (EAT) thickness with cardiometabolic risk factors (CRFs) in children and adolescents.
MethodsSeventy-seven subjects of both sexes aged 7–18 years were selected. Medical history, clinical parameters, and glucose, insulin, and lipid levels were collected. EAT thickness was measured using transthoracic echocardiography. Study subjects were divided into two groups based on whether they had less than two or two or more CRFs.
ResultsThe group with two or more CRFs had higher EAT thickness, insulin, and HOMA-IR values (p<0.05). EAT thickness showed a statistically significant positive correlation with body mass index (BMI) (r=0.561, p=0.0001), waist circumference (r=0.549, p=0.0001), systolic blood pressure (SBP) (r=0.256, p=0.028), insulin (r=0.408, p=0.0001), and HOMA-IR (r=0.325, p=0.005). However, these correlations were not significant after adjustment for BMI. The cut-off point for EAT thickness as predictor of two or more CRFs was 3.17mm. The risk (odds ratio) of having two or more CRFs if EAT thickness was >3.17mm was 3.1 (95% CI: 1.174–8.022). BMI was the independent variable that most affected EAT thickness and the presence of two or more CRFs.
ConclusionIn this group of children and adolescents, the relationship of EAT thickness with CRFs was found to be dependent on BMI.
Determinar la relación del espesor del tejido adiposo epicárdico (TAE) con factores de riesgo cardiometabólico (FRC) en niños y adolescentes.
MétodosSe seleccionaron 77 sujetos de ambos sexos entre 7 y 18 años. Se realizó anamnesis y evaluación de parámetros clínicos, determinación de glucemia, insulina y lípidos y se calculó el HOMA-IR. Se determinó el espesor del TAE mediante ecocardiografía transtorácica. Se formaron 2 grupos, participantes con menos de 2 FRC (cero o un FRC) y participantes con 2 o más FRC.
ResultadosEl grupo con 2 o más FRC presentó mayores valores de espesor del TAE, insulina y HOMA-IR (p<0,05). El espesor del TAE mostró una correlación positiva estadísticamente muy significativa con el índice de masa corporal (IMC) (r=0,561; p=0,0001), la circunferencia abdominal (r=0,549; p=0,0001), la presión arterial sistólica (PAS) (r=0,256; p=0,028), la insulina (r=0,408; p=0,0001) y el HOMA-IR (r=0,325; p=0,005), sin embargo, estas correlaciones fueron no significativas al ajustar para el IMC. El punto de corte para el espesor del TAE como predictor de 2 o más FRC fue de 3,17mm. El riesgo (odds ratio) de tener 2 o más FRC si presenta un espesor de TAE>3,17mm fue de 3,1 (IC: 1,174–8,022, p=0,02). El IMC fue la variable independiente que más influyó sobre los valores del espesor del TAE y la presencia de 2 o más FRC.
ConclusiónEn este grupo de niños y adolescentes se encontró que la relación del TAE con los FRC es dependiente del IMC.
Different studies have shown that obesity, together with other cardiometabolic risk factors (CRFs), is associated with subclinical markers of atherosclerosis in children and adolescents,1,2 and with early mortality in adulthood.3,4
Interest in organ-specific adiposity has increased rapidly in recent years. In this context, epicardial adipose tissue (EAT), the visceral fat of the heart, has emerged as a new cardiometabolic risk marker because of its close anatomical proximity to the myocardium and coronary artery, its endocrine and metabolic properties, and its diagnostic and therapeutic value.5
EAT thickness is consistently associated with metabolic syndrome (MS) and its components,6,7 but changes markedly with age and between subjects from different ethnic groups, which has prevented agreement on a single general cut-off point for predicting the risk of MS.8,9 In Venezuela EAT thickness greater than 5mm was shown to have a good sensitivity and specificity for predicting MS10; that study, however, was conducted in an adult population, and its results are therefore not applicable to children and adolescents.
A significant correlation has been shown in obese children between EAT thickness and other anthropometric variables such as the body mass index (BMI) and abdominal circumference (AC).11 Kim et al.12 similarly showed that EAT thickness measured by echocardiography is a practical and accurate marker of visceral obesity in adolescents. In fact, sedentary adolescents have been shown to have greater EAT thickness as compared to non-sedentary ones, and each 1-mm increase in EAT thickness increases sevenfold the risk of visceral obesity.13
Recently, a 2.2% prevalence of MS has been reported in children and adolescents from Mérida, Venezuela; however, this population has a high frequency of abdominal obesity, hypertriglyceridemia, and high blood pressure.14 No prior studies assessing EAT thickness in our children and adolescents are available. This study was therefore undertaken to assess EAT thickness in children and adolescents with CRFs, to ascertain to what extent our results were consistent with the few data available, and thus to make better use of the currently available diagnostic tools.
Materials and methodsSubjectsThis was an observational, cross-sectional, analytical study. Participating subjects were selected from the outpatient clinics of endocrinology, nutrition, growth and pediatric development of the Instituto Autónomo Hospital Universitario de los Andes and the general population of Mérida, Venezuela. When sample size was considered, no studies were found comparing EAT thickness between children and adolescents, and estimation was therefore based on obese and non-obese data. Specifically, EAT thickness data from Mazur et al.11 were used: 2.5±0.81mm for non-obese children and 5.5±1.98mm for obese children, with an α error of 0.05 and a β error of 0.20. The final sample size was 30 subjects per group. Overweight and obese subjects are known to have a greater frequency of CRFs than subjects with normal weight. Thus, overweight and obese individuals of both sexes aged 6–18 years of age were initially enrolled sequentially, and age- and sex-matched subjects with normal weight were subsequently selected to obtain comparable groups, which only differed in the number of CRFs. The participants came from different clinics and from the general population. Subjects with primary hyperlipidemia and endocrine diseases such as diabetes mellitus, hypothyroidism, and Cushing's syndrome, as well as any comorbidity or intake of drugs (glucocorticoids, lipid-lowering, antiepileptic) that could affect the tested variables were excluded from the study.
The subjects were split into two groups based on the presence of CRFs: a control group consisting of subjects with less than two CRFs (no or one CRF) and a study group consisting of subjects with two or more CRFs. The CRFs considered included basal blood glucose≥100mg/dL (fasting hyperglycemia); AC>P90 (respective age and sex-abdominal obesity); systolic (SBP) and/or diastolic blood pressure (DBP)>P90 (respective age and sex-preHBP and HBP); triglycerides>P90 (respective age and sex-hypertriglyceridemia); HDL-C<P10 (respective age and sex-low HDL-C); and LDL-C>P90 (respective age and sex-hypercholesterolemia). The percentile distribution of the local population obtained in the CREDEFAR study was used as a reference.14,15 In compliance with ethical guidelines in the Declaration of Helsinki, only children and adolescents whose legal representative agreed to participation and signed the informed consent were enrolled into the study.
ProcedureClinical evaluationWeight and height were measured under fasting conditions and with subjects in their underwear. The body mass index (BMI) was calculated as weight divided by squared height. Obesity was defined as a BMI>P97 for age and sex in the curves for Venezuelan children and adolescents prepared by FUNDACREDESA,16 overweight as BMI values >P90 and ≤P97, normal weight as a BMI ranging from P10 to P90, and low weight as BMI<P10. The Z-score of the BMI was determined.17 Abdominal circumference (AC) was measured in centimeters at the end of an expiration, with the subjects standing, at the level of the midline between the lower margin of the last rib and the iliac crest. Pubertal development was determined based on the Tanner stage in breast and pubic hair in girls, and in genitalia and pubic hair in boys. Subjects were considered prepubertal if they had no secondary sexual characteristics (Tanner I), while those with some secondary characteristics (Tanner stages II–IV) or who had reached full puberty (stage V) were considered to be undergoing puberty or pubertal. Blood pressure was measured in the right arm by the auscultatory procedure using a standard mercury sphygmomanometer. A cuff adequate for the size of the upper arm of the child was used. Systolic and diastolic blood pressure was measured three times after a 10-min rest in the supine position.
Biochemical variablesA blood sample was drawn from the antecubital vein, after fasting for at least 10h, to measure blood glucose, uric acid, and lipids (total cholesterol, triglycerides, and HDL-C). Tests were performed using enzymatic methods with a Hitachi 911® autoanalyzer and Cienvar reagents. LDL-C was estimated using the Friedewald equation, where LDL-C=total cholesterol−(HDL-C+[triglycerides/5]). Non-HDL cholesterol (non-HDL-C) was estimated as total cholesterol−HDL-C. The triglyceride/HDL-C (Tg/HDL-C), total cholesterol/HDL-C (TC/HDL-C), and LDL-C/HDL-C ratios were calculated. A serum aliquot was stored at −20°C, and fasting insulin levels were subsequently measured by immunoassay (ELISA) using commercial kits from DRG Instruments GmbH, Germany, with intra-assay and inter-assay coefficients of variation ranging from 1.8% to 2.6% and from 2.9% to 6% respectively. Tests were performed at the hormone laboratory of IAHULA. Under conditions of strict quality control. These data were used to assess insulin resistance using the Homeostasis Model Assessment (HOMA) formula: HOMA-IR=fasting insulin (μIU/mL)×fasting glucose (mmol/L)/22.5. High basal insulin values were defined as those higher than 12μU/mL, and high HOMA-IR values as those higher than 2.5. Both values are >P95 of a representative sample of children and adolescents from the city of Mérida (CREDEFAR study).18
Echocardiographic measurement of epicardial adipose tissueA two-dimensional (2D) transthoracic echocardiogram using a standard procedure was performed, with the patient in the left lateral decubitus position. EAT thickness was measured by a pediatric echocardiographer using the procedure validated by Iacobellis et al.19
EAT was identified as the echolucent space between the external wall of the myocardium and the visceral layer of the pericardium. This thickness was measured perpendicularly on the free wall of the right ventricle at the end of systole in three cardiac cycles, using a parasternal long or parasternal short axis view. Measurement was taken on the free wall of the right ventricle for two reasons: (1) this point is anatomically recognized as the one with the greatest epicardial fat thickness, and (2) the parasternal long and parasternal short axes allow for more accurate measures of EAT on the right ventricle, with an optimum slide orientation in each view.20,21
Statistical analysisContinuous variables are given as mean±standard deviation, and categorical variables as numbers and percentages. A Chi-square test was used to assess potential sex-related differences between the groups and to establish associations between the categorical variables. In order to determine the difference in the means of the continuous variables between subjects with less and more than two CRFs, a Student's t test for independent data was used for normally distributed variables, and a Mann–Whitney U test was used for non-normally distributed variables (glucose, total cholesterol, LDL-C, non-HDL-C, insulin, and HOMA-IR). A receiver operating curve (ROC) was constructed to determine the cut-off point of EAT thickness for predicting the presence of two or more CRFs; for this, an area under the curve (AUC) of 1.00 was considered as optimum, an AUC ranging from 0.90 to 0.97 as very good, an AUC from 0.75 to 0.90 as good, and an AUC from 0.60 to 0.75 as fair. AUCs under 0.60 were considered to be a poorly valid test. To estimate the optimum cut-off point from ROC, the Youden index was calculated using the formula: (J=sensitivity+specificity−1=S−[1−Sp]). A Pearson's correlation matrix was performed between the quantitative variables. A linear regression analysis was also performed, with EAT as the dependent variable, to determine which variable had greater statistical significance, as well as a logistic regression analysis with or without two or more CRFs as the dependent variable and EAT thickness and BMI as the independent variables, in order to determine which of them had greater statistical significance for the presence of CRFs. SPSS version 19.0 for Windows was used for statistical analysis, and a value of p<0.05 was considered statistically significant.
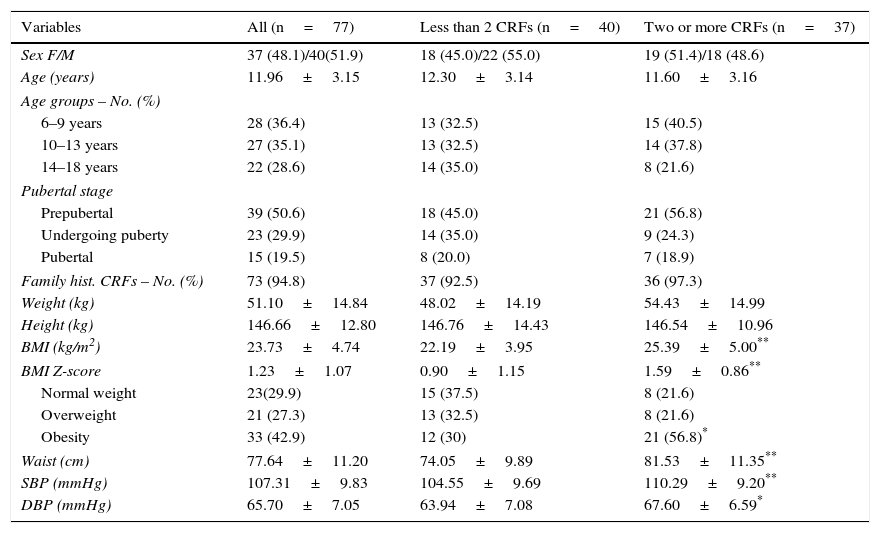
ResultsSeventy-seven children and adolescents were enrolled into the study. The group with less than two CRFs consisted of 40 subjects, 45% girls and 55% boys, with a mean age of 12.30±3.14 years; 32.5% were 6–9 years old, 32.5% were 10–13 years old, and 35% were 14–18 years old. Forty-five percent of the subjects were prepubertal (Tanner stage I), 35% were undergoing puberty (Tanner stages II–IV), and 20% were pubertal (Tanner stage V). The mean BMI was 22.19±3.95kg/m2, and the BMI Z-score was 0.9±1.15. The group with less than two or more CRFs consisted of 37 subjects, 51.4% girls and 48.6% boys, with a mean age of 11.60±3.16 years; 40.5% were 6–9 years old, 37.8% were 10–13 years old, and 21.6% were 14–18 years old; 56.8% of these subjects were prepubertal, 24.3% were undergoing puberty, and 18.9% were pubertal; the mean BMI was 25.39±5.00kg/m2, and the BMI Z-score was 1.59±0.86. There were no statistically significant differences between the groups in distribution by sex, age, pubertal stage, family history of CRFs, weight, or height. The BMI, AC, SBP, and DBP were significantly higher in the group with more than two CRFs (p<0.05 for SBP and p<0.009 for all other variables). There were 23 (29.9%) participants with normal weight, 21 (27.3%) with overweight, and 33 (42.9%) with obesity, and a significantly greater frequency of participants with obesity was found in the group with two or more CRFs (p<0.05) (Table 1).
Demographic and clinical data of patients categorized based on the presence of cardiometabolic risk factors (CRFs).
| Variables | All (n=77) | Less than 2 CRFs (n=40) | Two or more CRFs (n=37) |
|---|---|---|---|
| Sex F/M | 37 (48.1)/40(51.9) | 18 (45.0)/22 (55.0) | 19 (51.4)/18 (48.6) |
| Age (years) | 11.96±3.15 | 12.30±3.14 | 11.60±3.16 |
| Age groups – No. (%) | |||
| 6–9 years | 28 (36.4) | 13 (32.5) | 15 (40.5) |
| 10–13 years | 27 (35.1) | 13 (32.5) | 14 (37.8) |
| 14–18 years | 22 (28.6) | 14 (35.0) | 8 (21.6) |
| Pubertal stage | |||
| Prepubertal | 39 (50.6) | 18 (45.0) | 21 (56.8) |
| Undergoing puberty | 23 (29.9) | 14 (35.0) | 9 (24.3) |
| Pubertal | 15 (19.5) | 8 (20.0) | 7 (18.9) |
| Family hist. CRFs – No. (%) | 73 (94.8) | 37 (92.5) | 36 (97.3) |
| Weight (kg) | 51.10±14.84 | 48.02±14.19 | 54.43±14.99 |
| Height (kg) | 146.66±12.80 | 146.76±14.43 | 146.54±10.96 |
| BMI (kg/m2) | 23.73±4.74 | 22.19±3.95 | 25.39±5.00** |
| BMI Z-score | 1.23±1.07 | 0.90±1.15 | 1.59±0.86** |
| Normal weight | 23(29.9) | 15 (37.5) | 8 (21.6) |
| Overweight | 21 (27.3) | 13 (32.5) | 8 (21.6) |
| Obesity | 33 (42.9) | 12 (30) | 21 (56.8)* |
| Waist (cm) | 77.64±11.20 | 74.05±9.89 | 81.53±11.35** |
| SBP (mmHg) | 107.31±9.83 | 104.55±9.69 | 110.29±9.20** |
| DBP (mmHg) | 65.70±7.05 | 63.94±7.08 | 67.60±6.59* |
Data are means±SD or No. (%).
BMI, body mass index; DBP, diastolic blood pressure; SBP, systolic blood pressure.
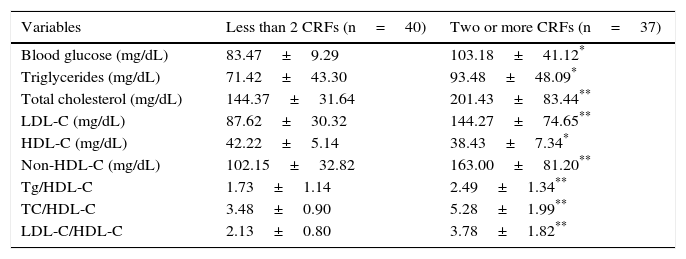
An analysis of the biochemical variables showed that the group of subjects with two or more CRFs had significantly higher values of blood glucose, triglycerides (p<0.05), total cholesterol, and LDL-C, as well as Tg/HDL-C, TC/HDL-C, and LDL-C/HDL-C ratios (p<0.005), than the group with less than two CRFs, while plasma HDL-C levels were significantly lower in the group of children and adolescents with two or more CRFs (p<0.05) (Table 2). The most common risk factor was abdominal obesity (50.6%), followed by hypercholesterolemia (27.3%), high blood pressure (24.7%), decreased HDL-C (24.7%), and hypertriglyceridemia (22.1%). The least common risk factor was hyperglycemia (13%).
Biochemical variables of subjects categorized based on the presence of cardiometabolic risk factors (CRFs).
| Variables | Less than 2 CRFs (n=40) | Two or more CRFs (n=37) |
|---|---|---|
| Blood glucose (mg/dL) | 83.47±9.29 | 103.18±41.12* |
| Triglycerides (mg/dL) | 71.42±43.30 | 93.48±48.09* |
| Total cholesterol (mg/dL) | 144.37±31.64 | 201.43±83.44** |
| LDL-C (mg/dL) | 87.62±30.32 | 144.27±74.65** |
| HDL-C (mg/dL) | 42.22±5.14 | 38.43±7.34* |
| Non-HDL-C (mg/dL) | 102.15±32.82 | 163.00±81.20** |
| Tg/HDL-C | 1.73±1.14 | 2.49±1.34** |
| TC/HDL-C | 3.48±0.90 | 5.28±1.99** |
| LDL-C/HDL-C | 2.13±0.80 | 3.78±1.82** |
Data are means±SD.
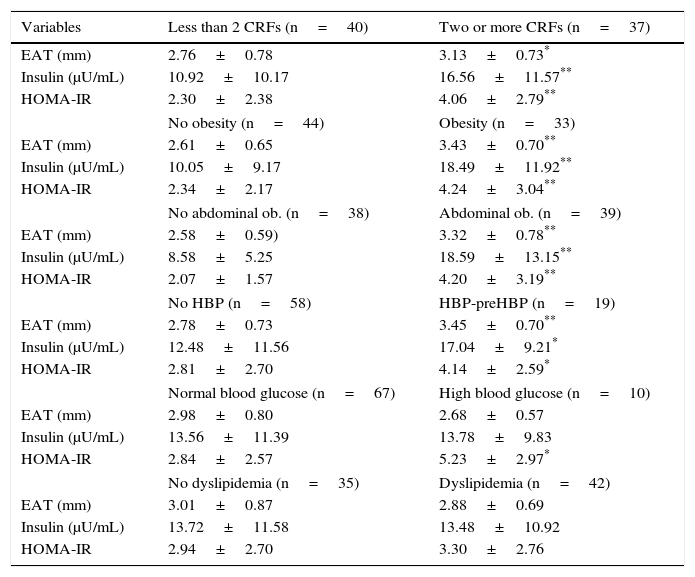
Table 3 shows that the group of subjects with two or more CRFs had greater EAT thickness (3.13 vs 2.76mm), basal insulin (16.56 vs 10.92μU/mL), and HOMA-IR (4.06 vs 2.30) values as compared to participants with less than two CRFs (p<0.05). Higher values of EAT (p<0.001), insulin, and HOMA-IR (p<0.001 and p<0.05) were also seen in the group with obesity, abdominal obesity, and HBP-preHBP. HOMA-IR values were higher in participants with fasting hyperglycemia (p<0.05).
Epicardial adipose tissue (EAT), basal insulin, and HOMA-IR values in patients categorized based on the presence of cardiovascular risk factors (CRFs).
| Variables | Less than 2 CRFs (n=40) | Two or more CRFs (n=37) |
|---|---|---|
| EAT (mm) | 2.76±0.78 | 3.13±0.73* |
| Insulin (μU/mL) | 10.92±10.17 | 16.56±11.57** |
| HOMA-IR | 2.30±2.38 | 4.06±2.79** |
| No obesity (n=44) | Obesity (n=33) | |
| EAT (mm) | 2.61±0.65 | 3.43±0.70** |
| Insulin (μU/mL) | 10.05±9.17 | 18.49±11.92** |
| HOMA-IR | 2.34±2.17 | 4.24±3.04** |
| No abdominal ob. (n=38) | Abdominal ob. (n=39) | |
| EAT (mm) | 2.58±0.59) | 3.32±0.78** |
| Insulin (μU/mL) | 8.58±5.25 | 18.59±13.15** |
| HOMA-IR | 2.07±1.57 | 4.20±3.19** |
| No HBP (n=58) | HBP-preHBP (n=19) | |
| EAT (mm) | 2.78±0.73 | 3.45±0.70** |
| Insulin (μU/mL) | 12.48±11.56 | 17.04±9.21* |
| HOMA-IR | 2.81±2.70 | 4.14±2.59* |
| Normal blood glucose (n=67) | High blood glucose (n=10) | |
| EAT (mm) | 2.98±0.80 | 2.68±0.57 |
| Insulin (μU/mL) | 13.56±11.39 | 13.78±9.83 |
| HOMA-IR | 2.84±2.57 | 5.23±2.97* |
| No dyslipidemia (n=35) | Dyslipidemia (n=42) | |
| EAT (mm) | 3.01±0.87 | 2.88±0.69 |
| Insulin (μU/mL) | 13.72±11.58 | 13.48±10.92 |
| HOMA-IR | 2.94±2.70 | 3.30±2.76 |
Data are means±SD.
The ROC for the group of children and adolescents categorized based on the presence of CRFs had an AUC of 0.64 (95% CI: 0.52–0.77), which rates the test as fair. The cut-off point of EAT thickness as a predictor of two or more CRFs was 3.17mm (J=0.267), with a 55.6% sensitivity and a 71.1% specificity (Fig. 1A). The indirect relative risk or odds ratio of an individual having two or more risk factors if he/she had an elevated EAT thickness, taking as reference the cut-off point of 3.17mm obtained in the ROC analysis, was 3.1-fold greater than that of subjects with a lower value (95% CI: 1.174–8.022; p=0.020).

A correlation analysis found that EAT, measured in millimeters, had a highly significant positive correlation to the BMI (r=0.561; p=0.0001), SBP (r=0.256; p=0.028), plasma insulin levels (r=0.408; p=0.0001), and HOMA-IR (r=0.325; p=0.005) (Fig. 2). EAT also positively correlated to AC (r=0.549; p=0.0001). No correlation was found between EAT and lipid variables. On the other hand, a very significant correlation was seen between the BMI and SBP (r=0.423; p=0.0001), insulin (r=0.460; p=0.0001), and HOMA-IR (r=0.418; p=0.0001) (Fig. 3). Adjusted or controlled partial correlations were performed for the BMI, and significant correlations of EAT with abdominal circumference, SBP, insulin, and HOMA-IR were seen to lose their significance.


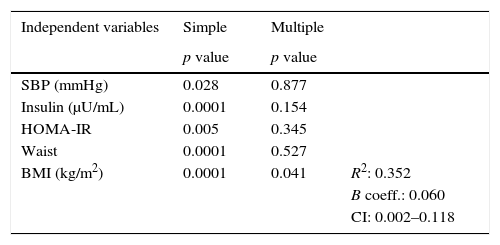
In the simple linear regression analysis with EAT thickness as the dependent variable, SBP, insulin, HOMA-IR, AC, and the BMI were significant. In the multiple linear regression analysis, however, SBP, insulin, HOMA-IR, and AC lost statistical significance, while BMI significance persisted (p=0.041), being the variable which had the greatest impact on EAT thickness, with an R-squared of 0.352, which meant that the BMI accounted for 35% of EAT (Table 4).
Simple and multiple linear regression analysis of variables related to EAT thickness as the dependent variable.
| Independent variables | Simple | Multiple | |
|---|---|---|---|
| p value | p value | ||
| SBP (mmHg) | 0.028 | 0.877 | |
| Insulin (μU/mL) | 0.0001 | 0.154 | |
| HOMA-IR | 0.005 | 0.345 | |
| Waist | 0.0001 | 0.527 | |
| BMI (kg/m2) | 0.0001 | 0.041 | R2: 0.352 |
| B coeff.: 0.060 | |||
| CI: 0.002–0.118 |
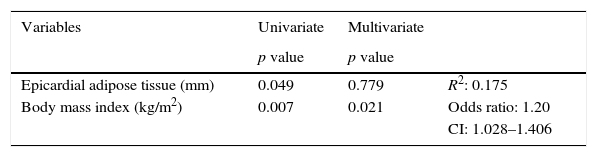
A logistic regression analysis with or without two or more CRFs as the dependent variable and EAT thickness and BMI as independent variables was performed to determine which of them had greater statistical significance for the presence of CRFs. It was found that in the univariate analysis, both EAT and BMI were significant. In the multivariate analysis, however, EAT lost significance, and it was therefore established that the BMI had a greater influence, with an R2 of 0.175 and an indirect relative risk or odds ratio of 1.20 (95% CI: 1.028–1.406) (Table 5).
Logistic regression analysis with or without two CRFs as the dependent variable and EAT thickness and body mass index as independent variables.
| Variables | Univariate | Multivariate | |
|---|---|---|---|
| p value | p value | ||
| Epicardial adipose tissue (mm) | 0.049 | 0.779 | R2: 0.175 |
| Body mass index (kg/m2) | 0.007 | 0.021 | Odds ratio: 1.20 |
| CI: 1.028–1.406 |
The main findings of this study include: (1) children and adolescents with two or more CRFs have greater EAT thickness as compared to the group with less than two CRFs; (2) the cut-off point of EAT thickness that makes it possible to predict the presence of two or more CRFs is 3.17mm; (3) a positive correlation exists between EAT thickness and other anthropometric (BMI, AC), clinical (SBP), and biochemical (insulin and HOMA-IR) variables, which is lost after the adjustment of correlation for the BMI; (4) the BMI was the variable with the greatest impact on EAT thickness and the occurrence of two or more CRFs.
No prior studies are available in Venezuela assessing EAT thickness in children and adolescents, but in Latin America Cabrera-Rego et al.22 showed greater EAT thickness (2.76±1.2 vs 1.36±0.7mm, p=0.001) in obese children and adolescents as compared to a control group. These results agree with those of our study, which showed that subjects with two or more CRFs had greater EAT values than those with less than 2 CRFs (3.13 vs 2.76mm), and that obese children and adolescents had values significantly higher than non-obese subjects (3.43 vs 2.61mm).
To the best our knowledge, there have been no previous studies proposing cut-off points of EAT for predicting the presence of CRFs in a Latin American pediatric population. In a European population, Abaci et al.23 showed that EAT thickness greater than 4.1mm had a 90% sensitivity and a 61% specificity for predicting insulin resistance in children with obesity. Cena et al.13 recently reported that, in a population of 102 Italian male adolescents, the optimum cut-off point of EAT thickness predicting for visceral obesity was 3.2mm. This value is similar to the cut-off point of EAT found in our study as a predictor of the presence of two or more CRFs (3.17mm). These small differences were previously reported in an adult population, and may be due to ethnic differences in body fat distribution.9
Our results agree with those reported in other studies showing that EAT, measured by echocardiography, is related from childhood to the anthropometric, clinical, and biochemical components of MS.11,12,24 Insulin resistance is considered the core of MS. In this regard, a two-fold greater release rate of fatty acids by epicardial adipocytes as compared to perirenal fat has been reported in animal models. This suggests high lipolytic activity that is probably due to the reduced antilipolytic effect of insulin in this tissue and an increased expression of β-adrenergic receptors, especially β-3 receptors, whose stimulation activates lipolysis and increases the release of free fatty acids able to promote blood pressure increase through different pathways, including adrenergic stimulation, increased oxidative stress, endothelial dysfunction, and vascular cell growth.25,26 These observations explain the correlation between EAT and SBP, and suggest that epicardial fat is a tissue with high insulin resistance. This is supported by the fact that, as in prior studies, a significant correlation was seen between EAT thickness, basal plasma insulin concentration, and HOMA-IR. In addition, Manco et al.27 showed in obese prepubertal and pubertal children that at an early age, EAT is a significant marker of increased insulin resistance.
The multiple linear regression analysis showed that the BMI was the variable that most influenced EAT thickness. This results confirms that obesity is a factor predisposing to epicardial fat increase.5,28 As a novel contribution in this regard, recent research has proposed EAT as a therapeutic target for different interventions in obese patients.13,29 It should be emphasized that while AC is universally considered to be the most accessible visceral fat marker, in this study the BMI had a greater influence on EAT thickness. It has also been shown that the BMI was the variable with the greatest impact on CRF occurrence. These findings agree with those reported by Schusterova et al.24 in children and adolescents with overweight and obesity. These authors showed that the coefficients of correlation of EAT with various CRFs are similar to or better than those of AC, but are not greater than those seen with the BMI. This suggests that EAT thickness measured by echocardiography is not a stronger indicator of cardiometabolic risk in childhood than the BMI.
In conclusion, in this group of children and adolescents, the relationship of EAT to CRFs was found to be dependent on the BMI, and the BMI was established as the dependent variable which most influenced EAT thickness.
FundingThis study was conducted in part thanks to funding received from the Council of Scientific, Humanistic, Technological, and Art Development of Universidad de Los Andes (CDCHTA-ULA) under projects M-1013-11-07-AA and ADG M-10, and also from the National Fund for Science, Technology and Innovation (FONACIT) of the Ministry of Popular Power for Science, Technology and Innovation under project no. 2012000970.
Please cite this article as: Reyes Y, Paoli M, Camacho N, Molina Y, Santiago J, Lima-Martínez MM. Espesor del tejido adiposo epicárdico en niños y adolescentes con factores de riesgo cardiometabólico. Endocrinol Nutr. 2016;63:70–78.
