


To quantify dietary intake of secondary education students in Badajoz, Spain, evaluating food frequency use in teenagers of both sexes.
Material and methodsThe study sample consisted of 1197 secondary education students (49.9% male and 50.1% female). After giving informed consent, they completed a self-administered food frequency questionnaire (FFQ) including 51 food items divided into five separate categories. This questionnaire was modified from the one used at the Valencian Community in 2003 and previously validated in a pilot study on 374 students.
ResultsMale and females students reported higher intakes of 70.6% and 17.6% of foods analyzed, respectively, while intake of 11.8% of food items was similar in both sexes. Sex differences were statistically significant for 35% of foods (of which 72% and 28% were taken more frequently by males and females, respectively). Intake of milk and dairy products appeared to be adequate, while intake of fish and seafood was low and consumption of meat products was high. Intake of vegetables, fruits, bread, and cereals was below the recommended levels. Intake of pasta, rice, and oils was adequate, and consumption of cookies or industrial pastries was not high. There was an excess intake of sweets, but intake of soft drinks was not high.
ConclusionsThese results show intermediate values as compared to other national surveys.
El objetivo del estudio ha sido cuantificar la ingesta dietética de los estudiantes de la educación secundaria obligatoria de Badajoz, España, evaluando la frecuencia de consumo entre adolescentes de diferentes géneros.
Material y métodoEn el estudio ha participado una muestra de 1.197 alumnos de enseñanza secundaria obligatoria (49,9% hombres y 50,1% mujeres). Se pasó un cuestionario de frecuencia de consumo de alimentos autoadministrado (CFCA) con 51 alimentos, dividido en 5 categorías independientes, desarrollado a partir del empleado en la Comunidad Valenciana en 2003, y previamente validado en un estudio piloto con 374 alumnos, tras obtener consentimiento informado.
ResultadosEn un 70,6% de los alimentos analizados el consumo es mayor en los varones, mientras solamente en un 17,6% es mayor en las mujeres; un 11,8% de productos se consumen por igual. En el 35% de los alimentos las diferencias entre géneros fueron estadísticamente significativas (72% de ellos fueron superiores en los varones y el 28% en las mujeres). Parece haber un consumo adecuado de leche y productos lácteos, bajo de pescados y productos marinos, y elevado de productos cárnicos. La ingesta de verduras, hortalizas, frutas, pan y cereales está por debajo de las recomendaciones. El consumo de pasta, arroz y aceites es adecuado, no observándose un consumo elevado de galletas ni de bollería industrial. La ingesta de dulces y golosinas es excesiva, aunque la de bebidas azucaradas y gaseosas no es alta.
ConclusionesEstos resultados muestran valores intermedios con respecto a otros estudios realizados a nivel nacional.
Dietary habits are among the lifestyle components which have the greatest impact on health, physical development and growth, reproduction, and physical and intellectual performance. Hygiene habits that will form the basis of feeding behavior are gradually created and acquired during childhood and adolescence.1,2 The sooner they are acquired, the easier it will be to maintain them, and the trend to a later development of a wide range of diseases will decrease, and they will contribute to improving both the quality of life and levels of achievement in different spheres of life.3
However, most adolescents do not have dietary information adequate enough to allow them to follow a balanced diet, and their decisions are influenced by a number of factors which are often incompatable with regular and sensible dietary patterns.4 And it is at this time of life that internal, environmental, family, cultural, and social conditions exert their full influence on personality and feeding behavior.5,6
The Mediterranean diet is characterized by a high consumption of food of vegetable origin and a lower intake of food of animal origin. This substantially reduces the intake of saturated fat and, thus, the development of degenerative diseases, chronic inflammatory conditions, cancer, atherosclerosis, etc.7 In recent decades, however, Spanish adolescents, and those of industrialized Western countries in general, have gradually abandoned this diet and this has led in turn to an energy imbalance due to increased energy provision, mainly through the intake of saturated fatty acids (SFAs), and to decreased energy expenditure,8 which has contributed to increased obesity and cholesterol levels.5,9 Thus, several authors have reported an inadequate and imbalanced diet, not consistent with Spanish and international recommendations,15 in adolescents from different geographic areas of Spain.4,10–14
Adolescents aged 14–17 years are the group at the greatest nutritional risk despite the fact that they eat their main meals at home. It should be noted that, although girls follow a better quality diet than boys,14 they are also at greater nutritional risk.16,17 For these reasons, the intervention of both parents and adolescents in dietary education is required.18,19
Nutritional epidemiological studies were first conducted a few decades ago and have led to the development of the current methodology required to rigorously characterize the intake of individuals and populations.20 Estimating dietary intake is a very important element when making a nutritional diagnosis. The most commonly used method in individual analytical epidemiology is the food frequency questionnaire (FFQ), a relatively quick, simple, and inexpensive tool administered by post or self-completed that estimates usual intake and does not require trained interviewers.21
The main objective of this study was to quantify the dietary intake of obligatory secondary education (OSE) students in Badajoz, comparing the frequency of consumption between adolescents of both sexes.
Materials and methodsSample selectionA descriptive, quantitative, non-experimental, cross-sectional, epidemiological study was conducted. The study sample was recruited by cluster random sampling using class groups as reference. A representative sample of Badajoz OSE students was thus obtained. A formula for calculating sample size for finite and known populations, with a confidence level of two Z units (CI=95.4%), a variance (p=q=0.5) as worst scenario, and a margin of error of ±2.5% was used. A total of 1197 participants, 49.9% males (n=597) and 50.1% females (n=600), aged 12–18 years, were surveyed.
Collection of informationA semiquantitative FFQ used for the “Nutrition and Health Survey” in the Valencian region22 and previously validated in a pilot study in the “Nutrition and Health Survey” in Orihuela23 of adolescents aged 13 years and older was selected. The FFQ was found to be a simple, rapid, and inexpensive method and was self-completed by participants only once.
The original questionnaire consisted of 93 items (food items or food groups) divided into 9 food categories. Maintaining the same structure and food groups, the questionnaire was reduced to 51 items classified into 5 food groups (dairy products; eggs, meat and fish; vegetables, pulses and fruit; bread, cereals and similar products; oil, fat, sweets and pastry; beverages, precooked and preprocessed food, and others). This reduction was made after expert validation and analysis of the results of a pilot study showing that the food amounts indicated were too high and that if some foods were grouped, daily energy expenditure was adjusted. Pictures of different types of food were also included for guiding purposes only in order to help adolescents better understand the foods and the reference amounts.
Some of the limitations of self-administered questionnaires may be minimized if the answers are reviewed by nutritionists or duly qualified professionals, as occurred in our study.24 Height and weight measurements were also made with a MB 201 Plus analogical scale-stadiometer that was continuously calibrated. Height was calculated as the mean of three consecutive measurements, and was used together with weight to estimate body mass index (BMI).
A computing tool consisting of software specifically designed for the study using PHP and Java Script language, combined with a database designed with Mysql, was used for data collection. A multiuser database for relational databases was used for management. An Internet domain was acquired and software including the questionnaire was installed in it. Before the questionnaire was administered, the investigator explained the study objectives and the contents of the questionnaire to the subjects and made it clear that participation was free and voluntary. The parents of the children had previously been informed about the study that was to be conducted, and that study participation would be voluntary. Informed consent was then obtained from the participants before the questionnaire was administered. The questionnaire was individually and anonymously completed by participants in their own classrooms and took approximately 15min.
Data analysisThe variables collected in the questionnaire were analyzed. For this, a descriptive analysis of each item providing information about summation and means in relation to the opinions given by the surveyed students was performed.
Means were compared with a Student's t-test for independent samples to verify whether statistically significant sex differences existed in intake.
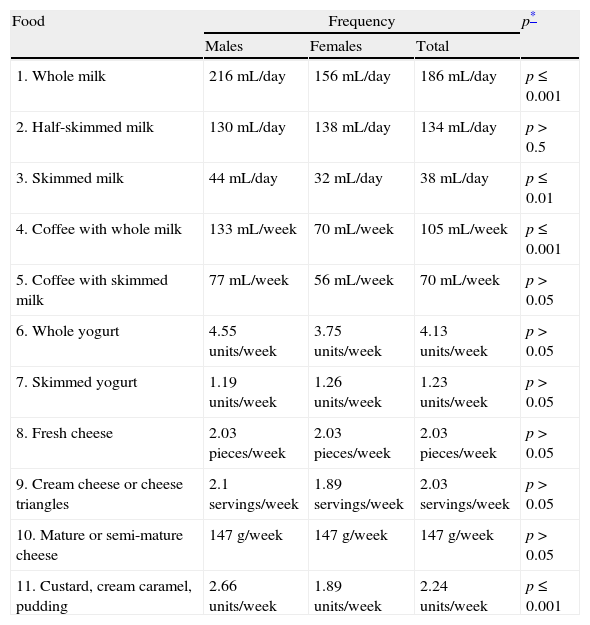
ResultsMales reported a higher intake than females of dairy products, except for half-skimmed milk and yogurt, while the intake of both skimmed and mature or semi-mature cheese was similar in both sexes.
Statistically significant differences, all of them favoring males, were found for the intake of whole and skimmed milk, coffee with whole milk, and custard, cream caramel or pudding (Table 1).
Frequency of consumption of dairy products.
| Food | Frequency | p* | ||
| Males | Females | Total | ||
| 1. Whole milk | 216mL/day | 156mL/day | 186mL/day | p≤0.001 |
| 2. Half-skimmed milk | 130mL/day | 138mL/day | 134mL/day | p>0.5 |
| 3. Skimmed milk | 44mL/day | 32mL/day | 38mL/day | p≤0.01 |
| 4. Coffee with whole milk | 133mL/week | 70mL/week | 105mL/week | p≤0.001 |
| 5. Coffee with skimmed milk | 77mL/week | 56mL/week | 70mL/week | p>0.05 |
| 6. Whole yogurt | 4.55 units/week | 3.75 units/week | 4.13 units/week | p>0.05 |
| 7. Skimmed yogurt | 1.19 units/week | 1.26 units/week | 1.23 units/week | p>0.05 |
| 8. Fresh cheese | 2.03 pieces/week | 2.03 pieces/week | 2.03 pieces/week | p>0.05 |
| 9. Cream cheese or cheese triangles | 2.1 servings/week | 1.89 servings/week | 2.03 servings/week | p>0.05 |
| 10. Mature or semi-mature cheese | 147g/week | 147g/week | 147g/week | p>0.05 |
| 11. Custard, cream caramel, pudding | 2.66 units/week | 1.89 units/week | 2.24 units/week | p≤0.001 |
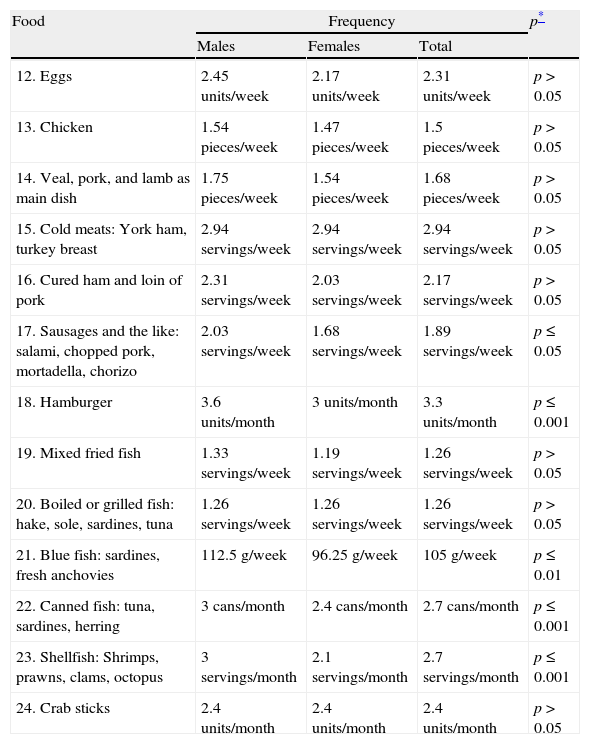
The intake of eggs, meat, and fish was higher in males, while similar intakes of cold meats, boiled or grilled fish, and crab sticks were found in both sexes.
However, statistically significant sex differences were seen in the intake of sausages and similar products, hamburgers, blue and canned fish, and shellfish (Table 2).
Frequency of consumption of eggs, meat, and fish.
| Food | Frequency | p* | ||
| Males | Females | Total | ||
| 12. Eggs | 2.45 units/week | 2.17 units/week | 2.31 units/week | p>0.05 |
| 13. Chicken | 1.54 pieces/week | 1.47 pieces/week | 1.5 pieces/week | p>0.05 |
| 14. Veal, pork, and lamb as main dish | 1.75 pieces/week | 1.54 pieces/week | 1.68 pieces/week | p>0.05 |
| 15. Cold meats: York ham, turkey breast | 2.94 servings/week | 2.94 servings/week | 2.94 servings/week | p>0.05 |
| 16. Cured ham and loin of pork | 2.31 servings/week | 2.03 servings/week | 2.17 servings/week | p>0.05 |
| 17. Sausages and the like: salami, chopped pork, mortadella, chorizo | 2.03 servings/week | 1.68 servings/week | 1.89 servings/week | p≤0.05 |
| 18. Hamburger | 3.6 units/month | 3 units/month | 3.3 units/month | p≤0.001 |
| 19. Mixed fried fish | 1.33 servings/week | 1.19 servings/week | 1.26 servings/week | p>0.05 |
| 20. Boiled or grilled fish: hake, sole, sardines, tuna | 1.26 servings/week | 1.26 servings/week | 1.26 servings/week | p>0.05 |
| 21. Blue fish: sardines, fresh anchovies | 112.5g/week | 96.25g/week | 105g/week | p≤0.01 |
| 22. Canned fish: tuna, sardines, herring | 3cans/month | 2.4cans/month | 2.7cans/month | p≤0.001 |
| 23. Shellfish: Shrimps, prawns, clams, octopus | 3 servings/month | 2.1 servings/month | 2.7 servings/month | p≤0.001 |
| 24. Crab sticks | 2.4 units/month | 2.4 units/month | 2.4 units/month | p>0.05 |
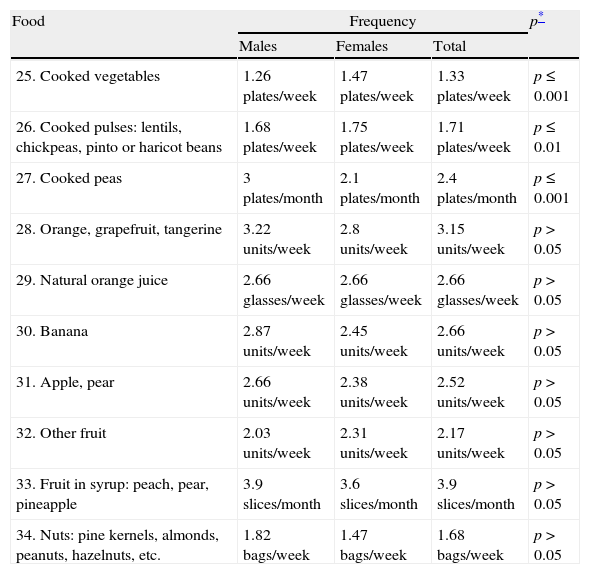
Results showed a higher intake of cooked vegetables and pulses in females, while the intake of fruit and nuts was higher in males.
After inferential statistical analysis, significant differences favoring females were seen in the intake of cooked vegetables and pulses, while males had a higher intake of peas (Table 3).
Frequency of consumption of vegetables, pulses, fruit, and nuts.
| Food | Frequency | p* | ||
| Males | Females | Total | ||
| 25. Cooked vegetables | 1.26 plates/week | 1.47 plates/week | 1.33 plates/week | p≤0.001 |
| 26. Cooked pulses: lentils, chickpeas, pinto or haricot beans | 1.68 plates/week | 1.75 plates/week | 1.71 plates/week | p≤0.01 |
| 27. Cooked peas | 3 plates/month | 2.1 plates/month | 2.4 plates/month | p≤0.001 |
| 28. Orange, grapefruit, tangerine | 3.22 units/week | 2.8 units/week | 3.15 units/week | p>0.05 |
| 29. Natural orange juice | 2.66 glasses/week | 2.66 glasses/week | 2.66 glasses/week | p>0.05 |
| 30. Banana | 2.87 units/week | 2.45 units/week | 2.66 units/week | p>0.05 |
| 31. Apple, pear | 2.66 units/week | 2.38 units/week | 2.52 units/week | p>0.05 |
| 32. Other fruit | 2.03 units/week | 2.31 units/week | 2.17 units/week | p>0.05 |
| 33. Fruit in syrup: peach, pear, pineapple | 3.9 slices/month | 3.6 slices/month | 3.9 slices/month | p>0.05 |
| 34. Nuts: pine kernels, almonds, peanuts, hazelnuts, etc. | 1.82 bags/week | 1.47 bags/week | 1.68 bags/week | p>0.05 |
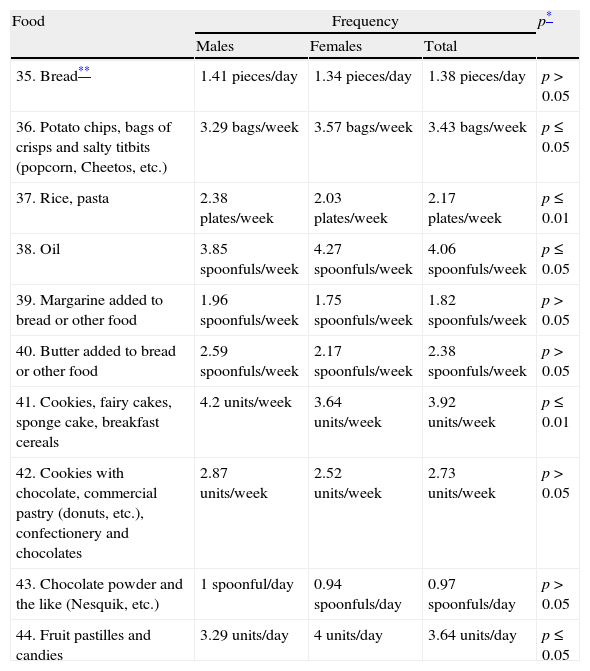
Males reported a higher consumption of bread, rice and pasta, pastry, butter and margarine, and cookies, while a significantly higher intake of snacks, oil, fruit pastilles, and candies were found in females (Table 4).
Frequency of consumption of bread, cereals, oil and fat, sweets, and pastry.
| Food | Frequency | p* | ||
| Males | Females | Total | ||
| 35. Bread** | 1.41 pieces/day | 1.34 pieces/day | 1.38 pieces/day | p>0.05 |
| 36. Potato chips, bags of crisps and salty titbits (popcorn, Cheetos, etc.) | 3.29 bags/week | 3.57 bags/week | 3.43 bags/week | p≤0.05 |
| 37. Rice, pasta | 2.38 plates/week | 2.03 plates/week | 2.17 plates/week | p≤0.01 |
| 38. Oil | 3.85 spoonfuls/week | 4.27 spoonfuls/week | 4.06 spoonfuls/week | p≤0.05 |
| 39. Margarine added to bread or other food | 1.96 spoonfuls/week | 1.75 spoonfuls/week | 1.82 spoonfuls/week | p>0.05 |
| 40. Butter added to bread or other food | 2.59 spoonfuls/week | 2.17 spoonfuls/week | 2.38 spoonfuls/week | p>0.05 |
| 41. Cookies, fairy cakes, sponge cake, breakfast cereals | 4.2 units/week | 3.64 units/week | 3.92 units/week | p≤0.01 |
| 42. Cookies with chocolate, commercial pastry (donuts, etc.), confectionery and chocolates | 2.87 units/week | 2.52 units/week | 2.73 units/week | p>0.05 |
| 43. Chocolate powder and the like (Nesquik, etc.) | 1 spoonful/day | 0.94 spoonfuls/day | 0.97 spoonfuls/day | p>0.05 |
| 44. Fruit pastilles and candies | 3.29 units/day | 4 units/day | 3.64 units/day | p≤0.05 |
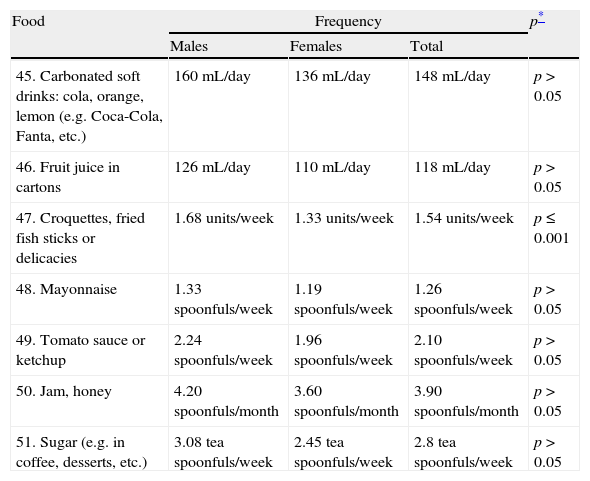
The intake of all precooked, preprocessed, and miscellaneous products analyzed was higher in males, although differences were only significant for croquettes and fried fish sticks (Table 5).
Frequency of consumption of drinks and precooked, preprocessed, and miscellaneous foods.
| Food | Frequency | p* | ||
| Males | Females | Total | ||
| 45. Carbonated soft drinks: cola, orange, lemon (e.g. Coca-Cola, Fanta, etc.) | 160mL/day | 136mL/day | 148mL/day | p>0.05 |
| 46. Fruit juice in cartons | 126mL/day | 110mL/day | 118mL/day | p>0.05 |
| 47. Croquettes, fried fish sticks or delicacies | 1.68 units/week | 1.33 units/week | 1.54 units/week | p≤0.001 |
| 48. Mayonnaise | 1.33 spoonfuls/week | 1.19 spoonfuls/week | 1.26 spoonfuls/week | p>0.05 |
| 49. Tomato sauce or ketchup | 2.24 spoonfuls/week | 1.96 spoonfuls/week | 2.10 spoonfuls/week | p>0.05 |
| 50. Jam, honey | 4.20 spoonfuls/month | 3.60 spoonfuls/month | 3.90 spoonfuls/month | p>0.05 |
| 51. Sugar (e.g. in coffee, desserts, etc.) | 3.08 tea spoonfuls/week | 2.45 tea spoonfuls/week | 2.8 tea spoonfuls/week | p>0.05 |
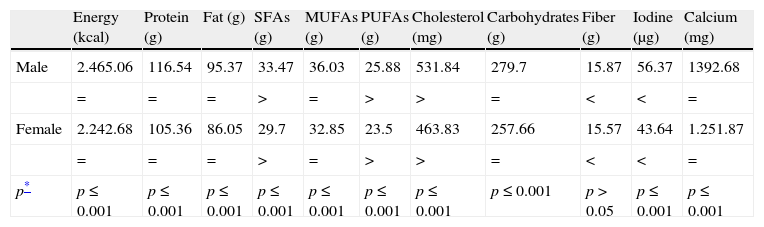
After the food intake results had been examined, the data collected were converted into amounts of essential nutrients, with sex differences on the one hand, and on the other hand the relationship to recommended intake being analyzed.25
The intake of all the nutrients analyzed, except fiber, was significantly greater in males.
The intake of SFAs, polyunsaturated fatty acids (PUFAs), and cholesterol was greater than recommended in both males and females, while fiber and iodine intake was lower than recommended (Table 6).
Intake of macronutrients and micronutrients by sex.
| Energy (kcal) | Protein (g) | Fat (g) | SFAs (g) | MUFAs (g) | PUFAs (g) | Cholesterol (mg) | Carbohydrates (g) | Fiber (g) | Iodine (μg) | Calcium (mg) | |
| Male | 2.465.06 | 116.54 | 95.37 | 33.47 | 36.03 | 25.88 | 531.84 | 279.7 | 15.87 | 56.37 | 1392.68 |
| = | = | = | > | = | > | > | = | < | < | = | |
| Female | 2.242.68 | 105.36 | 86.05 | 29.7 | 32.85 | 23.5 | 463.83 | 257.66 | 15.57 | 43.64 | 1.251.87 |
| = | = | = | > | = | > | > | = | < | < | = | |
| p* | p≤0.001 | p≤0.001 | p≤0.001 | p≤0.001 | p≤0.001 | p≤0.001 | p≤0.001 | p≤0.001 | p>0.05 | p≤0.001 | p≤0.001 |
Prepared by study authors.
Student's t-test for independent samples; =: within recommended intake (source: Moreiras et al. (2002)); >: above the recommended intake (source: Moreiras et al. (2002)); <: below the recommended intake (source: Moreiras et al. (2002));
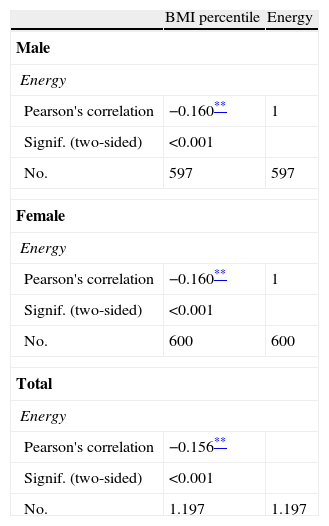
Pearson's correlation was used to examine the relationship between BMI and calorie intake. The results obtained suggest very similar values in both sexes, showing a relationship between the variables analyzed, although this relationship was inverse and weak (−0.156; r≤0.001) (Table 7).
BMI-calorie intake correlation.
Adolescents participating in this study reported an adequate intake of milk and dairy products, which provided the amounts of calcium required for bone growth at these ages.2,4,5,26 Mean milk consumption was lower in females.16 However, other epidemiological studies conducted in adolescents6,11 have reported an inadequate consumption of dairy products.
Fish, meat, and eggsThe low intake of fish and other sea products may be associated with low iodine provision, and our data agree with those reported by other studies.27 In this regard, our data agree with those found in other epidemiological studies conducted in adolescents,4,7,11,16,26 and also with the considerable decrease found by the Ministry of Health and Consumer Affairs.28
During adolescence, it is sensible not to exceed double the recommended daily intake (RDI) of protein, as this may interfere with calcium metabolism and promote the development of osteoporosis. In studies conducted on adolescents in Spain, protein intake was found to be much higher than the RDI.8,29 High protein intake may be due to a high consumption of products of animal origin, mainly meat. However, and despite the fact that the consumption of meat-derived products has historically been high in this area, the protein intake by the participants was not high and agreed with dietary recommendations.
Most research studies have reported a higher than recommended consumption of meat,7,26 particularly red meat and cooked meats,16 with boys eating more meat than girls.6,30 However, these results were not confirmed by some studies, including ours.11,31
No consensus exists either as regards egg consumption. Some studies, including ours, have reported adequate egg consumption,26 while a very low egg intake was seen in other studies.11
VegetablesThe intake of vegetables was below the amounts recommended by the “5 daily” program (minimum intake of 2–3 servings daily).
The different studies show significant differences in vegetable consumption. While some of them have found an adequate intake,5,11,32 others have reported a low consumption level,26 clearly lower than that estimated for the adult population,16 and higher in females than in males,2,6 so agreeing with the low fiber consumption found in our study.
PulsesIn our study, pulse intake during adolescence was within the recommended parameters.2,5,11,26 By contrast, a low consumption of pulses,7 clearly lower than that reported for the adult population, has been found in some studies.16 Other studies have reported a higher intake by women.2
Fruit and nutsFruit consumption was found to be lower than recommended (3 servings daily). Many population studies have found an adequate fruit intake,2,11,26 and others have reported higher fruit consumption in females,6 which disagrees with our data. However, other studies (including ours) have noted in both sexes a low fruit consumption, clearly lower than that estimated for the adult population,5,7,16,26,28 which would partly account for the low intake of fiber found.
High nut consumption would explain the higher than recommended PUFA intake. Nut consumption was highest in adolescents aged 14–17 years (4.9±18.5g/per capita/day).32
By contrast, the consumption of bread and cereals was lower than that recommended by the Ministry of Health.
Other studies have also reported a mean daily consumption of cereals lower than that recommended.7,16,26 We noted a low consumption mainly of whole grain bread, which would again confirm the low fiber intake. This trend however is not shared by all regions, as some studies have reported a bread intake in accordance with these recommendations.2,11
Agreement exists however regarding the high and increasing consumption of snacks,9,26 which accounts in our case for the SFA intake being above the recommended daily amount.33
An adequate intake was seen for pasta and rice, which are among the favorite foods of Spanish adolescents.16 This would explain why carbohydrate (CH) consumption was within the recommended daily amount.
Oil and fatBased on the data collected, there was a high intake of oil and butter as compared to studies conducted in other regions, which resulted in higher than recommended intakes of saturated FAs and cholesterol.
Sweets and pastryMost population studies of adolescents conducted in Spain show a high consumption of cookies and commercial pastry products.16,19,26 In this regard, our data conflict with the results reported by the Ministry of Health and Consumer Affairs.28
Another trend found in adolescence is a higher consumption of confectioneries,2,4,7,19,26 which may lead to a greater future prevalence of diseases related to their consumption such as tooth decay, obesity, and associated diseases.1 This is in contrast to the decreased intake reported by the HBSC’2006 study.
The excess intake of carbonated drinks may restrict the intake of other drinks such as milk and decrease calcium provision.34 No excess consumption of sugar-containing and carbonated drinks was seen in Badajoz. These data are supported by the decreasing trend already found in the HSBC’2006 study. However, these results disagree with the national trend9,34 which is supported by several studies of adolescents4,19 whose consumption of such drinks has even reached worrying levels in some cases.2
Precooked, preprocessed, and miscellaneous productsThe use of precooked and preprocessed food is high in the adolescent population. A low intake of fried products decreases the chance of body weight increase and the risk of suffering cardiovascular disease, diabetes, etc.35 The term “fast food” is associated with precooked or preprocessed food with high cholesterol and SFA contents. In this regard, our study again agrees with the national trend,9,34 supported by the results from relevant studies.26 There are however studies which have reported a low consumption of precooked, preprocessed, and fast food.4
The enormous amount of fatty food of animal origin, mainly of “precooked” food, usually taken may be the cause of the high cholesterol levels. Such high consumption has also been seen in other studies of adolescents.36
It had already been shown that only half the adolescent population (50%) had an adequate dietary intake,14 and that this diet was normocaloric and hyperproteic.10
A comparison of our results to those reported by other studies conducted in Badajoz13,37 showed they agreed that the diet was imbalanced and that there was a high frequency of intake of milk and dairy products. However, our results differed in the high intake of fruit, pastry, sweets, and preprocessed food found, resulting in a higher provision of CHs.
Although a correlation was seen between the BMI, or the Quetelet index, and calorie consumption, such correlation was inverse and weak, and does not therefore appear to be relevant. Other studies did not even show a relationship when adolescents with normal and excess weight were compared.38
ConclusionAs a general conclusion, it may be stated that OSE students in Badajoz had an inadequate diet, with an imbalanced calorie profile, consistent with the trend shown by other local and national studies. Like the rest of the young people in Spain, they are switching from a Mediterranean to a Western dietary model. This is shown by the low fiber intake due to the low consumption of cereals, fruit and vegetables, as well as fish and shellfish, the high consumption of snacks and candies, a higher than recommended SFA intake, and a cholesterol intake substantially higher than recommended. CH intake was adequate. The consumption of pasta, rice, and oil was within the recommendations, and the consumption of sweets and pastry, precooked food, and sugar-containing drinks was not excessive. These results show non-compliance with the recommendations of a Mediterranean diet. Adolescents should therefore be encouraged to follow a more complete, balanced, and healthy diet that provides them with all the essential nutrients needed at this growth stage.
The participation of parents and adolescents in nutritional education in order to make an impact on home meals is therefore required. Action and intervention plans promoted by public authorities should also be established in educational centers to provide nutritional reeducation for students by experts. This would do much to prevent metabolic diseases, including obesity and type 2 diabetes mellitus.
Conflicts of interestThe authors state that they have no conflicts of interest.
Please cite this article as: Córdoba Caro LG, et al. Ingesta dietética de los estudiantes de secundaria de la ciudad de Badajoz. Endocrinol Nutr. 2012;59(7):407–15.
