


An epidemiologic survey showed in 1992 iodine deficiency and endemic goiter in schoolchildren from the Basque Country.
Objectives(1) To determine the percentage of homes of schoolchildren where iodized salt (IS) is used; (2) to assess iodine nutrition status in schoolchildren and to compare the data collected with those available from previous epidemiological studies.
Design and methodsA cross-sectional study of 720 randomly selected schoolchildren. Urinary iodine concentration (UIC) was measured using high-performance liquid chromatography (HPLC) with electrochemical detection.
ResultsIS was used in 53.0% of the homes (95% confidence interval [CI], 49.2–56.7%). Median UIC has increased by 226%, from 65μg/L in 1992 to 147μg/L (percentile [P], P25, 99μg/L; P75, 233μg/L) today. Both schoolchildren who consume IS and those who use unfortified salt at their homes had UICs corresponding to adequate iodine intakes (165 and 132μg/L respectively). UICs experienced great seasonal fluctuations, being 55% higher during the November–February period than in June–September period (191μg/L versus 123μg/L; p<0.001).
ConclusionsSchoolchildren from the Basque Country have normalized their iodine nutrition status. The strong seasonal pattern of UICs suggests that consumption of milk and iodine-rich dairy products coming from cows that feed on iodized fodder is one of the most significant factors involved in the increase in iodine intake since 1992.
Un estudio epidemiológico demostró en 1992 la existencia de deficiencia de yodo y bocio endémico en los escolares de la Comunidad Autónoma del País Vasco (CAPV).
Objetivos1) Conocer el porcentaje de las viviendas de escolares en las que se consume sal yodada (SY); 2) estudiar el estado de nutrición del yodo en la población escolar y comparar los datos obtenidos con los disponibles de estudios epidemiológicos anteriores.
MétodosEstudio descriptivo transversal en 720 escolares seleccionados mediante muestreo aleatorio. Las determinaciones de concentración urinaria de yodo (CUY) se realizaron mediante cromatografía líquida de alta resolución (HPLC).
ResultadosEl porcentaje de consumo de SY en el domicilio fue 53,0% (intervalo de confianza [IC] del 95%, 49,2-56,7%). La mediana de las CUY ha aumentado un 226% desde los 65μg/L de 1992, alcanzando 147μg/L (percentil [P], 25, 99μg/L; P75, 233μg/L) en la actualidad. Tanto los escolares que consumen SY en sus domicilios como los que utilizan sal sin fortificar tuvieron CUY que corresponden a ingestas adecuadas de yodo (165 y 132μg/L respectivamente). Las CUY sufrieron grandes fluctuaciones estacionales, resultando un 55% mayores durante noviembre-febrero que durante junio-septiembre (191μg/L frente a 123μg/L; p<0,001).
Discusión y conclusionesLos escolares de la CAPV han normalizado su estado de nutrición con respecto al yodo. El patrón fuertemente estacional seguido por las CUY orienta hacia el consumo de leche y lácteos ricos en yodo procedentes de vacas alimentadas con piensos yodados como uno de los factores más importantes involucrados en el aumento producido en la ingesta del micronutriente desde 1992.
Iodine is an essential nutrient for all animal species. For normal growth and development and health preservation, humans need from 90 to 290μg of iodine daily, depending on age and physiological condition.1 In humans, iodine deficiency (ID) causes a broad spectrum of adverse events, collectively called iodine deficiency disorders (IDDs).2 The most visible and known consequence of ID is goiter, but its most severe effects occur in the central nervous system during its development. Irreversible brain damage may occur, leading to psychomotor disorders of variable severity, which range from subtle neurological and cognitive deficiencies to the most extreme situation, cretinism, through different grades of deficiency in motor and learning capacities and in hearing.3–9
Most of the iodine on the planet's surface is contained in the oceans and seas, to which great amounts of soluble iodine were swept away from the earth's surface by the water from thaws, snow, and rain during geological evolution.10 Only a limited number of foods, those of marine origin, are rich in iodine, except for sea salt, which has a low iodine content. By contrast, the natural content of iodine of all other foods is low because soils and shallow fresh water usually have a low iodine content. Consequently, concentrations of the micronutrient in terrestrial plants and in the tissues of animals nourished from such waters and plants are also low.10 This geochemical characteristic of the earth's crust has secularly determined inadequate iodine intake by the population in most geographic areas of the planet and the occurrence of IDDs.11–17 Animals in those geographic areas also suffer from ID and IDDs, and highly significant reductions occur in poultry and livestock productivity due to reductions in the reproductive capacity of poultry, sheep, goats, cattle, and swine, decreased litter survival, and decreased meat, milk, and wool production as the result of ID.18
The iodination method recommended by the World Health Organization (WHO) for the elimination of ID and for the prevention and control of IDDs is the fortification of salt with iodine.16,17,19–22 In Spain, the Royal Decree 1424/1983 set down the technical regulations governing the collection, circulation, and sale of salt and comestible brines, defining iodinated salt (IS) as refined salt to which potassium iodide, potassium iodate, or some other iodinated derivative approved by the Directorate General of Public Health has been added in an adequate proportion for the finished product to contain 60milligrams of iodine per kilogram of salt (i.e. 60ppm of iodine). A tolerance of ±15% is allowed.23
An epidemiological study conducted from 1988 to 1992 demonstrated the existence of ID and endemic goiter among schoolchildren from the Basque Country (BC).24 Based on such findings, and in order to prevent and control IDDs, various information and health education initiatives were implemented to promote the use of IS instead of unfortified salt by the population, and in particular by the groups most vulnerable to the effects of ID (children, women of childbearing age, and pregnant and lactating women). One such initiative was a massive campaign launched by the Department of Health of the Basque Government in 1998.
In order to assess the results of such health interventions and to collect updated information on the iodine nutritional status in schoolchildren, the Directorate of Public Health of the Department of Health of the Basque Government included in the “2005 Nutrition Survey: the feeding habits and state of health of the Basque population aged 4–18 years”25 the two main indicators for ascertaining the efficacy of public health programs based on the use of IS for IDD prevention and control, namely the percentage usage of IS in households and median urinary iodine levels.16,17 Assuming a stable iodine intake, approximately 92% of iodine ingested is excreted daily in urine.1 Median urinary iodine levels measured in a sufficient number of spot urine samples have been shown to be the main and most practical biochemical indicator for estimating recent iodine intake and iodine nutritional status in population groups.26 The WHO, the United Nations Children's Fund (UNICEF), and the International Council for the Control of Iodine Deficiency Disorders (ICCIDD) therefore recommend the use of these levels as a biological marker of both the level of exposure to ID and the impact of interventions for ID prevention and control.16,17
The study objectives were: (1) to ascertain the extent of the usage of IS in the homes of schoolchildren and the iodine nutritional status of these children and (2) to analyze changes in iodine nutritional status between 1992 and 2005 by comparing data from the 2005 Nutrition Survey with data from the two studies previously conducted in school populations, the epidemiological study completed in 199224 and the study conducted in sentinel schools in 1998.27
Materials and methodsResearch to ascertain the nutritional iodine status in BC children and adolescents was conducted in the framework of the “2005 Nutrition Survey: feeding habits and state of health of the Basque population aged 4–18 years”, a cross-sectional epidemiological study describing the distribution of various nutritional parameters in relation to sociodemographic variables.25 The 2005 Nutrition Survey, whose primary objectives were to investigate nutritional health status and its determining factors in children and adolescents living in private homes in the BC and to identify the main nutritional risk groups, was promoted by the Directorate of Public Health of the Department of Health of the Basque Government and was part of the Basque Statistical Survey. The 2005 Nutrition Survey was approved by the Ethics Committee of Donostia Hospital, which is part of the Osakidetza-Basque Health Service network.
PopulationThe target population of the 2005 Nutrition Survey consisted of persons aged 4–18 years living in private homes in the BC. Eligible private households included the 5212 households contacted in the 2002 BC Health Survey after selection by two-stage random sampling.28 The first stage consisted of proportional stratified random sampling of census sections (unequal clusters). Both geographical stratification (by healthcare areas) and socioeconomic stratification (by healthcare districts) were performed. In the second stage, circular systematic random sampling was made of households within each census section to establish the socio-demographic stratification of the region correlated to geographical location within the region. For the 2005 Nutrition Survey, all homes contacted in the 2002 BC Health Survey where families with members aged 4–18 years lived were selected, and only one member of each family in that age group was included in the study. In families with two or more members in this age group, selection was made by simple random sampling. The population considered in this manuscript corresponded to the subgroup of all subjects aged 6–14 years from the 2005 Nutrition Survey.
Sample sizeAssuming a participation of 90% of the effective sample from the 2002 BC Health Survey, an adequate sample size to allow for estimating the most relevant nutritional parameters of the 2005 Nutrition Survey and to study the prevalence of overweight and obesity was calculated (with an estimated sampling error of 2%) as 1182 subjects.
To estimate iodine intake in a population group with a 95% confidence interval and a precision range ±10%, 125 spot urine samples are required, while approximately 500 samples are needed to achieve a precision range ±5%.29
MethodsThe survey was conducted through personal interviews with the subjects selected or their guardians at their homes. Demographic information was collected and two diet questionnaires, a 24-h recall questionnaire and a food consumption frequency questionnaire, were completed. Two additional questionnaires on nutritional attitudes and knowledge and on health and lifestyle habits were also completed. Demographic variables included the sociodemographic group of the selected household based on the following definitions: (1) high (group I: governmental and company managers, senior officials, members of the liberal professions, and senior technicians; group II: managers and owners of trade and personal services companies, skilled technicians, artists, and sportsmen); (2) middle (group III: middle managers, clerks and civil servants, and staff of protection and security services; and (3) low (group IV: skilled and semi-skilled workers of industry, trade, and services, and group V: unskilled workers).25 In addition, information on the type of salt used by the family was collected, and the weight, height, and blood pressure of participants were measured. Participants for whom authorization was available also had capillary blood samples taken in order to test cholesterol levels, as well as urine samples to test urinary iodine and electrolyte levels.
Iodinated salt consumptionDuring the interview, the person responsible for diet in the family was asked about the type of salt used (refined salt, refined marine salt, iodinated salt, or iodinated and fluorinated salt), and the response was confirmed by checking the label of the salt pack. When the label was not available for verification, a sample (approximately 2g) was taken from a salt container in order to measure its iodine content. In households with more than one type of salt, the sample was taken from the container with the salt most commonly used by the family.
Urinary iodine concentrationTo measure urinary iodine concentration (UIC), a sample of first morning urine (10mL) was collected into polypropylene tubes (with no preservatives) from children and adolescents for whom consent had been obtained. Samples were refrigerated at between 2 and 8°C and delivered within 24h to the Territorial Public Health Laboratories, where they were frozen at −20°C before being shipped to the Normative Public Health Laboratory of the Basque Government for processing. UIC was measured using high-performance liquid chromatography (HPLC) with electrochemical detection.30
ProceduresThe criteria established by the WHO, UNICEF, and ICCIDD for school populations were followed in order to assess nutritional iodine status.16,17 According to such criteria, iodine intake of schoolchildren is classified based on the median UIC of the group using the following cut-off points and ranges: median UIC<100μg/L, iodine deficiency (50–99μg/L, mild deficiency; 20–49μg/L, moderate deficiency; less than 20μg/L, severe deficiency); 100–199μg/L, adequate iodine intake; 200–299μg/L, higher than recommended iodine intake; and ≥300μg/L, excess iodine intake.
Statistical analysisVariables were expressed using measures of central tendency and dispersion for the quantitative variable (UIC), and absolute and relative frequencies (percentages, with their confidence intervals) for qualitative and categorical variables (sex, age, socioeconomic class, and type of salt used at home). Due to sampling type, the design effect was introduced and estimators were adjusted for performing calculations.
Since the values of urinary iodine concentration do not usually follow a normal distribution in populations, medians and interquartile ranges were used as measures of central tendency and dispersion respectively to express UIC results.16,17 Non-parametric tests were used to analyze the differences between medians of UIC: a Mann–Whitney U test for the comparison of two medians and a Kruskal–Wallis test to compare more than two medians. Comparisons between frequencies of categorical variables were performed using a Pearson's Chi-square test, and a Fisher's exact test was also used when required.
The significance threshold selected for statistical tests was 5% (p<0.05). Values of estimations with a significance of less than 10% (p<0.1) are also shown. Statistical analysis was performed using software SPSS, version 15.0 for Windows (SPSS Inc., Chicago, USA).
ResultsField work for the “2005 Nutrition Survey: feeding habits and state of health of the Basque population aged 4–18 years” started on March 1, 2004 and was completed on February 28, 2005. The results found in schoolchildren aged 6–14 years (n=720) are given below.
Study populationThe proportion of households selected and not contacted during the performance of the 2005 Nutrition Survey (because of long-term absence, demolished building, relocation, and other reasons) was 11.2%, while 11.7% of eligible households declined to participate. The initial response rate was therefore 77.1%. In both cases, households not enrolled were replaced by people of the same age and sex in order to obtain a final sample consisting of 1178 subjects aged 4–18 years (99.7% of the planned sample size).
Among the 1178 randomly sampled subjects aged 4–18 years, 720 were schoolchildren aged 6–14 years, 354 boys (49.2%) and 366 girls (50.8%). Five of them were excluded from the study to know the type of salt used at their homes due to incomplete record data (no data on socioeconomic group and/or type of salt used at home), so that the final number of subjects included in the statistical calculations related to IS consumption in households was 715 (99.3%). Urine sample collection was authorized for 660 children (91.7%), but the number of UICs considered for statistical analysis was 657 (91.2%) due to the exclusion of three subjects, one of them because urine could not be collected and the other two due to incomplete data in their records (missing data on socioeconomic group and type of salt used at home respectively).
Type of salt used by households (n=715)The type of salt used by the family could not be determined in 79 of the households, and a sample of salt was taken from its container in the kitchen to test iodine content. Iodine was undetectable in 38 (48.1%) of these samples, while the iodine content of the remaining 41 (51.9%) samples ranged from 10 to 99μg/g of salt, with a mean concentration (standard deviation) of 41.0 (18.3) μg/g of salt.
IS and unfortified salt were used by 53.0% (95% confidence interval [CI], 49.2–56.7%) and 47.0% (95% CI, 43.2–50.8%) of households respectively. Differences in fortified salt consumption were not significant in the three socioeconomic groups considered: high, 52.8%; middle, 57.5%; and low, 51.6% (p=0.528).
Urinary iodine concentrations (n=657)The upper limit of quantification of UIC was 400μg/L, and higher values were reported by the laboratory as “higher than 400μg/L”. UIC values higher than 400μg/L were found in 48 tests (7.3%).
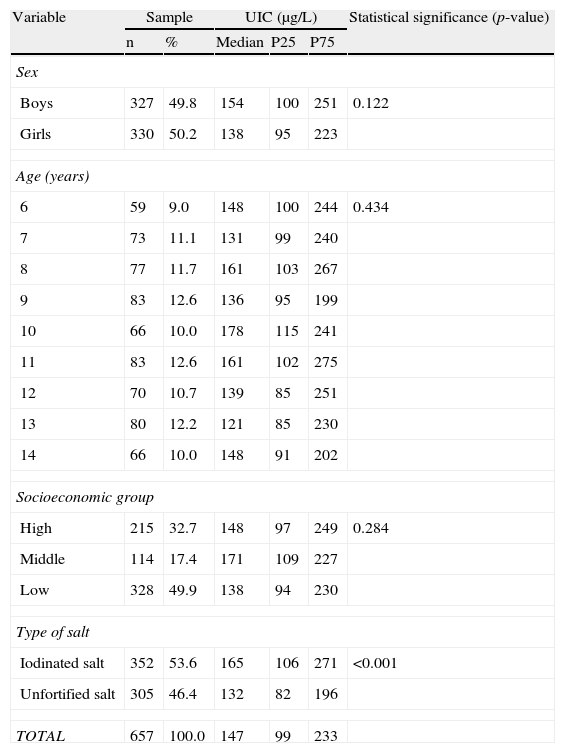
Table 1 shows the distribution of UICs by sex, age, socioeconomic group, and type of salt used in the household. Median UIC in the study population was 147μg/L (P25, 99μg/L and P75, 233μg/L; interquartile range, 134μg/L; P75–P50/P50–P25 ratio=1.79). Median UIC was 25% higher in schoolchildren from households using IS as compared to children from households using salt unfortified with iodine, with a statistically significant difference (165 versus 132μg/L; p<0.001). Median UIC was higher in boys than in girls, but the difference did not reach statistical significance. There were also no significant differences in UIC by age or socioeconomic group.
Distribution of urinary iodine concentrations (μg/L) in schoolchildren aged 6–14 years by sex, age, socioeconomic group, and type of salt used at home (n=657).
| Variable | Sample | UIC (μg/L) | Statistical significance (p-value) | |||
| n | % | Median | P25 | P75 | ||
| Sex | ||||||
| Boys | 327 | 49.8 | 154 | 100 | 251 | 0.122 |
| Girls | 330 | 50.2 | 138 | 95 | 223 | |
| Age (years) | ||||||
| 6 | 59 | 9.0 | 148 | 100 | 244 | 0.434 |
| 7 | 73 | 11.1 | 131 | 99 | 240 | |
| 8 | 77 | 11.7 | 161 | 103 | 267 | |
| 9 | 83 | 12.6 | 136 | 95 | 199 | |
| 10 | 66 | 10.0 | 178 | 115 | 241 | |
| 11 | 83 | 12.6 | 161 | 102 | 275 | |
| 12 | 70 | 10.7 | 139 | 85 | 251 | |
| 13 | 80 | 12.2 | 121 | 85 | 230 | |
| 14 | 66 | 10.0 | 148 | 91 | 202 | |
| Socioeconomic group | ||||||
| High | 215 | 32.7 | 148 | 97 | 249 | 0.284 |
| Middle | 114 | 17.4 | 171 | 109 | 227 | |
| Low | 328 | 49.9 | 138 | 94 | 230 | |
| Type of salt | ||||||
| Iodinated salt | 352 | 53.6 | 165 | 106 | 271 | <0.001 |
| Unfortified salt | 305 | 46.4 | 132 | 82 | 196 | |
| TOTAL | 657 | 100.0 | 147 | 99 | 233 | |
P25: 25th percentile of the distribution observed; P75: 75th percentile of the distribution observed.
Values of median urinary iodine concentrations (UICs) and P25 and P75 were calculated by weighting, taking sample size into account.
p-value: Value of statistical significance reached in hypothesis testing (Mann–Whitney test for sex and type of salt used at home and Kruskal–Wallis test for age and socioeconomic group).
Urinary iodine excretion was not constant during the 12 months of the study (from March 2004 to February 2005), but experienced great seasonal variations, with minimal values in summer and the first half of autumn and peak values in late autumn and during the first half of winter. Median UIC in urine samples collected from November 2004 to February 2005 was 55% higher than the median UIC found in samples taken from June to September 2004 (191μg/L versus 123μg/L; p<0.001). An intermediate value (153μg/L), very close to the median UIC found in urine samples from the overall study (147μg/L), was reported during spring. Median UIC remained within the 100–199μg/L range except from November 2004 to January 2005, when a slightly higher value was found (217μg/L).
As regards the distribution of UIC ranges (<50μg/L; 50–99μg/L; 100–199μg/L; 200–299μg/L; and >300μg/L) by sex, age, socioeconomic group, and type of salt used in the household, the only significant difference was between schoolchildren taking iodinated salt at home versus those taking unfortified salt (Chi-square test: p<0.001 in all UIC ranges). Fig. 1 shows the frequency distribution of UICs grouped in ranges and the percentages of extreme UICs by type of salt used in the household. The proportions of UICs lower than 50 and 100μg/L were 4.9% (95% CI: 3.1–6.7%) and 26.1% (95% CI: 22.6–29.6%) respectively, while the proportion of UICs of 300μg/L or higher was 15.5% (95% CI: 12.6–18.4%).
.")
The proportion of UICs less than 100μg/L was significantly lower in schoolchildren from households using IS as compared to those from households using unfortified salt (20.9% versus 32.1%; p<0.001), while the proportion of UICs of 300μg/L or higher was significantly higher in schoolchildren from households using IS as compared to those from households using unfortified salt (19.5% versus 10.9%; p<0.001).
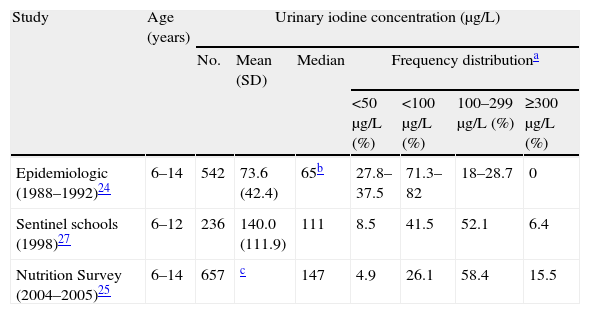
Changes in urinary iodine concentrations between 1992 and 2005Table 2 gives the basic data on nutritional iodine status in the three studies conducted on schoolchildren in the BC between 1992 and 2005.
Changes in nutritional iodine status in schoolchildren from the Basque Country (1992–2005).
| Study | Age (years) | Urinary iodine concentration (μg/L) | ||||||
| No. | Mean (SD) | Median | Frequency distributiona | |||||
| <50μg/L (%) | <100μg/L (%) | 100–299μg/L (%) | ≥300μg/L (%) | |||||
| Epidemiologic (1988–1992)24 | 6–14 | 542 | 73.6 (42.4) | 65b | 27.8–37.5 | 71.3–82 | 18–28.7 | 0 |
| Sentinel schools (1998)27 | 6–12 | 236 | 140.0 (111.9) | 111 | 8.5 | 41.5 | 52.1 | 6.4 |
| Nutrition Survey (2004–2005)25 | 6–14 | 657 | c | 147 | 4.9 | 26.1 | 58.4 | 15.5 |
SD: standard deviation.
Defined according to the cut-off points and reference ranges proposed by the World Health Organization, the United Nations Children's Fund (UNICEF), and the International Council for the Control of Iodine Deficiency Disorders (ICCIDD).16,17
The upper limit of quantification of urinary iodine concentrations was 400μg/L, and high values were reported by the Normative Laboratory of Public Health of the Basque Government as “higher than 400μg/L”. For this reason, the mean and standard deviation of UIC could not be calculated. Mean urinary iodine concentrations exceeded in any case 175μg/L because, even assuming the lowest possible value when UIC was reported as higher than 400μg/L, i.e. 401μg/L, the resultant mean (SD) would be 175.8 (103.4) μg/L.
Median UIC increased by 226%, from 65μg/L in 1992 (iodine deficiency) to 147μg/L in 2004–5 (adequate iodine intake). The change to normalization of iodine intake was already evident in 1998 in the study conducted in sentinel schools (111μg/L). Iodine intake normalized in both the subgroups of schoolchildren who took IS and unfortified salt at home (median UICs, 165 and 132μg/L respectively).
DiscussionAn epidemiological study conducted from 1988 to 1992 demonstrated the existence of ID and endemic goiter among schoolchildren in the Basque Country.24 Since then, the Directorate of Public Health of the Department of Health of the Basque Government has monitored the nutritional iodine status of that population group.25,27
The iodination method recommended by the WHO for the elimination of ID and the prevention and control of IDDs is the fortification of salt with iodine.16,17,19–22 The goal proposed by the WHO, UNICEF, and ICCIDD for the elimination of ID using salt fortified with iodine is that more than 90% of households have sustained access to IS.16,17 Although IS is available at food stores, its use in BC households with children was low. Only 53% of families with members of school age used salt fortified with iodine.
However, despite the low use of IS in their homes, there has been a great change in the nutritional iodine status of BC children since 1992. The change has been of such a magnitude that it has resulted in the disappearance of ID in this population group. As it may be seen in Table 2, median UIC has increased by 226%, from 65μg/L in 1992 (iodine deficiency) to 147μg/L in 2005. This figure suggests an adequate nutritional iodine status (median UIC in the 100–199μg/L range). The fact that the median UIC of schoolchildren exceeded 100μg/L in the study conducted at the two sentinel schools of the BC in 199827 suggests an accelerated change toward the normalization of iodine intake. It should be noted that this change occurred without the implementation in the BC of systematic and sustained active prophylactic measures with IS, and that urine samples from schoolchildren attending sentinel schools were collected before the massive 1998 campaign by the Department of Health of the Basque Government to promote the use of IS instead of unfortified salt.
As in the BC, a marked improvement in nutritional iodine status has also been noted in the Spanish autonomous communities (ACs) for which information is available on this subject, and UICs found in recent studies reflect in most cases an adequate iodine intake, in sharp contrast to the virtually general ID and IDDs demonstrated by the epidemiological studies conducted between 1980 and 1993.31,32 According to the most recent studies, median UIC clearly exceeded the threshold of 100μg/L in the school population,31–37 except in Galicia, where a borderline concentration of 103μg/L was reached,38 and in Jaén, where mean UIC was only 90μg/L, indicating a still deficient iodine intake,39 although much less marked as compared to that found in Jaén schoolchildren in 1981 (mean UIC, 62±32μg/L). It should be stressed that such a significant and generalized increase in iodine intake in schoolchildren has occurred in the absence of policies of systematic, sustained active prophylaxis with IS, except in Asturias, where the Department of Health, in addition to ordering the mandatory use of IS by school kitchens, has several times reinforced the initial campaign to promote the use of IS launched in 1983.35 With this exception, health actions consisted of specific campaigns in several ACs to promote the consumption of IS. In Galicia, a legislative initiative established that, as previously noted for Asturias, the use of IS would be mandatory in school kitchens.31,32,40 What then has been the reason for the marked change in nutritional iodine intake which has occurred since the mid 1990s of the last century in the schoolchildren from the ACs studied?
Three aspects of the results of the BC 2005 Nutrition Survey may help to elucidate the main reasons for the change seen in iodine intake by schoolchildren: (1) correction of ID has occurred in both the subgroups of schoolchildren who take IS and unfortified salt at home; (2) the median UIC of the subgroup of schoolchildren not taking IS at home has doubled as compared to the value found in schoolchildren in 1992 (132 versus 65μg/L); and (3) marked seasonal fluctuations have been seen during the year in UIC, with 55% higher values found in late autumn and winter (when the highest UICs were seen) as compared to summer and early autumn (when lowest UICs were seen).
The main dietary sources of iodine in many industrialized countries are IS and some foods enriched with iodine during production and processing, particularly milk and dairy products, and in some countries also, bread.41,42 The consumption of iodine-containing seaweed is very limited in the Western world.
One of the factors influencing the increase in iodine intake by the study population was IS use in the home. The median UIC of schoolchildren from households where IS was used was 25% higher as compared to the median UIC of children taking unfortified salt (165 versus 132μg/L). Such a limited but significant difference, combined with the fact that the median UIC of schoolchildren taking IS at home had doubled as compared to that found in schoolchildren in 1992, suggests that most of the increase in UICs that occurred in the BC school population between 1992 and 2005 was due to factors other than the domestic use of IS, and that both schoolchildren taking IS and unfortified salt at home had had access to very significant iodine sources not available to or used by the school population between 1988 and 1992.
The use of IS in school kitchens is one of the potential iodine sources other than the use of IS in the home. However, when the Nutrition Survey was conducted (2004–2005), only 28.7% of children and adolescents in the BC had lunch in school dining rooms.25 In addition, although some ACs, such as Asturias and Galicia, have regulations that make the use of IS at school kitchens mandatory,31,32,40 no such regulation exists in the BC.
Another potential iodine source, whose use was not considered in the BC Nutrition Survey, could be the widespread use by schoolchildren of vitamin and mineral preparations including iodine, but this hypothesis appears unlikely. It does not seem plausible either that the increase in UICs was due to widespread use of topical iodinated antiseptics by schoolchildren before urine sample collection. Increased urinary iodine excretion may be due to access to dietary sources of iodine other than the use of IS at home and in school kitchens. However, since the iodine levels of most foods eaten in a given geographic area are not usually known, it is normally difficult to identify dietary sources of iodine unless total diet studies are conducted.43 The original iodine contents of a wide variety of food items (including frequently used foods such as bread, milk, eggs, and meat) may increase to a variable degree as the result of practices used during their production and processing.41,42 As the result, marked differences may even occur in the concentrations of the micronutrient in a given food item.42 Increases in iodine concentration during food production mainly occur in food from animal sources due to the use of IS and iodine-enriched feeds, iodinated veterinary medicines, and iodinated antiseptic agents (iodophors), while increases during food processing are due to the use of IS and additives that contain iodine.41,42 Only a few manufactured food products sold in our market include IS in the list of ingredients on their labels. The iodination of feed for animals bred to produce food for human consumption and the use of IS blocks for licking during grazing times are intended to provide adequate iodine to prevent ID and so avoid economic losses caused by IDDs in such animals, to improve their health, and to increase their productivity.44 As the result of iodine prophylaxis given to dairy cows, laying hens, cattle, swine, and other livestock, significant increases occur in the iodine contents of some foods from animal sources such as milk and eggs, in which iodine enrichment is much greater than in meat from poultry and cattle.44 Thus, milk and dairy products, because of their frequent and abundant consumption, have became vehicles that provide a substantial proportion of dietary iodine in the United States45 and in European countries such as Finland, Sweden, Norway, the United Kingdom, Denmark, Germany, France, Switzerland, Italy, and the Czech Republic.46–55 Many iodine-enriched foods of animal origin, particularly milk, have played a role in the increased iodine intake which has occurred in BC schoolchildren.
Although the increase in UIC seen in BC schoolchildren could be due to various iodine sources, those able to cause seasonal fluctuations in urinary iodine excretion are of particular note. Indeed, one of the most interesting findings in the research on nutritional iodine status in the setting of the 2005 Nutrition Survey of the BC was based on the observation that the UIC values of schoolchildren varied with the month of urine sample collection. Analysis of the results showed that median UIC was not relatively constant throughout the study (March 2004–February 2005), but showed highly marked fluctuations. The lowest UICs were found in urine samples collected from June to September 2004, while the highest values were seen in samples collected from November 2004 to February 2005 (median UICs of 123 and 191μg/L respectively; p<0.001). This seasonal pattern in urinary iodine excretion reflected also variable iodine intake during the year, with marked seasonal fluctuations, and suggests that the consumption of milk from cows given feed supplemented with iodine-containing additives and iodine-rich dairy products obtained from such milk is one of the determining factors of increased iodine intake by schoolchildren.
The consumption of milk from cows given iodinated feeds is the only known factor that may result in much lower urinary iodine excretions in summer than in winter in children and, to a lesser extent, adults.50,53,56,57 The main reason why milk from cows fed nutritional supplements containing iodine in their composition has a higher iodine content in winter than in summer is the greater dependence on feed during winter due to the decreased availability of pasture.44 A search of the scientific literature for cross-sectional population studies providing information on seasonal changes in UIC in schoolchildren found no such studies, possibly because in cross-sectional studies to ascertain nutritional iodine status, urine samples are usually collected during short time periods which do not allow for observing changes occurring in UIC during the year such as those found in the BC 2005 Nutrition Survey.
In Europe, iodine prophylaxis was first used for cattle in the United Kingdom in the late 1930s,58 and was subsequently introduced into Finland, Sweden, and Norway during the 1950s.46,48 However, active policies to encourage the iodination of cattle feed were not extended to other European countries such as Denmark, Germany, Switzerland, France, Italy, the Czech Republic, and Poland until the late 1980s and, especially, the 1990s. The resultant increase in iodine levels in cow's milk occurred in these countries at the end of the 20th century.51–55,59,60 As regards Spain, in a study conducted in 1997 and 1998 on schoolchildren from Axarquia (Malaga), dairy products (milk, yoghurt, and milk shakes) were the only food group associated with urinary iodine concentration. The relationship was linear and dependent on the amount taken.61 A recent study, conducted in 2008, showed that the cow's milk currently consumed in Spain is rich in iodine, with a mean iodine content of 259 (58)μg/L.62
In the BC, the great increase in the median UIC of schoolchildren from 1992 to 1998, which occurred without the prior implementation of active policies for IS prophylaxis in the population, suggests that during that time period, and similar to what was also occurring in several European countries, the consumption of milk from cows given feed supplemented with iodinated additives became a significant iodine source for that group, and that the increase in iodine concentration in milk therefore occurred very rapidly from 1992. A research conducted during 2008 and 2009 to verify whether cow's milk usually consumed in the BC is actually a significant source of iodine and whether seasonal fluctuations exist in iodine concentration found a mean iodide concentration (and standard deviation) in milk of 197.6 (58.1)μg/L (total iodine, 227μg/L), and that iodine concentration was 48% higher during winter and spring than in summer and autumn (Arrizabalaga et al., 2012). Iodine levels in milk from cows given iodine-enriched feed confer iodine-rich milk and its derivatives a special relevance as iodine vectors for children and adolescents because of the significant role played by milk and yoghurt in their diet. In the BC, children aged 6–14 years consume daily 482.5 (183.9)g of milk and dairy products,25 essentially as milk, 306.8 (160.7)g/day, and yoghurt, 118 (99.1)g/day. Thus, the main current dietary sources of iodine for BC schoolchildren are IS (which has one of the highest iodine concentrations in Europe19) and milk from cows given feed supplemented with iodinated additives and iodine-rich dairy products obtained from such milk.
The proportion of 4.9% (95% CI: 3.1–6.7%) of UIC values less than 50μg/L found in BC schoolchildren is close to the proportions usually seen in schoolchildren with optimum iodine intake. In an analysis of UIC distribution in several populations of schoolchildren (26,636 subjects in total) with optimum iodine intake (median UIC ranging from 100 to 199μg/L and a median of 157μg/L for the overall population) UIC values less than 50μg/L were found in 7.8%.63
Although increased iodine intake has eradicated ID in BC schoolchildren, there is still room for improvement, as the proportion of those with UIC values <100μg/L is significantly greater in the subgroup taking salt unfortified with iodine at home as compared to the subgroup taking IS (32.1% versus 20.9%; p<0.001). Since the proportion of households using IS is still far below that recommended by the WHO and other international organizations, health authorities should make an effort to promote the use of IS in the more than 90% of households where salt is used. This would also allow most women of childbearing age to acquire the thyroid reserves of iodine needed to cope with the initial stage of pregnancy. While the extension of IS usage contributes to the increase in the proportion of schoolchildren with UIC≥300μg/L, the highest UIC values are more likely to be due to a high intake of milk and yoghurt and dairy drinks than to IS, which is normally used in small amounts. It is to be expected that those who consume large amounts of milk and dairy products in adolescence will subsequently decrease their intake. In any case, the benefits provided by the eradication of ID are enormous as compared to the harmful effects of excess iodine in some susceptible subjects, whose health and social impact is much lower than that of ID.64
After the substantial increase in iodine intake which has occurred in recent years in several European countries, mainly promoted by the great increase in iodine levels in cow's milk and by the addition of IS during the processing of some foods, a change in the opposite direction may be expected in the near future as the recommendation by the WHO to decrease salt consumption by the general population to 5–6g daily is extended and the resultant decrease in the amount of iodine provided by IS occurs. On the other hand, this is an open scenario where factors increasing iodine provision, such as the addition of IS to a greater number of processed foods and the extension of IS use to a higher number of households, may be involved. Studies to ascertain both nutritional iodine status and the proportion of IS used in households should be made a regular and routine part of health programs in order that any necessary corrective measures can be taken to achieve and maintain optimum iodine intake, thus leading to the sustained eradication of IDDs. The rapid pace at which some very significant changes have occurred in iodine intake as well as the new changes foreseen for the near future reinforce the need for the permanent monitoring of urinary iodine excretion in the population. The WHO recommends that median UIC be monitored every five years at the most.17
Conflicts of interestThe authors state that they have no conflicts of interest.
The authors acknowledge the children and adolescents participating in the 2005 Nutrition Survey and their families, the Basque Institute of Statistics (EUSTAT) and Mrs. Yolanda Perez, from the Department of Health of the Basque Government, for logistic support.
Please cite this article as: Arrizabalaga JJ, et al. Evolución del estado de nutrición de yodo en los escolares de la Comunidad Autónoma del País Vasco. Endocrinol Nutr. 2012;59(8):474–84.
