


To assess age- and sex-specific percentile baseline data for total cholesterol (TC), triglycerides (TG), and high-density lipoprotein cholesterol (HDL-C) in Colombian children and adolescents aged 10–17 years.
Patients and methodsA cross-sectional, descriptive study was conducted on 1773 children and adolescents. Each participant underwent a fasting measurement to quantify TC, HDL-C, and TG levels using enzymatic–colorimetric methods. Smoothed age- and sex-specific 5th, 25th, 50th, 75th, 90th and 95th percentile values were derived using LMS regression (Least Mean Square) using the statistical package Growth Analyzer.
ResultsOverall, males had lower serum TC and TG levels as compared to females. P95 of TG and TC was higher in males aged 10–14 years as compared to females, while HDL-C levels were similar in both sexes.
ConclusionsPercentile values will help classify children and adolescents as compared to other populations based on this health indicator.
Determinar los valores por edad y sexo de los lípidos séricos colesterol total (CT), triglicéridos (TG), y colesterol de lipoproteínas de alta densidad (c-HDL) de niños y adolescentes de 10 a 17 años de Colombia.
Material y métodosEstudio descriptivo de corte transversal en 1.773 niños y adolescentes. A cada participante se le realizó una medición en ayunas para cuantificar los niveles de CT, c-HDL y TG utilizando métodos enzimático-colorimétricos. Se calcularon centiles a partir de la regresión LMS por edad y sexo p5, p25, p50, p75, p90 y p95 con el método de los Least Mean squares (LMS, ‘mínimos cuadrados’) por curvas centiles que representan la asimetría, la mediana y la variabilidad utilizando el paquete estadístico Growth Analyzer.
ResultadosEn general, los hombres presentan menores valores de CT y TG séricos que las mujeres. El p95 de los TG y CT en los hombres de las edades de 10 a 14 años fue mayor que en las mujeres, mientras que los niveles de c-HDL fueron similares en ambos sexos y edades.
ConclusionesLa obtención de valores centiles ayudará a clasificar los niños y adolescentes con respecto a otras poblaciones en función de este indicador de salud.
Atherosclerosis is an asymptomatic, chronic process that starts at a very early age and progresses into adulthood.1–4Postmortem studies on infants and stillbirths have reported the presence of atherosclerotic lesions in coronary and common carotid arteries associated with hypercholesterolemia and dyslipidemia.5 Based on these observations, several authors2–4 have proposed early measurement of the different lipid components as one of the strategies for the early prevention of chronic diseases in adults. The systematic surveys of the National Cholesterol Education Program Adult Treatment Panel III (NCEP ATP III), which have defined early quantification in children and adolescents of the different lipid fractions as a primary objective, are an example of this approach.
In addition to increased total cholesterol (TC), high triglyceride (FG) levels and low high-density lipoprotein cholesterol (HDL-C) levels are also considered early markers of atherogenic dyslipidemia7–14. In this regard, Hu et al.15 and Madhavan et al.16 showed that in Asian and Indian children and adolescents, increased lipid values are associated with the occurrence of cardiovascular risk factors in adulthood.
In Latin America, and especially in Colombia, proposals for this population in this regard are very few. Changes in the different lipid constituents in blood are usually considered as risk factors for non-transmissible chronic diseases9 because of their close correlation to cardiovascular disease and have been recommended as a primary prevention target.10–14 The purpose of this study was to assess the centile curves and values for serum lipids (TC, TG, and HDL-C) by age and sex in Colombian school children and adolescents aged 10–17 years.
MethodsA descriptive, cross-sectional study was conducted on urban school children and adolescents of both sexes aged 10–17 years. In order to be able to establish trends by age and sex, a 5% significance level and an 80% power were calculated to obtain a sample size of 40 observations for each of the educational institutions.17 For sample selection, the total number of students by sex and socioeconomic stratum was estimated from a listing of educational institutions registered at the municipal education secretary of Valle del Cauca. Using probabilistic sampling and by stages, aggregates (schools) were selected by proportionality to the size for each age group (α=0.05, β=0.80, and σ=1.96).
Schools were selected in each stratum until the desired number was completed. The records of 1773 children and adolescents of both sexes (865 males and 908 females) were considered in this study.
Ten milliliters of blood were drawn into tubes with no additive by puncture into an antecubital vein. Blood samples were transported to the laboratory in iceboxes at between 4°C and 8°C, and were centrifuged at 3000rpm within 1h to obtain serum until processing. The different lipid fractions were measured using a direct colorimetric method in the presence of EDTA disodium 8mM and GOP-PAP in an automated spectrophotometer by detergent solubilization (Biosystems, Spain). Before sample testing, we verified that the precision of the different techniques was within the accepted ranges, i.e. with a coefficient of variation less than 10%. As precision and accuracy controls, commercial standards with known concentrations (Biosystems, Spain) were included in each group of tests.
Statistical analysis was performed using SPSS 14.0 software. To analyze variability in the different lipid fractions, normality tests were performed beforehand using the Kolmogorov–Smirnov and Shapiro–Wilk tests. TC, TG, and HDL-C percentiles were calculated using the least mean square method (LMS)18 as a function of age by the centile curves representing asymmetry, median, and variability, using Growth Analyser statistical software and LMS for the construction of centile curves, freely accessible at the Dutch Growth Foundation (version 2, 2001–2003) and Institute of Child Health (London) (URL: http://www.growthanalyser.org).
The study was conducted in accordance with the ethical rules as set down in the Declaration of Helsinki and the applicable Colombian legal regulations governing clinical research in humans (Decision 008430 of the Colombian Ministry of Health) after approval by the ethics committee of Universidad del Valle. At each of the selected institutions, parents and/or a guardian were required to give their approval for child participation by giving their written informed consent.
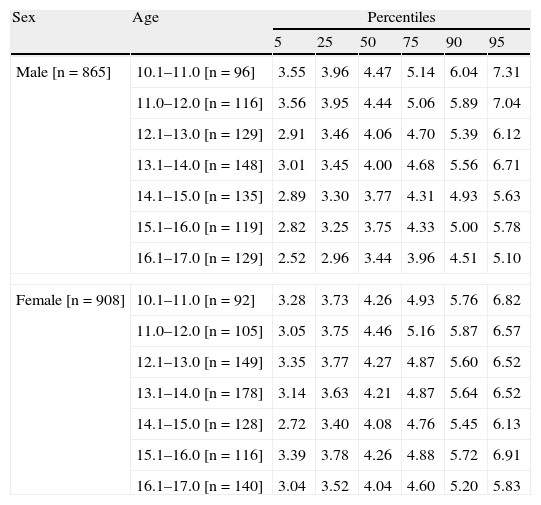
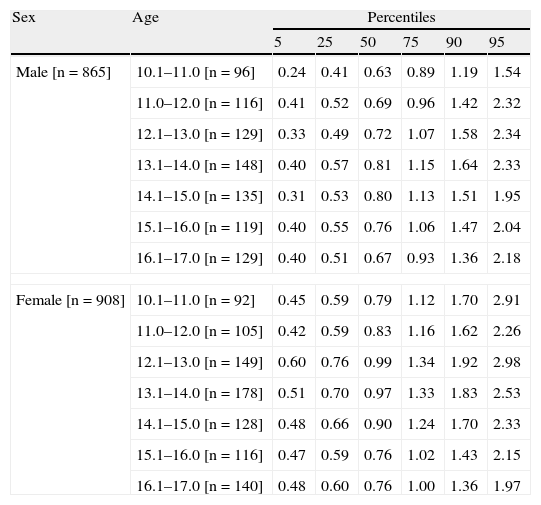
ResultsMales usually had lower serum TC and TG levels as compared to females. An increase in these lipid fractions was found at 10–14 years, and was followed by a decrease in both sexes between 15 and 17 years of age (Tables 1 and 2; Fig. 1). P95 for TC was higher in females except at 10–12 years of age. P95 for TG was higher in males aged 11–12 years and 16–17 years as compared to females. Females had higher values of this lipid fraction at all other ages.
Sex- and age-specific cholesterol percentiles in children and adolescents aged 10–17 years (n=1773).
| Sex | Age | Percentiles | |||||
| 5 | 25 | 50 | 75 | 90 | 95 | ||
| Male [n=865] | 10.1–11.0 [n=96] | 3.55 | 3.96 | 4.47 | 5.14 | 6.04 | 7.31 |
| 11.0–12.0 [n=116] | 3.56 | 3.95 | 4.44 | 5.06 | 5.89 | 7.04 | |
| 12.1–13.0 [n=129] | 2.91 | 3.46 | 4.06 | 4.70 | 5.39 | 6.12 | |
| 13.1–14.0 [n=148] | 3.01 | 3.45 | 4.00 | 4.68 | 5.56 | 6.71 | |
| 14.1–15.0 [n=135] | 2.89 | 3.30 | 3.77 | 4.31 | 4.93 | 5.63 | |
| 15.1–16.0 [n=119] | 2.82 | 3.25 | 3.75 | 4.33 | 5.00 | 5.78 | |
| 16.1–17.0 [n=129] | 2.52 | 2.96 | 3.44 | 3.96 | 4.51 | 5.10 | |
| Female [n=908] | 10.1–11.0 [n=92] | 3.28 | 3.73 | 4.26 | 4.93 | 5.76 | 6.82 |
| 11.0–12.0 [n=105] | 3.05 | 3.75 | 4.46 | 5.16 | 5.87 | 6.57 | |
| 12.1–13.0 [n=149] | 3.35 | 3.77 | 4.27 | 4.87 | 5.60 | 6.52 | |
| 13.1–14.0 [n=178] | 3.14 | 3.63 | 4.21 | 4.87 | 5.64 | 6.52 | |
| 14.1–15.0 [n=128] | 2.72 | 3.40 | 4.08 | 4.76 | 5.45 | 6.13 | |
| 15.1–16.0 [n=116] | 3.39 | 3.78 | 4.26 | 4.88 | 5.72 | 6.91 | |
| 16.1–17.0 [n=140] | 3.04 | 3.52 | 4.04 | 4.60 | 5.20 | 5.83 | |
Sex- and age-specific triglyceride percentiles in children and adolescents aged 10–17 years (n=1773).
| Sex | Age | Percentiles | |||||
| 5 | 25 | 50 | 75 | 90 | 95 | ||
| Male [n=865] | 10.1–11.0 [n=96] | 0.24 | 0.41 | 0.63 | 0.89 | 1.19 | 1.54 |
| 11.0–12.0 [n=116] | 0.41 | 0.52 | 0.69 | 0.96 | 1.42 | 2.32 | |
| 12.1–13.0 [n=129] | 0.33 | 0.49 | 0.72 | 1.07 | 1.58 | 2.34 | |
| 13.1–14.0 [n=148] | 0.40 | 0.57 | 0.81 | 1.15 | 1.64 | 2.33 | |
| 14.1–15.0 [n=135] | 0.31 | 0.53 | 0.80 | 1.13 | 1.51 | 1.95 | |
| 15.1–16.0 [n=119] | 0.40 | 0.55 | 0.76 | 1.06 | 1.47 | 2.04 | |
| 16.1–17.0 [n=129] | 0.40 | 0.51 | 0.67 | 0.93 | 1.36 | 2.18 | |
| Female [n=908] | 10.1–11.0 [n=92] | 0.45 | 0.59 | 0.79 | 1.12 | 1.70 | 2.91 |
| 11.0–12.0 [n=105] | 0.42 | 0.59 | 0.83 | 1.16 | 1.62 | 2.26 | |
| 12.1–13.0 [n=149] | 0.60 | 0.76 | 0.99 | 1.34 | 1.92 | 2.98 | |
| 13.1–14.0 [n=178] | 0.51 | 0.70 | 0.97 | 1.33 | 1.83 | 2.53 | |
| 14.1–15.0 [n=128] | 0.48 | 0.66 | 0.90 | 1.24 | 1.70 | 2.33 | |
| 15.1–16.0 [n=116] | 0.47 | 0.59 | 0.76 | 1.02 | 1.43 | 2.15 | |
| 16.1–17.0 [n=140] | 0.48 | 0.60 | 0.76 | 1.00 | 1.36 | 1.97 | |

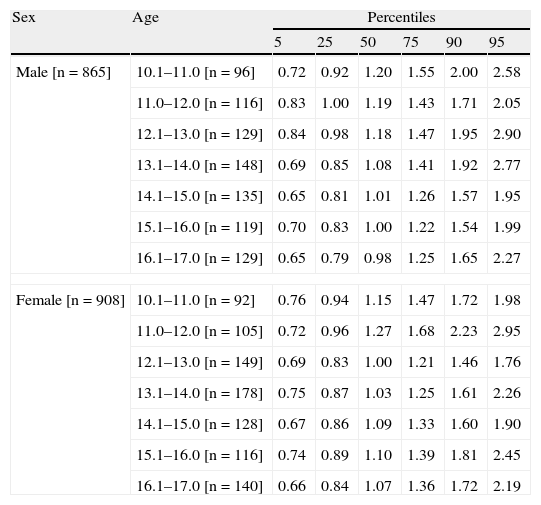
Mean HDL-C levels were similar in both sexes, and tended to decrease in the 13–17-year-old age group. P5, defined as the lower limit of HDL-C levels, remained constant in both groups. All other values are shown in Table 3 and Fig. 1.
Sex- and age-specific high density lipoprotein cholesterol percentiles in children and adolescents aged 10–17 years (n=1773).
| Sex | Age | Percentiles | |||||
| 5 | 25 | 50 | 75 | 90 | 95 | ||
| Male [n=865] | 10.1–11.0 [n=96] | 0.72 | 0.92 | 1.20 | 1.55 | 2.00 | 2.58 |
| 11.0–12.0 [n=116] | 0.83 | 1.00 | 1.19 | 1.43 | 1.71 | 2.05 | |
| 12.1–13.0 [n=129] | 0.84 | 0.98 | 1.18 | 1.47 | 1.95 | 2.90 | |
| 13.1–14.0 [n=148] | 0.69 | 0.85 | 1.08 | 1.41 | 1.92 | 2.77 | |
| 14.1–15.0 [n=135] | 0.65 | 0.81 | 1.01 | 1.26 | 1.57 | 1.95 | |
| 15.1–16.0 [n=119] | 0.70 | 0.83 | 1.00 | 1.22 | 1.54 | 1.99 | |
| 16.1–17.0 [n=129] | 0.65 | 0.79 | 0.98 | 1.25 | 1.65 | 2.27 | |
| Female [n=908] | 10.1–11.0 [n=92] | 0.76 | 0.94 | 1.15 | 1.47 | 1.72 | 1.98 |
| 11.0–12.0 [n=105] | 0.72 | 0.96 | 1.27 | 1.68 | 2.23 | 2.95 | |
| 12.1–13.0 [n=149] | 0.69 | 0.83 | 1.00 | 1.21 | 1.46 | 1.76 | |
| 13.1–14.0 [n=178] | 0.75 | 0.87 | 1.03 | 1.25 | 1.61 | 2.26 | |
| 14.1–15.0 [n=128] | 0.67 | 0.86 | 1.09 | 1.33 | 1.60 | 1.90 | |
| 15.1–16.0 [n=116] | 0.74 | 0.89 | 1.10 | 1.39 | 1.81 | 2.45 | |
| 16.1–17.0 [n=140] | 0.66 | 0.84 | 1.07 | 1.36 | 1.72 | 2.19 | |
The purpose of this study was to assess age– and sex–specific centile data of lipid fractions (TC, TG, and HDL-C) in Colombian school children and adolescents aged 10–17 years. These data may be useful as comparative values in an urban school population and/or to plan and implement cardiovascular disease prevention programs.
These results agree with those of a study conducted in US children and adolescents aged 5–19 years, especially with regard to TC and TG levels.19 However, P95 values for TC and TG were higher in females from our population as compared to those reported in the US study19. Other studies conducted in Australia,20 Asia,15 and Greece21 reported findings similar to our study.
Our results also show that TG levels in females were slightly higher than those seen in the NHANES III study, and this trend was maintained at percentiles higher than P75.6,19,20 Males in this study also had more HDL-C levels in the lower percentiles than their counterparts in the US19,20 and India.16 Other studies6,19,20 reported higher lipid values in girls (as compared to boys) aged 12–14 and 6–15 years. It has been suggested that these differences may be related to the ethnic origin of the population, cultural or sexual maturation differences, and the influence of adiposity, which is greater in females as compared to males during puberty. Overall, we found that female sex may be considered to be a factor for an increased risk of dyslipidemia in this group of children and adolescents. It should be noted that these trends may persist into adulthood and that lifestyle changes are related in the short term to improvements in different values, including those of the serum lipid profile assessed.22–24 This makes it even more necessary to have sex- and age-specific references for each population, such as the ones reported in this study.
The limitations of this study, such as its inherent characteristics in terms of study design and limited sample size, and particularly the procedure for measuring the different lipid fractions, should be considered when results are interpreted or comparisons are made with other studies. One recommendation could be that the findings in this study of lipid values in children and adolescents now be obtained from longitudinal studies, which are also able to assess physiological changes in the different growth and development stages. However, this study provides data that may serve as the basis for future research into lipid levels in the southeast area of Colombia, thus giving the opportunity to assess not only different lipid constituents, but also age- and sex-specific centile curves.
As a conclusion, these centile values will help in classifying children and adolescents by comparing them with other reference populations in terms of metabolic status. Despite its significance, this cardiovascular risk marker is not yet part of the nutritional and medical assessment protocol for school children and adolescents from the different regions of Colombia.
Conflicts of interestThe authors state that they have no conflicts of interest.
Please, cite this article as: Ramírez-Vélez R, et al. Centiles de lípidos séricos en adolescentes de Colombia. Endocrinol Nutr. 2011;58:395-400.
