


Cardiovascular risk estimation in patients with overweight/obesity is not standardized. Our objectives were to stratify cardiovascular risk using different scores, to analyze use of statins, to report the prevalence of carotid atherosclerotic plaque (CAP), and to determine the optimal cut-off point (OCP) of scores that discriminate between subjects with or without CAP.
Material and methodsNon-diabetic patients with overweight or obesity in primary prevention were enrolled. The Framingham score (FS), the European score (ES), and the score proposed by the new American guidelines (NS) were calculated, and statin indication was evaluated. Prevalence of CAP was determined by ultrasound examination. A ROC analysis was performed.
ResultsA total of 474 patients (67% with overweight and 33% obese) were enrolled into the study. The FS classified the largest number of subjects as low risk. PAC prevalence was higher in obese as compared to overweight subjects (44.8% vs 36.1%, P=.04). According to the FS, ES, and NS respectively, 26.7%, 39.1%, and 39.1% of overweight subjects and 28.6%, 39.0%, and 39.0% of obese subjects had an absolute indication for statins. All three scores were shown to acceptably discriminate between subjects with and without CAP (area under the curve >0.7). The OCPs evaluated did not agree with the risk category values.
ConclusionsRisk stratification and use of statins varied in the overweight/obese population depending on the function used. Understanding of the relationship between scores and presence of CAP may optimize risk estimate.
La estimación del riesgo cardiovascular en pacientes con sobrepeso/obesidad no está estandarizada. Nuestros objetivos fueron: estratificar el riesgo cardiovascular mediante distintos puntajes, analizar la indicación de estatinas, describir la prevalencia de placa aterosclerótica carotídea (PAC) y determinar el punto de corte óptimo (PCO) de los puntajes que discriminen entre sujetos con o sin PAC.
Material y métodosIncluimos a pacientes no diabéticos con sobrepeso u obesidad en prevención primaria. Calculamos los puntajes de Framingham (PF) y europeo (PE), y el propuesto por las nuevas guías norteamericanas (NP), evaluando la indicación de estatinas. Determinamos la prevalencia de PAC mediante ultrasonido. Realizamos un análisis ROC.
ResultadosSe incluyó a 474 pacientes (67% con sobrepeso y 33% obesos). El PF fue el que más sujetos clasificó como «bajo riesgo». La prevalencia de PAC fue mayor en los obesos en comparación con los sujetos con sobrepeso (44.8% vs. 36.1%, p=0,04). Basándose en el PF, PE y NP, el 26,7, el 39,1 y el 39,1% de los sujetos con sobrepeso y el 28,6, el 39,0 y el 39,0% de los obesos tenían indicación absoluta de estatinas. Los 3 puntajes mostraron discriminar aceptablemente entre sujetos con o sin PAC (área bajo la curva >0,7). Los PCO evaluados no necesariamente coincidieron con los valores que determinan las categorías de riesgo.
ConclusionesEn esta población con sobrepeso/obesidad, la estratificación de riesgo y la indicación de estatinas variaron según la función utilizada. Conocer la relación entre los puntajes y la presencia de PAC podría optimizar la estimación de riesgo.
The prevalence of overweight and obesity has substantially increased worldwide and has become an epidemic.1,2 Weight increase is associated with other cardiovascular risk factors such as high blood pressure, dyslipidemia, diabetes, or metabolic syndrome.3 In the overall population, a higher body mass index (BMI) is associated with increased cardiovascular morbidity and mortality.4,5
However, a proportion of subjects with overweight or obesity do not have the metabolic changes usually seen in these types of patients (“the healthy obese”). Thus, although no definitive evidence exists, it has been postulated that cardiovascular risk is not homogeneous in overweight or obese patients.6–8
Several scores for predicting cardiovascular risk have been developed from large epidemiological studies, particularly the 10-year Framingham score (FS) and the European score (ES).9,10 However, these risk functions do not include obesity or overweight among the variables used to calculate the score. The new US guidelines (American College of Cardiology/American Heart Association) for cholesterol management were issued at the end of 2013.11 These guidelines recommend a new risk score (NS), but do not use overweight or obesity for calculation either. Our group previously investigated the clinical applicability of different scores in a primary prevention population without specifically assessing the overweight or obese population.12
On the other hand, there is evidence that the addition of information regarding the presence or absence of a carotid atherosclerotic plaque (CAP) to a model consisting of the traditional risk factors facilitates the prediction of cardiovascular events.13 The optimal cut-off point (OCP) that best discriminates between subjects with or without CAP in several risk scores has previously been assessed,12,14,15 but a similar analysis has not been reported in the population with an increased BMI.
A better understanding of the clinical applicability of the most widely used risk scores and their relationship to subclinical atheromatosis in the population with overweight or obesity could help us to optimize cardiovascular risk stratification and, as a consequence, to apply more intensive preventive measures in patients in whom they are warranted.
Based on the above considerations, our study objectives were: (1) to stratify cardiovascular risk in overweight and obese patients in primary prevention using three risk scores (ES, FS, and NS); (2) to analyze statin indication based on the results of each risk score; (3) to report the prevalence of CAP in the different risk strata according to the different scores; (4) to determine the optimum cut-off point in FS, ES, and NS that discriminates between subjects (overweight and obese) with or without evidence of CAP.
Materials and methodsA multicenter, descriptive, cross-sectional study was made of consecutive samples from cardiovascular prevention clinics from six cardiology centers in Buenos Aires, Argentina. Subjects aged 20–79 years were enrolled, with patients having the following characteristics being excluded: (1) prior cardiovascular disease; (2) a history of diabetes mellitus, and (3) prior lipid lowering treatment.
Definition of variablesOverweight was defined as a BMI ranging from 25 to 29.99kg/m2, and obesity as a BMI≥30kg/m2.
Three risk scores were calculated:
- 1.
FS for coronary events using the third report of the expert panel of the National Cholesterol Education Program on the detection, evaluation, and treatment of high blood cholesterol in adults (ATP III). Low, moderate or high risk were defined as <10%, 10–19%, and ≥20%, respectively.16 The suitability of statin treatment (absolute or optional indications) was determined based on the ATP III guidelines (the estimated risk and LDL-C level being taken into account).
- 2.
ES for fatal events use the score for low risk countries. Risk was defined as low, moderate, high, or very high when it was <1%, 1–4.9%, 5–9.9%, or ≥10%, respectively. Definitive and optional indications for statins were defined (risk and LDL-C level being taken into account) based on European cardiovascular prevention guidelines.17
- 3.
The NS score is used by the most recent US guidelines for cholesterol management.11 A “definitive indication for statins” was defined as LDL-C≥190mg/dL or a patient aged 40–75 years with LDL-C levels ranging from 70 to 189mg/dL and a risk of ≥7.5%. A risk ranging from 5% to 7.4% or any other event supported by the guidelines was considered to be an “optional indication for statins”.
CAP was quantified non-invasively using ultrasound. The presence of plaque was defined based on the following criteria (ARIC group definition): (1) abnormal wall thickness (intima-media thickness>1.5mm); (2) abnormal structure (protrusion into the lumen, loss of alignment with the adjacent wall), and (3) abnormal wall echogenicity. The prevalence of CAP was compared between the different risk categories in the different scores used in both the overweight and obese populations.
Statistical analysisA receiver operating characteristic (ROC) analysis was performed to determine the area under the curve in order to assess the precision of the different scores in order to discriminate between subjects with or without CAP. The Younden index (maximum vertical distance between the ROC curve and the statistical chance line [CJ point]) was used to determine the OCP of such scores. Continuous data between two groups were analyzed using a Student's t test if variable distribution was normal, or with the Mann–Whitney–Wilcoxon test if distribution was not normal. Categorical data were analyzed using a Chi-square test.
Agreement between the FS and the ES in classifying patients into the low, moderate, or high/very high risk categories was analyzed using Cohen's kappa index. Agreement was defined as mild or poor, acceptable or fair, moderate, substantial, or almost perfect if the kappa value was <0.20, 0.21–0.40, 0.41–0.60, 0.61–0.80, and 0.81–1 respectively.18
Continuous variables are given as mean±standard deviation, while categorical variables are given as percentages. A value of p<0.05 was considered statistically significant.
The study was conducted in compliance with the recommendations for medical research suggested by the Declaration of Helsinki, Glood Clinical Practice Standards, and the applicable ethical regulations.
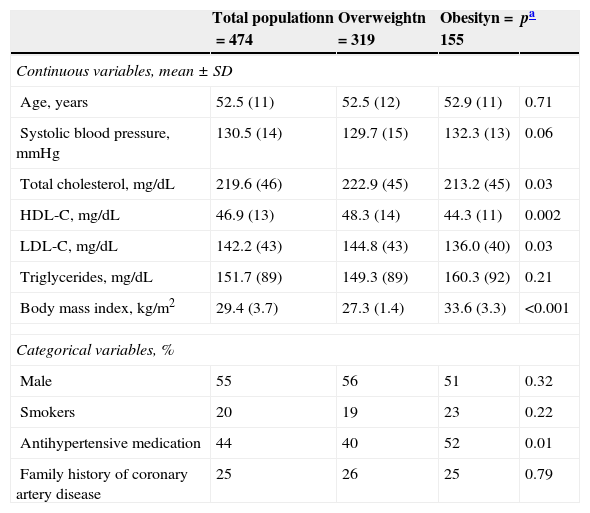
ResultsRisk stratificationThis analysis included 474 patients (aged 52.5±11 years, 55% males), 319 overweight (67%) and 155 obese (33%). Table 1 shows the characteristics of the population.
Characteristics of the population.
| Total populationn=474 | Overweightn=319 | Obesityn=155 | pa | |
|---|---|---|---|---|
| Continuous variables, mean±SD | ||||
| Age, years | 52.5 (11) | 52.5 (12) | 52.9 (11) | 0.71 |
| Systolic blood pressure, mmHg | 130.5 (14) | 129.7 (15) | 132.3 (13) | 0.06 |
| Total cholesterol, mg/dL | 219.6 (46) | 222.9 (45) | 213.2 (45) | 0.03 |
| HDL-C, mg/dL | 46.9 (13) | 48.3 (14) | 44.3 (11) | 0.002 |
| LDL-C, mg/dL | 142.2 (43) | 144.8 (43) | 136.0 (40) | 0.03 |
| Triglycerides, mg/dL | 151.7 (89) | 149.3 (89) | 160.3 (92) | 0.21 |
| Body mass index, kg/m2 | 29.4 (3.7) | 27.3 (1.4) | 33.6 (3.3) | <0.001 |
| Categorical variables, % | ||||
| Male | 55 | 56 | 51 | 0.32 |
| Smokers | 20 | 19 | 23 | 0.22 |
| Antihypertensive medication | 44 | 40 | 52 | 0.01 |
| Family history of coronary artery disease | 25 | 26 | 25 | 0.79 |
HDL-C, high density lipoprotein cholesterol; LDL-C, low density lipoprotein cholesterol; SD, standard deviation.
Mean values in the FS were 7.4%±6.9%, 7.1%±6.7%, and 7.9%±7.1% for the overall population and overweight and obese subjects, respectively (p=0.24). Mean ES values were 1.9%±2.3%, 1.8%±2.2%, and 1.9%±2.3% in the overall population and overweight and obese subjects, respectively (ES=0.63). Finally, mean NS values were 7.9%±7.2%, 7.9%±7.4%, and 8.1%±6.8% in the same groups as above (p=0.71).
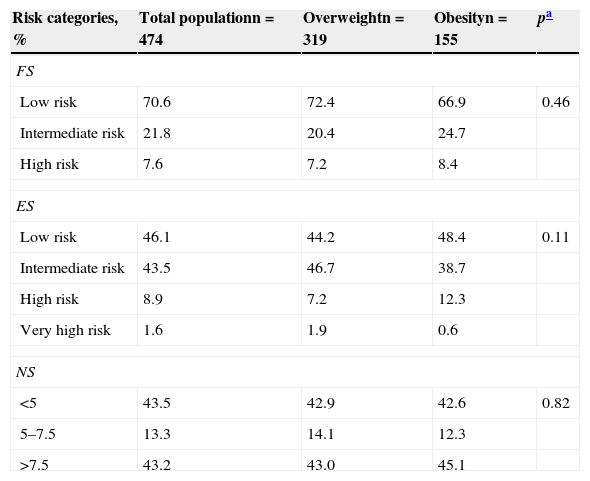
When the FS was used, most patients with overweight (72.4%) and obesity (66.9%) were classified as low risk. When the ES was used, approximately half the overweight or obese patients were considered to be at low risk. Only 1.9% and 0.6% of overweight and obese patients, respectively were classified as having a very high risk. Table 2 shows risk stratification in the overall population and overweight and obese subjects when the different scores were used.
Risk stratification according to the different risk scores.
| Risk categories, % | Total populationn=474 | Overweightn=319 | Obesityn=155 | pa |
|---|---|---|---|---|
| FS | ||||
| Low risk | 70.6 | 72.4 | 66.9 | 0.46 |
| Intermediate risk | 21.8 | 20.4 | 24.7 | |
| High risk | 7.6 | 7.2 | 8.4 | |
| ES | ||||
| Low risk | 46.1 | 44.2 | 48.4 | 0.11 |
| Intermediate risk | 43.5 | 46.7 | 38.7 | |
| High risk | 8.9 | 7.2 | 12.3 | |
| Very high risk | 1.6 | 1.9 | 0.6 | |
| NS | ||||
| <5 | 43.5 | 42.9 | 42.6 | 0.82 |
| 5–7.5 | 13.3 | 14.1 | 12.3 | |
| >7.5 | 43.2 | 43.0 | 45.1 | |
NS, new US score; ES, European score: FS, Framingham score.
Agreement between the FS and the ES in the classification of patients as being at low, moderate, or high/very high risk was fair in the overall population (kappa=0.32) and in overweight (kappa=0.29) and obese patients (kappa=0.39).
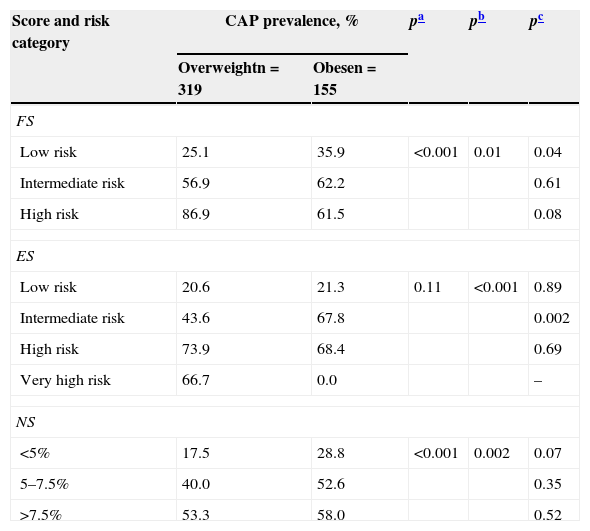
Prevalence of carotid atherosclerotic plaqueCAP prevalence in the overall population was 38.3%, and was higher in obese subjects (44.8%) as compared to overweight subjects (36.1%), p=0.04. Specifically, CAP prevalence was only significantly higher in obese as compared to overweight subjects in the low risk category using the FS, and in the intermediate category using the ES. CAP prevalence was also greater in the higher risk strata whatever score was used. Table 3 shows CAP prevalence in the different risk strata according to the different scores in both obese and overweight subjects.
CAP prevalence according to the different risk strata of the different scores.
| Score and risk category | CAP prevalence, % | pa | pb | pc | |
|---|---|---|---|---|---|
| Overweightn=319 | Obesen=155 | ||||
| FS | |||||
| Low risk | 25.1 | 35.9 | <0.001 | 0.01 | 0.04 |
| Intermediate risk | 56.9 | 62.2 | 0.61 | ||
| High risk | 86.9 | 61.5 | 0.08 | ||
| ES | |||||
| Low risk | 20.6 | 21.3 | 0.11 | <0.001 | 0.89 |
| Intermediate risk | 43.6 | 67.8 | 0.002 | ||
| High risk | 73.9 | 68.4 | 0.69 | ||
| Very high risk | 66.7 | 0.0 | – | ||
| NS | |||||
| <5% | 17.5 | 28.8 | <0.001 | 0.002 | 0.07 |
| 5–7.5% | 40.0 | 52.6 | 0.35 | ||
| >7.5% | 53.3 | 58.0 | 0.52 | ||
NS, new US score; CAP, carotid atherosclerotic plaque; ES, European score; FS, Framingham score.
According to ATP III, the use of statins was indicated unquestionably in 26.7% and 28.6% of patients with overweight or obesity based on the FS. When there was no absolute recommendation, an optional indication existed in 30.3% and 17.4% of subjects with overweight or obesity respectively.
When European guidelines were applied, using the ES, the immediate start of statins was recommended in 39.1% and 39.0% of overweight or obese subjects respectively, although a consideration of statin use was also proposed for the 20.6% and 20.1% of patients who did not meet this recommendation.
Finally, based on the NS, statins were absolutely indicated in 39.1% and 39.0% of overweight or obese patients respectively. Statin indication was relative or optional in 20.6% and 20.1% of the overweight and obese population respectively.
If the population with CAP was considered alone, statins were indicated (taking into consideration both absolute and optional indications for overweight and obese patients respectively) in 65.4% and 55.9% of subjects using the FS, 80.4% and 82.0% using the ES, and 79.6% and 75.0% of patients according to the NS.
Discrimination of the different scores for detecting carotid atherosclerotic plaqueThe area under the curve for the FS was 0.751 (95% CI, 0.695–0.808) in overweight patients and 0.714 (95% CI, 0.632–0.796) in obese patients. The OCP of the score was 6% (76% sensitivity, 69% specificity, Yunden 0.438) and 4.6% (76% sensitivity, 62% specificity, Yunden 0.376) for overweight and obese subjects respectively. The area under the curve for the ES was 0.786 (95% CI, 0.736–0.836) in overweight patients and 0.770 (95% CI, 0.693–0.847) in obese patients. The OCP of the score was 1.6% (65% sensitivity, 77% specificity, Yunden 0.415) and 1% (79% sensitivity, 68% specificity, Yunden 0.476) for overweight and obese subjects respectively. Finally, the area under the curve for the NS was 0.776 (95% CI, 0.722– 0.830) in overweight patients and 0.729 (95% CI, 0.645–0.813) in obese patients. The OCP of the score was 6% (74% sensitivity, 70% specificity, Yunden 0.442) and 6.2% (69% sensitivity, 73% specificity, Yunden 0.410) for overweight and obese subjects respectively. Figs. 1–3 show the area under the curve and the OCPs of the different scores in overweight and obese patients.
 and obesity (lower chart). The arrow marks the optimal cut-off point.")
 and obesity (lower chart). The arrow marks the optimal cut-off point.")
 and obesity (lower chart). The arrow marks the optimal cut-off point.")
Estimating cardiovascular risk is no easy task. The use of risk scores is a simple way to start, although no risk scores specifically designed on the basis of overweight or obese populations are available. In addition, the most widely used scores do not include the BMI in their risk calculations. Multiple clinical practice guidelines for the management of overweight and obese patients are available.19–22 However, although such guidelines advise searching for other risk factors as part of the evaluation, they do not give specific recommendations on how to stratify cardiovascular risk in this particular group of patients.
In our analysis, most patients were classified by the FS as having a low risk. When the ES was used, however, a similar proportion of patients with overweight and obesity were classified as having a low or moderate risk. Using the NS, most subjects were distributed into two risk groups, >7.5% or <5%. It should be noted that there were no significant differences between overweight and obese subjects in the mean score obtained with the different tools used. The mean FS in our study was slightly lower than that reported in other studies. For example, a study evaluating obese patients who were to undergo gastric sleeve surgery found an estimated baseline risk of 10.6%.23 However, this population was much more obese (67% had BMI>40k/m2) and 15% of the patients were diabetic. Another study evaluating the interaction between the BMI and the FS estimated an FS of 9.8% and 10.8% in overweight and obese subjects respectively. The differences with our study could again be explained by the fact that this population included diabetic patients and the FS used was for total cardiovascular events.24
Agreement between the FS and the ES in classifying patients as low, moderate, or high/very high risk was slight, which coincides with prior reports that did not specifically assess people with a high BMI. In a German study, for example, the number of patients classified as high, moderate, or low risk markedly changed when different scores were used (PROCAM, FS, and ES).25 Similarly, in a Spanish study, agreement between the FS and the REGICOR was globally very poor (kappa=0.06), and was only fair in the low risk population (kappa=0.53).26
The prevalence of CAP in our study was high, being greater in the higher risk categories. Moreover, if the low risk population was analyzed separately, this prevalence was substantial (ranging from 18% to 25% in overweight patients and from 21% to 36% in obese patients depending on the score used). The association between weight increase and the presence of subclinical atheromatosis has previously been reported. For example, a study conducted in obese women with rheumatoid arthritis showed a significant independent association between the BMI and carotid intima-media thickness and between the waist/hip ratio and the presence of CAP.27 A subanalysis of the Chilean population from the CARMELA study also showed that “metabolically ill overweight” subjects had a greater prevalence of carotid subclinical atheromatosis as compared to “metabolically healthy overweight” subjects. Both groups had a greater prevalence as compared to “metabolically healthy normal weight” subjects.28
The benefits of statins have been widely shown in subjects with no cardiovascular disease but with risk factors.29 No randomized clinical trials specifically designed for patients with an increased BMI are available. In the WOSCOPS study, pravastatin decreased cardiovascular events in subjects with and without metabolic syndrome as compared to placebo.30 A subgroup analysis of the JUPITER study also showed a significant decrease at the composite endpoint with the administration of rosuvastatin in subjects with metabolic syndrome, overweight, or obesity.31 According to our findings, statin recommendation after taking into consideration both absolute and relative indications was approximately 50%, and slightly higher when the ES or the NS was used. However, statin indication (absolute and relative) was more common in the patient subgroup with CAP when the ES was used, followed by the NS and, to a lesser extent, when the FS was used. In the latter case, approximately 35–55% of patients evaluated did not receive statins.
In our study, based on the ROC analysis, the ES proved to be the most effective in discriminating between subjects with and without CAP in both the obese and overweight groups. The OCPs of several scores for discriminating between subjects with and without CAP, but not in specifically overweight or obese populations, were previously assessed. For example, the OCP of the FS at 30 years based on the lipid profile was 26%.14 The OCP of the FS for detecting CAP in a group of postmenopausal women in primary prevention was 3%.15 In our study, the OCPs of the FS in overweight and obese subjects were 6% and 4.6% respectively. Such OCPs are far below the classical value >10% that classifies our patients as “not at risk”. FS values <6% in overweight subjects or <4.6% in obese subjects decrease the chance of having carotid subclinical atherosclerosis and so avoid the need for requesting some supplemental method to adjust cardiovascular risk.
The OCPs in the ES were, however, 1.6% and 1% (overweight and obesity), values higher than the 1% threshold proposed as the limit for considering our patients as being at low risk. In this case, if a value ≥1.6% or ≥1% was found in the ES in overweight or obese patients respectively, information from the carotid echo-Doppler could provide useful data for improving cardiovascular risk stratification. Finally, the OCPs in the NS were 6% and 6.2% for overweight and obese patients respectively. These values are lower than the 7.5% proposed by the new guidelines as the limit for absolute statin indication. The disagreement between the OCPs estimated in our study and the classical thresholds that limit risk categories may be explained by several facts: (1) our study assessed the presence of subclinical atheromatosis, rather than clinical events; (2) a predictive tool was used in a population which was geographically different from the one where the scores originated; and (3) the whole population assessed in our research had overweight or obesity. These potential explanations are speculative, but support the idea that the different cut-off points should be reviewed in local studies specifically designed for that purpose.
Finally, it should be recognized that not all risk scores estimate the same clinical events, and comparisons between such scores should be interpreted with caution. Our study findings may change if other risk scores not assessed in our research are used.
In conclusion, our findings show that the population of overweight and obese subjects assessed had a heterogeneous cardiovascular risk. The prevalence of CAP was substantial even in the low risk population. The ES showed a better discriminatory power for detecting CAP and, in accordance with the European guidelines based on this score, should lead to statin use being recommended more frequently. Our results show the limitations of cardiovascular risk stratification using the conventional scores in this type of patient, and suggest the need for specifically designed research in populations with a high body weight.
Conflict of interestThe authors state that they have no conflicts of interest.
Please cite this article as: Masson W, Lobo M, Huerín M, Molinero G, Manente D, Pángaro M, et al. Estratificación del riesgo cardiovascular en pacientes con sobrepeso u obesidad en prevención primaria. Implicaciones en la utilización de estatinas. Endocrinol Nutr. 2015;62:83–90.
