


To assess the value of body adiposity index (BAI) as a marker of obesity and predictor of cardiovascular disease (CVD).
Materials and methodsA cross-sectional study in 527 volunteers from the education and automotive sector in Bogotá, Colombia. BAI was calculated using the Bergman et al. equation ([hip circumference in cm)/[height in m2]1.5−18]). Anthropometric, clinical and laboratory data were collected, cholesterol/HDL-C, LDL-C/HDL-C; triglycerides/HDL-C and lipid-metabolic index (LMI) ratios were calculated. Prevalence rates and means, according to tertiles (T), and multivariate analysis between the BAI and anthropometric, clinical, and laboratory markers were estimated.
ResultsObesity prevalence was 33.9% (BAI>27.5%). Subjects with lower BAI (T-1) had lower cholesterol, triglycerides/HDL-C, and cholesterol/HDL-C levels and better LMI; P<.001. The multivariate model showed in T-3 subjects an OR 3.33 (95% CI 2.16–5.13) for central obesity and an OR 3.39 (95% CI 2.34–4.90) for increased visceral fat. As regards lipid and carbohydrate metabolism, BAI was able to predict the risk OR 7.95 (95% CI 4.88–12.94), OR 1.60 (95% CI 1.03–2.41), OR 1.69 (95% CI 1.06–2.70) and OR 9.27 (95% CI 2.01–21.80), shows a significant association between cholesterol, triglycerides, LDL cholesterol and glucose respectively, P<0.001.
ConclusionA high prevalence of obesity by BAI was observed, and statistically positive associations with cardiovascular risk factors were shown.
Determinar la utilidad del índice de adiposidad corporal (IAC) como indicador de obesidad y predictor de riesgo de cardiovascular (RCV).
Materiales y métodosEstudio transversal sobre 527 voluntarios del sector educativo y automotriz de Bogotá, Colombia. Se estimó el IAC con la ecuación de Bergman et al. ([perímetro de cadera, en cm]/[altura, en m2]1,5−18). Se obtuvieron marcadores antropométricos, clínicos y bioquímicos. Se calcularon los cocientes aterogénicos: colesterol/c-HDL, c-LDL/c-HDL, triglicéridos/c-HDL e índice lipídico-metabólico (ILM). Se estimaron prevalencias y medias según terciles (T) del IAC y un análisis multivariado entre el IAC y los marcadores antropométricos, clínicos y bioquímicos asociados a RCV.
ResultadosLa prevalencia de obesidad por adiposidad (IAC>27,5%) fue del 33,9% (T-3). Los sujetos con menor valor de adiposidad (T-1) presentaron menores niveles de colesterol, triglicéridos/c-HDL, colesterol/c-HDL y mejor ILM; p<0,001. El modelo multivariado identificó que los individuos del T-3 muestran OR 3,33 (IC 95%: 2,16–5,13) de obesidad central y OR 3,39 (IC 95%: 2,34–4,90) aumento en la grasa visceral. Respecto al metabolismo de lípidos e hidratos de carbono, el IAC fue capaz de predecir el riesgo en 7,95 (IC 95%: 4,88–12,94), 1,60 (IC 95%: 1,03–2,41), 1,69 (IC 95%: 1,06–2,70) y 9,27 (IC 95%: 2,01–21,80), alteraciones en los niveles plasmáticos de colesterol, triglicéridos, c-LDL y glucemia, respectivamente, p<0,001.
ConclusiónEl presente trabajo muestra que los participantes con mayor valor de IAC presentan mayores cocientes aterogénicos, con marcadores antropométricos y clínicos más altos, y asociaciones positivas con factores de riesgo asociados al RCV.
Obesity is defined as abnormal or excess body fat accumulation, and has been recognized as a significant public health problem worldwide.1 It is important because of its increasing prevalence and its relationship to cardiovascular diseases (CVDs),2 type 2 diabetes mellitus3 (T2DM), and metabolic syndrome (MS),4 amongst others.5
There is international agreement that the development of overweight and obesity should be assessed by measuring adipose tissue as a marker of excess body fat.4,5 Clinically, the body mass index (BMI),6 calculated as weight (kg)/height (m2), adequately correlates to total body fat and is a good indicator of morbidity and mortality, although it is known that other markers are required to estimate body fat.7 Waist circumference (WC) is an additional marker of central adiposity8 which is easily measured and also shows a better relationship than the BMI to intra-abdominal fat measured by computed tomography (CT).9 WC shows a good association with cardiovascular risk (CVR) factors, the relative risk of developing ischemic heart disease, hyperinsulinism, T2DM, MS, and cardiovascular mortality independently from the BMI.8,9 However, these markers have some limitations that may lead, for instance, to individuals with high muscle mass being incorrectly categorized as overweight or obese.
In this context, Bergman et al.10 have suggested the use of a new index, the so-called body adiposity index (BAI), based on measurements of hip circumference and height. This index has been validated and used in obese populations11 and subjects with no CVR in countries such as the United States,12,13 Brazil,14 and Spain,15,16 and recently in athletes with high sports training levels.17
The aim of this study was to assess the value of the BAI in adults from Bogotá, Colombia, and the relationship of adiposity to anthropometric, clinical, and biochemical characteristics related to the early risk of CVD.
Subjects and methodsDesign and populationDuring the first half of 2014, a descriptive, cross-sectional study was conducted in 527 men from companies in the educational and automobile industries in Bogotá, Colombia. The sample consisted of male volunteers. Participants with a medical or clinical diagnosis of major systemic disease including T2DM, high blood pressure, hypo/hyperthyroidism, a history of drug or alcohol abuse, BMI≥25kg/m2, and inflammatory or infectious conditions were excluded from the study.
Written informed consent was obtained from each participant, and the ethics committee of the academic center approved the intervention in compliance with the ethical standards set out in the Declaration of Helsinki and the applicable legal regulations in Colombia governing research in humans (Decision 008430 of the Colombian Ministry of Health, approval minutes no. 01-1802-2013). The participants, all of whom signed an informed consent, were appointed to the following procedures:
Anthropometric measurements and clinical signsThe participants gave information regarding their clinical history, including any personal and family history of early cardiovascular disease. Anthropometric data, including height, weight, WC, and hip circumference (HC), were taken using the standardized procedures of López et al.18 for the Colombian population. Height was measured using a portable stadiometer (SECA 206®, Hamburg, Germany) (range 0–220cm) with a precision of 1mm. Weight was measured using a Tanita weighing scale (model TBF-410GS™, Arlington Heights, IL 60005, USA) with maximum and minimum capacities of 200kg and 100g respectively. These variables were used to calculate the BMI as 25kg/m2; the cut-off limits recommended by the World Health Organization (WHO) 1998 were used.19 WC and HC were subsequently measured with a precision of 1mm using a plastic measuring tape (Holtain Ltd., Crymych Dyfed, UK) taking the anatomical landmarks reported by Frisancho.20 Waist-height ratio (WHR) was then estimated by dividing WC (cm) into height (cm). Visceral fat volume (VFV) was estimated using the predictive equation proposed by Petribú et al.21 which uses WHR and fasting blood glucose (FBG) as independent variables, as follows: VFV=([−130.941+198.673×WHR])+[1.185×FBG in mg/dL]). The BAI was estimated using the equation proposed by Bergman et al.10 BAI=([HC in cm]/[height in m2]1.5−18). Blood pressure was measured after a 5-min rest using a digital oscillometer OMRON M10-IT (OMRON® Healthcare Co. Ltd., Japan). Mean arterial pressure (MAP) was calculated using the formula: (2×systolic blood pressure [SBP]+diastolic blood pressure [DBP])/3.
Biochemical measurementsA blood sample was taken to measure FBG, triglycerides (TG), high density lipoprotein cholesterol (HDL-C), and total cholesterol using enzymatic methods. Low density lipoprotein cholesterol (LDL-C) was calculated using the Friedewald formula22 when triglyceride levels were >400mg/dL. Blood samples were taken between 08:00 and 09:00 after fasting for 8–12h (mean, 11.2h). The Castelli index (TC/HDL-C),23 the proatherogenic index (LDL-C/HDL-C), and the triglycerides/HDL-C ratio as its clinical expression were calculated.24 TG, LDL-C, HDL-C, and FBG values were used to establish a lipid-metabolic index of cardiovascular risk as suggested in the García-Artero et al. study.25
Each of these blood variables was typified as Z=([value−mean]/standard deviation). The typified HDL-C variable was multiplied by (−1) because its relationship to cardiovascular risk is the opposite to that of all the other variables. The lipid-metabolic index of cardiovascular risk was calculated as the sum of the four typified variables, so that values lower than this parameter represented an index healthier for the heart. By definition, the mean was zero.
Cardiovascular risk markersThe CVR criteria described by the National Cholesterol Education Program (NCEP),26 the International Diabetes Federation (IDF),27 and the United States Department of Health were used28: abdominal obesity (WC≥88cm), BMI≥25kg/m2, WHR≥0.53, VFV≥100, SBP≥130mmHg, TC≥200mg/dL, TG≥150mg/dL, HDL-C≤45mg/dL, LDL-C≥100mg/dL, FBG≥110mg/dL) and TC/HDL-C≥5.
The abovementioned measurements were taken using certified devices and according to the standards of the international biological program prepared by the International Council of Scientific Unions, including the essential procedures for the biological study of human populations.29 Using the equation n=(Z1−α/2+Z1−β)2p0 (1−p0)/δ2; n=10.5 (0.20)/0.01, a sample size of 210 participants was calculated to achieve a mean 30% prevalence of overweight based on BMI.
Analytical planInformation was processed and analyzed using the Statistical Package for the Social Sciences, version 22 (SPSS; Chicago, IL, USA). Continuous values were expressed as mean and standard deviation. The BAI was recoded to tertiles to test its relation to anthropometric, clinical, and biochemical markers. Variance homogeneity tests (ANOVA) were used to observe differences in continuous variables. The relationship between BAI tertiles and CVR markers was assessed using a partial correlation analysis with Pearson's coefficient (r), and age-adjusted odds ratios (OR) and 95% confidence intervals (95% CI) were calculated using forward selection and step by step methods. The variable incorporation procedure was terminated when the significance provided by a variable upon addition to the regression exceeded 0.05 between BAI and CVR markers. A value of p<0.05 was considered statistically significant.
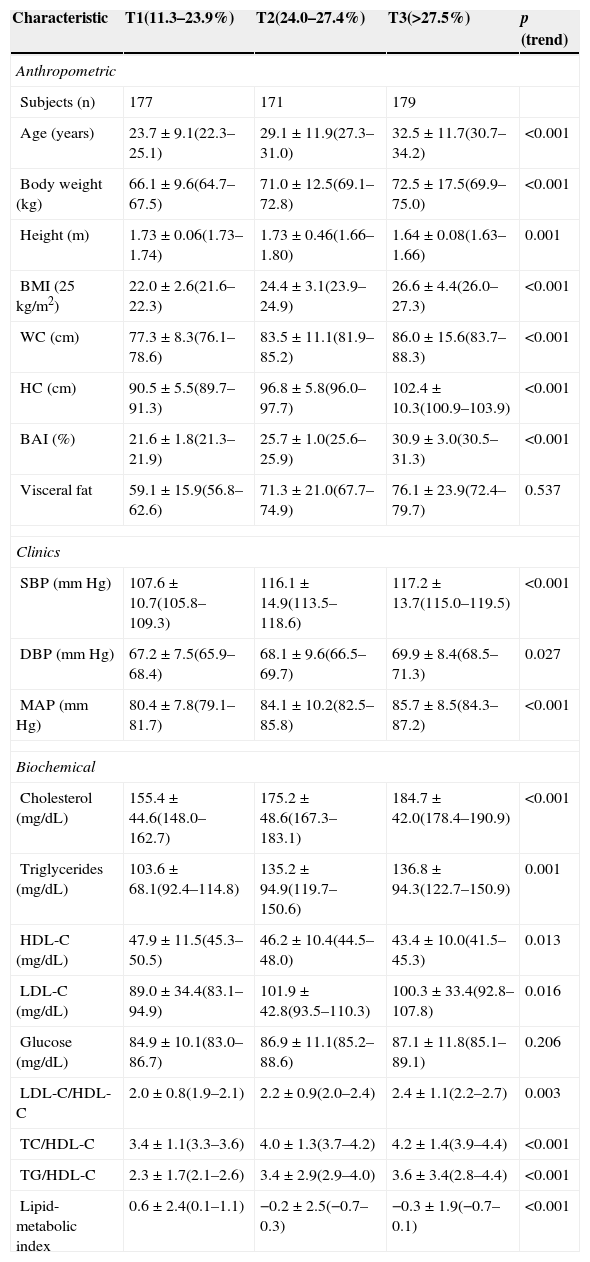
ResultsThe final sample consisted of 527 men with a mean age of 35.4±9.5 years (range, 19–60 years). The main variables are reported in Table 1. Subjects were divided into three groups by adiposity tertile (T) based on the Bergman equation. T 1 included subjects with a BAI ranging from 11.3 to 23.9%, T 2 those with values ranging from 24.0 to 27.4%, and T 3 those with a BAI>27.5%.
Characteristics of participants by adiposity tertiles (n=527).
| Characteristic | T1(11.3–23.9%) | T2(24.0–27.4%) | T3(>27.5%) | p (trend) |
|---|---|---|---|---|
| Anthropometric | ||||
| Subjects (n) | 177 | 171 | 179 | |
| Age (years) | 23.7±9.1(22.3–25.1) | 29.1±11.9(27.3–31.0) | 32.5±11.7(30.7–34.2) | <0.001 |
| Body weight (kg) | 66.1±9.6(64.7–67.5) | 71.0±12.5(69.1–72.8) | 72.5±17.5(69.9–75.0) | <0.001 |
| Height (m) | 1.73±0.06(1.73–1.74) | 1.73±0.46(1.66–1.80) | 1.64±0.08(1.63–1.66) | 0.001 |
| BMI (25kg/m2) | 22.0±2.6(21.6–22.3) | 24.4±3.1(23.9–24.9) | 26.6±4.4(26.0–27.3) | <0.001 |
| WC (cm) | 77.3±8.3(76.1–78.6) | 83.5±11.1(81.9–85.2) | 86.0±15.6(83.7–88.3) | <0.001 |
| HC (cm) | 90.5±5.5(89.7–91.3) | 96.8±5.8(96.0–97.7) | 102.4±10.3(100.9–103.9) | <0.001 |
| BAI (%) | 21.6±1.8(21.3–21.9) | 25.7±1.0(25.6–25.9) | 30.9±3.0(30.5–31.3) | <0.001 |
| Visceral fat | 59.1±15.9(56.8–62.6) | 71.3±21.0(67.7–74.9) | 76.1±23.9(72.4–79.7) | 0.537 |
| Clinics | ||||
| SBP (mm Hg) | 107.6±10.7(105.8–109.3) | 116.1±14.9(113.5–118.6) | 117.2±13.7(115.0–119.5) | <0.001 |
| DBP (mm Hg) | 67.2±7.5(65.9–68.4) | 68.1±9.6(66.5–69.7) | 69.9±8.4(68.5–71.3) | 0.027 |
| MAP (mm Hg) | 80.4±7.8(79.1–81.7) | 84.1±10.2(82.5–85.8) | 85.7±8.5(84.3–87.2) | <0.001 |
| Biochemical | ||||
| Cholesterol (mg/dL) | 155.4±44.6(148.0–162.7) | 175.2±48.6(167.3–183.1) | 184.7±42.0(178.4–190.9) | <0.001 |
| Triglycerides (mg/dL) | 103.6±68.1(92.4–114.8) | 135.2±94.9(119.7–150.6) | 136.8±94.3(122.7–150.9) | 0.001 |
| HDL-C (mg/dL) | 47.9±11.5(45.3–50.5) | 46.2±10.4(44.5–48.0) | 43.4±10.0(41.5–45.3) | 0.013 |
| LDL-C (mg/dL) | 89.0±34.4(83.1–94.9) | 101.9±42.8(93.5–110.3) | 100.3±33.4(92.8–107.8) | 0.016 |
| Glucose (mg/dL) | 84.9±10.1(83.0–86.7) | 86.9±11.1(85.2–88.6) | 87.1±11.8(85.1–89.1) | 0.206 |
| LDL-C/HDL-C | 2.0±0.8(1.9–2.1) | 2.2±0.9(2.0–2.4) | 2.4±1.1(2.2–2.7) | 0.003 |
| TC/HDL-C | 3.4±1.1(3.3–3.6) | 4.0±1.3(3.7–4.2) | 4.2±1.4(3.9–4.4) | <0.001 |
| TG/HDL-C | 2.3±1.7(2.1–2.6) | 3.4±2.9(2.9–4.0) | 3.6±3.4(2.8–4.4) | <0.001 |
| Lipid-metabolic index | 0.6±2.4(0.1–1.1) | −0.2±2.5(−0.7–0.3) | −0.3±1.9(−0.7–0.1) | <0.001 |
WC, waist circumference; BAI, body adiposity index; MAP, mean arterial pressure; HC, hip circumference; SBP, systolic blood pressure; DBP, diastolic blood pressure; TG, triglycerides; xSBP, systolic blood pressure.
Values are mean±SD (95% CI).
The group with higher adiposity values (T 3) showed greater values of age, body weight, BMI, WC, HC, and VFV (p<0.001, linear). Subjects with less adiposity (T 1) had lower total cholesterol, TG/C, and TC/HDL-C values and a better lipid-metabolic index (p<0.001, linear).
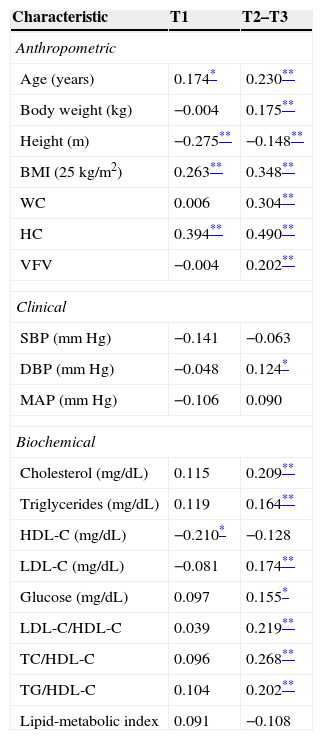
Table 2 shows the partial correlations between adiposity tertiles and anthropometric, clinical, and biochemical variables in Colombian adults. After adjusting for age, weight, BMI, and VFV, subjects in the tertile with higher adiposity (T2–T3) showed a positive relationship to the anthropometric variables such as body weight (r=0.175; p<0.01); WC (r=0.304; p<0.01), BMI (r=0.348; p<0.01), VFV (r=0.202; p<0.01); the biochemical variables such as cholesterol (r=0.209; p<0.01), TG (r=0.164; p<0.01), LDL-C (r=0.174; p<0.01), FBG (r=0.155; p<0.05); and the atherogenic indices LDL-C/HDL-C (r=0.219; p<0.01), TC/HDL-C (r=0.268; p<0.01), and TG/HDL-C (r=0.202; p<0.01). A better HDL-C was inversely related in the group with the lowest adiposity values (r=−0.210; p<0.05).
Partial correlations between body adiposity index (tertiles) and anthropometric, clinical, and biochemical characteristics.
| Characteristic | T1 | T2–T3 |
|---|---|---|
| Anthropometric | ||
| Age (years) | 0.174* | 0.230** |
| Body weight (kg) | −0.004 | 0.175** |
| Height (m) | −0.275** | −0.148** |
| BMI (25kg/m2) | 0.263** | 0.348** |
| WC | 0.006 | 0.304** |
| HC | 0.394** | 0.490** |
| VFV | −0.004 | 0.202** |
| Clinical | ||
| SBP (mm Hg) | −0.141 | −0.063 |
| DBP (mm Hg) | −0.048 | 0.124* |
| MAP (mm Hg) | −0.106 | 0.090 |
| Biochemical | ||
| Cholesterol (mg/dL) | 0.115 | 0.209** |
| Triglycerides (mg/dL) | 0.119 | 0.164** |
| HDL-C (mg/dL) | −0.210* | −0.128 |
| LDL-C (mg/dL) | −0.081 | 0.174** |
| Glucose (mg/dL) | 0.097 | 0.155* |
| LDL-C/HDL-C | 0.039 | 0.219** |
| TC/HDL-C | 0.096 | 0.268** |
| TG/HDL-C | 0.104 | 0.202** |
| Lipid-metabolic index | 0.091 | −0.108 |
Finally, participants who had BAI values higher than 27.5% had a 3.33-fold greater (95% CI: 2.16–5.13) chance of having central obesity, a 5.95-fold greater (95% CI: 3.90–9.08) chance of obesity and overweight by the BMI, an 8.71-fold greater chance (95% CI: 5.41–14.01) of greater WHR, and a 3.39-fold greater chance (95% CI: 2.34–4.90) of VFV≥100, 7.95-fold (95% CI: 4.88–12.94). As regards lipid and carbohydrate metabolism, the BAI was able to predict the risk as 7.95 (95% CI: 4.88–12.94), 1.60 (95% CI: 1.03–2.41), 1.69 (95% CI: 1.06–2.70), and 9.27 (95% CI: 2.01–21.80) for changes in plasma levels of TC, TG, LDL-C, and FBG respectively, p<0.001 (Fig. 1).
Discussion of having BAI values ≥27.5% with early CVR markers in the general population (n=527).")
The main finding of this study was that participants with a BAI≥27.5% have greater CVR. To our knowledge, this is the first study exploring the value of the BAI for predicting CVR in subjects with no known CVD. Epidemiological studies have reported that the BMI has a low capacity to predict CVR in some ethnic groups because of its low sensitivity for discriminating excess adipose tissue from lean mass.30,31 In addition, BMI measurement does not include a component such as visceral fat, which has been shown to have a close relation to the prediction of CVR in the general population.26 When overall adiposity was verified using as cut-off point the tertile 3 value (≥27.5%), obesity was found in almost one third of the population (33.9%). Epidemiological studies have found an increased prevalence of abdominal obesity in the past decade, with rates of 42% and 50% in men from North America32 and South America33 respectively. This study supported those findings by showing a 37.8% prevalence rate of overweight and obesity (BMI≥25kg/m2), and abdominal obesity by WC in 13.7% of subjects.
BMI, WHR, and WC values were higher in the group with the greatest BAIs. This was also reported by Pou et al.34 who noted that the increased prevalence of visceral adipose tissue and adiposity was related to increases in BMI category and abdominal obesity by WC. In this regard, scientific bodies such as the American Heart Association recommend that the estimation of obesity with anthropometric indicators include central adiposity measures such as WC or body fat to stratify CVR in the general population.35
In our study, after adjusting for age, subjects in the tertile with the highest adiposity value (T2–T3) showed a positive relationship to the anthropometric variables such as body weight, the BMI, and VFV (p<0.01). These findings agree with those reported by López et al.16 in a Spanish population where a significant correlation of the BAI with WC (r=0.65, p<0.001) and body weight (r=0.58, p<0.001) was found and with the findings of the Bennasar-Veny et al. study15 in 1.474 males (mean age 39.2±10.8 years), where a correlation was found with the BMI (r=0.64, p<0.001) and percent fat by bioimpedance (r=0.74, p<0.001).
In a population with CVD, Dhaliwal et al.36 also reported a correlation of the BAI with the BMI, WC, and HC (p<0.001). However, after age adjustment WC and waist-hip ratio were significantly associated as CVR predictors, with OR 3.84 (95% CI: 1.59–9.25) and OR 5.42 (95% CI: 2.12–13.89) respectively.
As regards CVR estimation, changes in lipoprotein metabolism are the main factor and represent approximately 50% of the population attributable risk for the development of cardiovascular disease, especially with atherosclerosis.37 In this study, subjects in the higher adiposity tertiles according to the BAI (T2–T3) showed a positive relation to the lipoprotein metabolism markers TC, TG, LDL-C and to the atherogenic indices LDL-C/HDL-C, TC/HDL-C, and TG/HDL-C. In this regard, the Lichtash et al.13 showed a significant correlation between the BAI and changes in lipid metabolism, suggesting that the measurement of adiposity could represent an additional measure for predicting CVR. In addition, a significant number of subjects had elevated TG/HDL-C, TC/HDL-C, or LDL-C/HDL-C ratios, associated with greater CVR, due to an imbalance between cholesterol transported by atherogenic lipoproteins and protective lipoproteins.38 This imbalance may be due to an increase in atherogenic variables included in the numerator and/or to a decrease in the anti-atherogenic variable in the denominator.
As regards blood pressure, higher SBP, DBP, and MAP values were found in the group with a BAI (≥27.5%). When the BAI was compared as a predictor of arterial hypertension, an association was only found with SBP (OR: 3.96; 95% CI: 1.40–11.20; p<0.001). This observation has been verified in other studies, because it has been established that increased adiposity is associated with endothelial dysfunction even in the absence of blood pressure changes.37,38 A potential explanation for the increased systolic pressure found in subjects with higher BAI values is that they have an imbalance in their levels of visceral adipokines and cytokines, which contributes to insulin resistance states, with the resultant decrease in the bioavailability of substances with vasomotor effects such as nitric oxide.36–38
Some study limitations should be considered. For example, sample size, population characteristics, study design, and type of sampling could be considered as potential sources of bias. On the other hand, other variables that may be associated with a cardiometabolic risk profile, such as ethnicity, socioeconomic status, nutritional and social aspects, and physical activity levels, were not included. There are however no reasons to think that the reported relations only occur in the population from which our sample was taken, as the results were seen to agree with data reported in other national and international studies.10–16,36–39 This information will allow us in the coming years to assess the clinical relevance of the association found in cross-sectional epidemiological studies, and the value of the BAI as a predictor of changes in biomarkers related to CVD onset and progression.
The results suggest that, in the adults evaluated, higher BAI values are related to less healthy clinical and lipid-metabolic profiles. The authors believe that the evaluation of the BAI parameter by predictive equations should be added to the conventional determination of traditional risk factors in the prevention and treatment of risk factors associated with CVD. Observational studies with larger samples, and especially longitudinal and prospective studies, are required to verify the results found in this study.
Conflicts of interestThe authors state that they have no conflicts of interest.
To ADISPETROL S.A. for funding support for laboratory tests in the automobile company, and to the Vice-chancellorship of Research Announcement FODEIN-USTA 2014 no. 2013004 project “Association of grip strength to early manifestations of cardiovascular risk in young Colombian adults”.
Please cite this article as: García AI, Niño-Silva LA, González-Ruíz K, Ramírez-Vélez R. Utilidad del índice de adiposidad corporal como indicador de obesidad y predictor de riesgo cardiovascular en adultos de Bogotá, Colombia. Endocrinol Nutr. 2015;62:130–137.
