


Insulin resistance (IR) has been directly related to obesity, particularly central obesity, and to other cardiovascular risk factors (CVRFs). Direct IR quantification is difficult in clinical practice, and indirect methods such as HOMA (homeostasis model assessment) have therefore been developed. The aim of this study was to assess the association of IR, as measured by HOMA, with different anthropometric measures and some CVRFs.
Materials and methodsA cross-sectional, observational study was carried out in a general population sample older than 18 years in the province of Albacete, Spain. Sample size was 678 subjects. Participants completed a survey and underwent physical examinations and laboratory tests. Obesity measures included body mass index, waist perimeter, and sagittal abdominal diameter. Data analysis was performed using SPSS 15.0 software.
ResultsMean values of obesity measures were higher in males as compared to females and increased with age. IR prevalence was 39.8%. All assessed anthropometric measures, decreased HDL (high density lipoprotein) cholesterol and increased non-HDL cholesterol were independently associated to the risk of IR.
ConclusionsA clear association exists between different anthropometrical measures and IR in the general population. There is also an association between lipid profile changes and the risk of experiencing IR.
La resistencia a la insulina (RI) se ha relacionado directamente con la obesidad, especialmente la obesidad central, y con otros factores de riesgo cardiovascular (FRCV). La cuantificación de la RI de forma directa es difícil en la práctica clínica, por lo que se han desarrollado métodos indirectos como el índice homeostasis model assessment (HOMA). El objetivo de este estudio fue valorar la asociación existente entre la RI, medida por índice HOMA, con diferentes medidas antropométricas y algunos FRCV.
Material y métodosSe trata de un estudio observacional transversal realizado en una muestra de población general mayor de 18 años de la provincia de Albacete. El tamaño muestral fue de 678 sujetos. Se realizaron encuesta, exploración física y analítica a los participantes. Las medidas de obesidad valoradas fueron índice de masa corporal, perímetro de cintura y diámetro sagital abdominal. El análisis de datos se realizó con el programa SPSS 15.0.
ResultadosLos valores medios de las medidas de obesidad fueron mayores en varones que en mujeres y aumentan con la edad. La prevalencia de RI fue del 39,8%. Todas las medidas antropométricas evaluadas, el descenso del colesterol unido a lipoproteínas de alta densidad (HDL) y el aumento del colesterol no unido a HDL se asocian de manera independiente con el riesgo de presentar RI.
ConclusionesExiste una clara relación entre diferentes medidas antropométricas y la RI en población general. También hay relación entre las alteraciones del perfil lipídico y el riesgo de presentar RI.
Cardiovascular diseases (CVDs) are a significant health problem in Western societies because they represent one of the main causes of morbidity and mortality. In Spain, CVDs are the leading cause of mortality, accounting for 32.5% of all deaths according to data from the Spanish National Statistics Institute (INE).1 The different cardiovascular risk factors (CVRFs) related to such diseases tend to be associated, so that a same individual usually has several factors, as occurs in metabolic syndrome (MS).2
Insulin resistance (IR) has been suggested as an underlying mechanism directly related to the pathophysiology of MS.3 Direct quantification of IR is difficult; the hyperinsulinemic–euglycemic clamp technique, based on direct intravenous insulin and glucose infusion, is considered the gold standard procedure, but its complexity hinders its clinical use. Indirect methods have therefore been developed, of which one of the most commonly used is the homeostasis model assessment (HOMA) index, which uses a mathematical model to estimate IR from baseline insulin and blood glucose levels. This index shows a good correlation to the clamp procedure.4
On the other hand, a direct relationship of IR to obesity and, more directly, to increased abdominal visceral fat has been observed; abdominal visceral fat is in turn related to various independent CVRFs such as high blood pressure and lipid profile.5–9 Multiple methods have been used to assess obesity and, more specifically, body fat distribution.10 Simple methods that help measure the amount of visceral fat as reliably as possible in order to be able to identify individuals at greatest risk are needed in clinical practice. Anthropometrics is a cheap and accessible method in clinical practice. Body mass index (BMI), used for a long time as a reference for obesity diagnosis and classification, does not allow for the quantification of visceral fat.10 The waist–hip index (WHI), for years the reference for visceral fat assessment, has been used as a complement to BMI although waist circumference (WC) was subsequently shown to be better correlated to the metabolic changes related to obesity.6,10
Studies conducted in recent years have proposed a new way of measuring obesity, the sagittal abdominal diameter (SAD). An increased SAD is directly related to intra-abdominal fat11 and strongly correlates to several CVRFs such as insulin, lipid, and uric acid, as well as blood pressure levels and MS,12,14 and even to an increased risk of sudden death.15
This study was intended to assess the relationship of IR, as measured by the HOMA index, and SAD in a non-diabetic population sample and to compare it to that shown by other anthropometric measures, and to assess the influence of CVRFs which are part of MS on this relationship.
Subjects, materials, and methodsThis was an observational, cross-sectional study conducted on subjects from the second cross-section of a longitudinal, prospective study of a general population cohort aged over 18 years of age from the province of Albacete. The first investigation was made between 1992 and 1994, and the second between 2004 and 2006.
SAD and insulin levels were only measured in the second cross-section. The sample population in this cross-section consisted of the 1322 subjects participating in the first study (selected by randomized, stratified, and two-stage sampling, with stages proportional to the size of the population they contained), to whom 255 subjects from the 18–28 year-old stratum selected in the same way were added. Diagnosed diabetic subjects were excluded from this sample because of the potential impact of drug treatment on insulin levels. Insulin levels were only measured in a subsample of 678 subjects, due to financial restrictions.
Data collection was performed by three interviewers trained at the healthcare centers to which the subjects selected were affiliated. All participants were notified by post-twice, and those who did not attend the center were reminded by telephone. Before the interview, the subjects signed an informed consent to participate in the study.
Demographic data and family and personal history of CVD and CVRFs were collected. Weight, height, BW, SAD, and blood pressure were measured. An electrocardiogram was performed, and a fasting blood sample was taken. International or national standards were used to measure variables.
Weight was measured in kilograms (kg) using the scales available at the different clinics with a range from 0.1 and 150kg and an accuracy of 100g. Patients were weighed in underwear and with no shoes. They were placed in the scale in a standard, upright position with their back to the measurement recorded and avoiding contact of their bodies with any surrounding object. Height was measured in centimeters (cm) with a stadiometer having a triangular plane that was rested on the head. Measurements from 1 and 200cm could be obtained with an accuracy of 1 millimeter (mm). Participants were standing, with no shoes on, with their heads aligned following the tragocommissural line and with their heels, buttocks, upper back, and occipital region in contact with the vertical plane of the stadiometer. Both measures were used to calculate BMI, defined as weight in kg divided by height in square meters (kg/m2). WC was measured with a flexible, non-extensible measuring tape and with a free end with a range of 2 meters and an accuracy of 0.1cm at the midline between the lower costal margin and the iliac crest at the level of the anterosuperior iliac spine in two positions: standing and supine. Both measures were taken by two of the interviewers, and the mean of the two measures was used for data analysis. SAD was measured with subjects in a supine position, with knees extended, at the same level as WC at the end of an expiration. A device manufactured by us, consisting of two wooden planes, a fixed plane on which subjects rested and a sliding plane that rested on the anterior abdomen, and a measuring scale in centimeters ranging from 1 and 52cm and with a precision of 0.1cm was used.
Blood and urine laboratory tests were performed on all participants on the morning following the interview. Blood was drawn under standardized conditions after fasting for 10–14h, with subjects sitting and a maximum phlebostasis of 2min. Samples were taken using a vacuum system (Vacutainer, BD). All measurements were performed at the clinical laboratory of Complejo Hospitalario Universitario de Albacete on the same day of sampling, except for insulin levels, for which samples were sent to the reference laboratory (Balague Center, Barcelona), where they were received the day after sampling. The HOMA index was calculated using the formula: blood insulin (μU/mL)×blood glucose (mmol/L)/22.5.
The cut-off point defining IR in our study was 1.24, and was determined in a subsample which was established based on criteria previously used by Ascaso et al.16: age ranging from 30 and 60 years, no family history of dyslipidemia, diabetes, or hypertension, no personal history of diabetes, basal blood glucose less than 110mg/dL, no high blood pressure, plasma triglyceride levels less than 150mg/dL, no CVD, no obesity. The 90th percentile for the HOMA index was calculated from the 27 subjects who met these conditions, and a value of 1.24 was obtained. Obesity and overweight were defined based on international standards: obesity as a BMI greater than 30, and overweight as a BMI ranging from 25 and 30.
SPSS 15.0 software was used for data analysis. Quantitative variables are given as exact amounts and percentages, and quantitative variables as mean and standard deviation (SD). A Chi-square test or a Fisher's exact test was used for associations between qualitative variables. Means comparisons were performed using a Student's t test for independent groups, or a Mann–Whitney U test if normality assumptions (based on a Kolmogorov–Smirnov or a Shapiro–Wilk test) were not met.
The linear association between the HOMA index and the different anthropometric measures was established using the Pearson linear correlation index. To assess which anthropometric measure best correlated to IR, classificatory capacity was calculated by measuring the area under the Receiver Operating Characteristic (ROC) curve. To assess which variables were independently associated with IR (the dependent variable), four logistic regression models were prepared, one for each of the anthropometric measures assessed (BMI, standing WC, supine WC, and SAD), because these are strongly correlated and could have resulted in an unstable model. Variables considered in the adjustment included age, sex, high blood pressure (HBP), high density lipoprotein (HDL) cholesterol, non-HDL cholesterol, and triglycerides. A value of p≤0.05 was considered statistically significant.
ResultsSix hundred and seventy-eight subjects over 18 years of age, 287 males and 391 females, were assessed. The prevalence rates of obesity and overweight in our sample were 29.9% and 40.3% respectively.
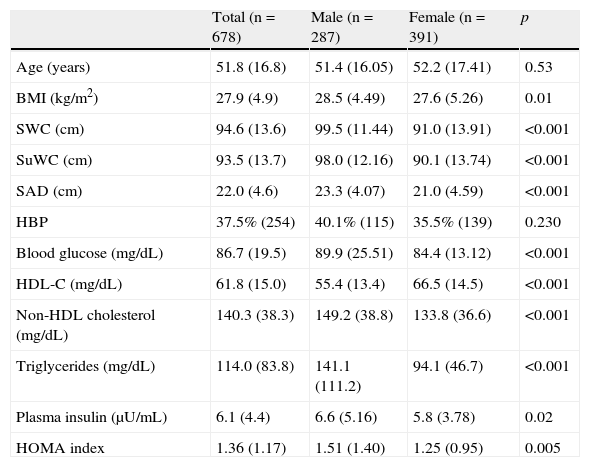
Table 1 shows the general characteristics of the study sample. All mean values of obesity measures were significantly higher in males as compared to females.
General characteristics of study population stratified by sex.
| Total (n=678) | Male (n=287) | Female (n=391) | p | |
| Age (years) | 51.8 (16.8) | 51.4 (16.05) | 52.2 (17.41) | 0.53 |
| BMI (kg/m2) | 27.9 (4.9) | 28.5 (4.49) | 27.6 (5.26) | 0.01 |
| SWC (cm) | 94.6 (13.6) | 99.5 (11.44) | 91.0 (13.91) | <0.001 |
| SuWC (cm) | 93.5 (13.7) | 98.0 (12.16) | 90.1 (13.74) | <0.001 |
| SAD (cm) | 22.0 (4.6) | 23.3 (4.07) | 21.0 (4.59) | <0.001 |
| HBP | 37.5% (254) | 40.1% (115) | 35.5% (139) | 0.230 |
| Blood glucose (mg/dL) | 86.7 (19.5) | 89.9 (25.51) | 84.4 (13.12) | <0.001 |
| HDL-C (mg/dL) | 61.8 (15.0) | 55.4 (13.4) | 66.5 (14.5) | <0.001 |
| Non-HDL cholesterol (mg/dL) | 140.3 (38.3) | 149.2 (38.8) | 133.8 (36.6) | <0.001 |
| Triglycerides (mg/dL) | 114.0 (83.8) | 141.1 (111.2) | 94.1 (46.7) | <0.001 |
| Plasma insulin (μU/mL) | 6.1 (4.4) | 6.6 (5.16) | 5.8 (3.78) | 0.02 |
| HOMA index | 1.36 (1.17) | 1.51 (1.40) | 1.25 (0.95) | 0.005 |
Values are given as mean (standard deviation) for quantitative variables and as percentage (number of cases) for qualitative variables. HDL-C: high density lipoprotein (HDL) cholesterol; SAD: sagittal abdominal diameter; HOMA: homeostasis model assessment; HBP: high blood pressure; BMI: body mass index; SWC: standing waist circumference; SuWC: supine waist circumference.
A Student's t test was used to compare means, and a Chi-square test to compare qualitative variables.
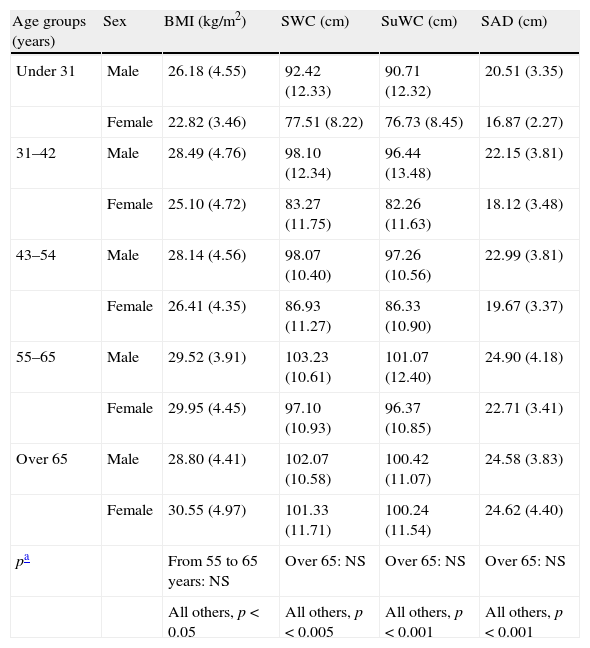
Table 2 shows differences between the mean anthropometric measures by age and sex groups. As may be seen, all values increased at an earlier age in males.
Comparison of anthropometric parameters by age and sex groups.
| Age groups (years) | Sex | BMI (kg/m2) | SWC (cm) | SuWC (cm) | SAD (cm) |
| Under 31 | Male | 26.18 (4.55) | 92.42 (12.33) | 90.71 (12.32) | 20.51 (3.35) |
| Female | 22.82 (3.46) | 77.51 (8.22) | 76.73 (8.45) | 16.87 (2.27) | |
| 31–42 | Male | 28.49 (4.76) | 98.10 (12.34) | 96.44 (13.48) | 22.15 (3.81) |
| Female | 25.10 (4.72) | 83.27 (11.75) | 82.26 (11.63) | 18.12 (3.48) | |
| 43–54 | Male | 28.14 (4.56) | 98.07 (10.40) | 97.26 (10.56) | 22.99 (3.81) |
| Female | 26.41 (4.35) | 86.93 (11.27) | 86.33 (10.90) | 19.67 (3.37) | |
| 55–65 | Male | 29.52 (3.91) | 103.23 (10.61) | 101.07 (12.40) | 24.90 (4.18) |
| Female | 29.95 (4.45) | 97.10 (10.93) | 96.37 (10.85) | 22.71 (3.41) | |
| Over 65 | Male | 28.80 (4.41) | 102.07 (10.58) | 100.42 (11.07) | 24.58 (3.83) |
| Female | 30.55 (4.97) | 101.33 (11.71) | 100.24 (11.54) | 24.62 (4.40) | |
| pa | From 55 to 65 years: NS | Over 65: NS | Over 65: NS | Over 65: NS | |
| All others, p<0.05 | All others, p<0.005 | All others, p<0.001 | All others, p<0.001 |
Values are given as mean (standard deviation). SAD: sagittal abdominal diameter; BMI: body mass index; NS: not significant; SWC: standing waist circumference; SuWC: supine waist circumference.
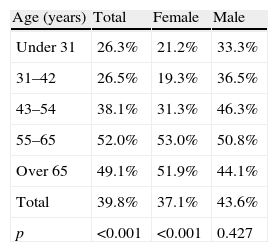
Based on the definition of IR as a HOMA index ≥1.24, prevalence rates were 39.8% in the overall group (n=270 subjects), 43.6% (n=125) in males and 37.1% (n=145) in females respectively. Prevalence increased with age, but decreased from 65 years of age, as shown in Table 3. However, no statistically significant difference was found in males.
IR prevalence by age and sex groups.
| Age (years) | Total | Female | Male |
| Under 31 | 26.3% | 21.2% | 33.3% |
| 31–42 | 26.5% | 19.3% | 36.5% |
| 43–54 | 38.1% | 31.3% | 46.3% |
| 55–65 | 52.0% | 53.0% | 50.8% |
| Over 65 | 49.1% | 51.9% | 44.1% |
| Total | 39.8% | 37.1% | 43.6% |
| p | <0.001 | <0.001 | 0.427 |
IR: insulin resistance.
A Chi-square test was used to compare percentages.
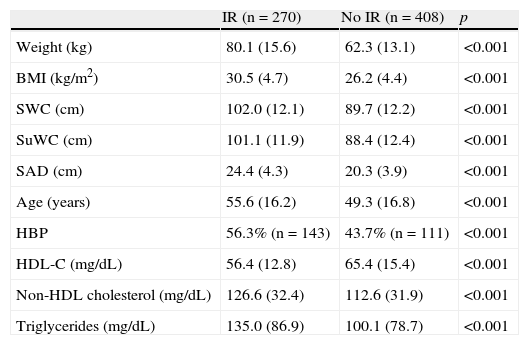
As shown in Table 4, higher mean anthropometric values were found in the IR group.
Comparison of mean values of the different variables tested between subjects with and without insulin resistance (IR).
| IR (n=270) | No IR (n=408) | p | |
| Weight (kg) | 80.1 (15.6) | 62.3 (13.1) | <0.001 |
| BMI (kg/m2) | 30.5 (4.7) | 26.2 (4.4) | <0.001 |
| SWC (cm) | 102.0 (12.1) | 89.7 (12.2) | <0.001 |
| SuWC (cm) | 101.1 (11.9) | 88.4 (12.4) | <0.001 |
| SAD (cm) | 24.4 (4.3) | 20.3 (3.9) | <0.001 |
| Age (years) | 55.6 (16.2) | 49.3 (16.8) | <0.001 |
| HBP | 56.3% (n=143) | 43.7% (n=111) | <0.001 |
| HDL-C (mg/dL) | 56.4 (12.8) | 65.4 (15.4) | <0.001 |
| Non-HDL cholesterol (mg/dL) | 126.6 (32.4) | 112.6 (31.9) | <0.001 |
| Triglycerides (mg/dL) | 135.0 (86.9) | 100.1 (78.7) | <0.001 |
BMI: body mass index; SWC: standing waist circumference; SuWC: supine waist circumference; SAD: sagittal abdominal diameter; HBP: high blood pressure; HDL-C: high density lipoprotein (HDL) cholesterol. A Student's t test for independent groups was used to compare means, and a Chi-square test was used to compare percentages.
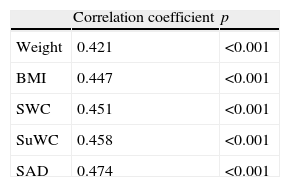
The correlation coefficient between the HOMA index and the different anthropometric measures showed an increasing trend, with the highest correlation found for SAD (Table 5).
Correlation coefficient between IR and anthropometric measures.
| Correlation coefficient | p | |
| Weight | 0.421 | <0.001 |
| BMI | 0.447 | <0.001 |
| SWC | 0.451 | <0.001 |
| SuWC | 0.458 | <0.001 |
| SAD | 0.474 | <0.001 |
IR: insulin resistance. BMI: body mass index; SWC: standing waist circumference; SuWC: supine waist circumference; SAD: sagittal abdominal diameter.
Fig. 1 shows the ROC curves together to facilitate understanding, with the IR cut-off at 1.24. BMI adequately classified 75.7% of subjects, standing WC 76.7%, supine WC 77.2%, and SAD 76.4% of subjects. Statistical significance was found in all cases (p<0.001). As shown, BMI was the variable that worst classified patients with IR. There was however little difference between the different anthropometric measures.

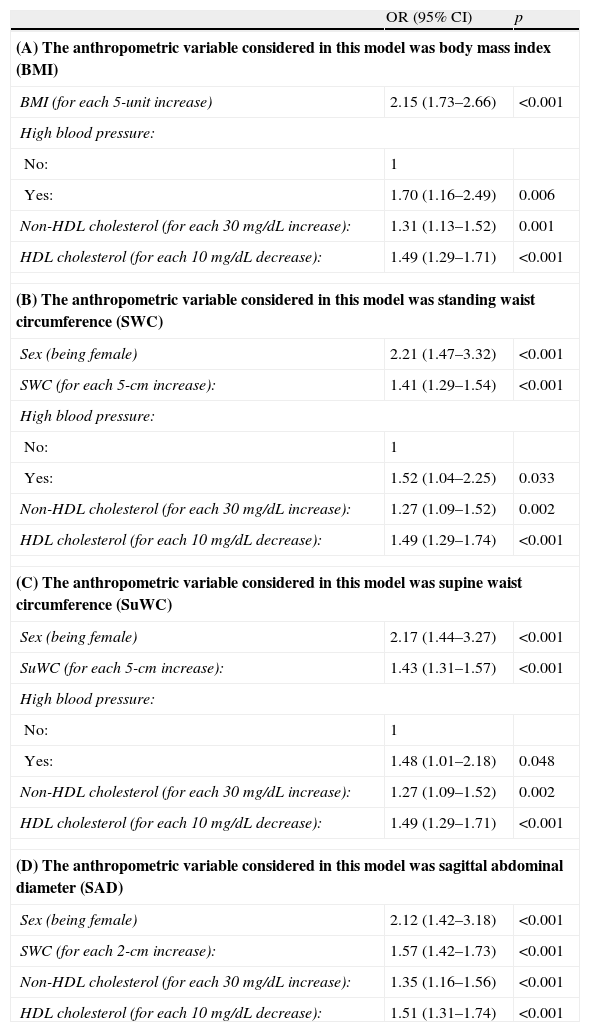
To assess the independent association between each anthropometric measure and IR, four logistic regression models were prepared, each with the corresponding anthropometric measure and all of them adjusted for the most relevant variables (age, sex, high blood pressure, HDL cholesterol (HDL-C), non-HDL cholesterol, and triglycerides). Table 6 shows these data, all of them showing an independent association between each anthropometric measure considered and IR.
Odds ratios for the risk factors associated with insulin resistance.
| OR (95% CI) | p | |
| (A) The anthropometric variable considered in this model was body mass index (BMI) | ||
| BMI (for each 5-unit increase) | 2.15 (1.73–2.66) | <0.001 |
| High blood pressure: | ||
| No: | 1 | |
| Yes: | 1.70 (1.16–2.49) | 0.006 |
| Non-HDL cholesterol (for each 30 mg/dL increase): | 1.31 (1.13–1.52) | 0.001 |
| HDL cholesterol (for each 10 mg/dL decrease): | 1.49 (1.29–1.71) | <0.001 |
| (B) The anthropometric variable considered in this model was standing waist circumference (SWC) | ||
| Sex (being female) | 2.21 (1.47–3.32) | <0.001 |
| SWC (for each 5-cm increase): | 1.41 (1.29–1.54) | <0.001 |
| High blood pressure: | ||
| No: | 1 | |
| Yes: | 1.52 (1.04–2.25) | 0.033 |
| Non-HDL cholesterol (for each 30 mg/dL increase): | 1.27 (1.09–1.52) | 0.002 |
| HDL cholesterol (for each 10 mg/dL decrease): | 1.49 (1.29–1.74) | <0.001 |
| (C) The anthropometric variable considered in this model was supine waist circumference (SuWC) | ||
| Sex (being female) | 2.17 (1.44–3.27) | <0.001 |
| SuWC (for each 5-cm increase): | 1.43 (1.31–1.57) | <0.001 |
| High blood pressure: | ||
| No: | 1 | |
| Yes: | 1.48 (1.01–2.18) | 0.048 |
| Non-HDL cholesterol (for each 30 mg/dL increase): | 1.27 (1.09–1.52) | 0.002 |
| HDL cholesterol (for each 10 mg/dL decrease): | 1.49 (1.29–1.71) | <0.001 |
| (D) The anthropometric variable considered in this model was sagittal abdominal diameter (SAD) | ||
| Sex (being female) | 2.12 (1.42–3.18) | <0.001 |
| SWC (for each 2-cm increase): | 1.57 (1.42–1.73) | <0.001 |
| Non-HDL cholesterol (for each 30 mg/dL increase): | 1.35 (1.16–1.56) | <0.001 |
| HDL cholesterol (for each 10 mg/dL decrease): | 1.51 (1.31–1.74) | <0.001 |
HDL: high density lipoprotein; CI: OR confidence interval; OR: odds ratio.
Predicting variables considered before arriving at the four models discussed included: age, sex, high blood pressure, HDL cholesterol, non-HDL cholesterol, and triglycerides.
Obesity is an increasingly common problem in Western society. Its importance mainly lies in its association with cardiovascular morbidity and mortality, but also with other diseases such as liver steatosis, sleep apnea, or musculoskeletal diseases.6 The prevalence of obesity in our study, as assessed by BMI, was similar to that reported in other population studies conducted.17 Sex-related prevalence by age group was also similar: higher in young males, similar in middle-aged subjects of both sexes, and higher in women over 65. Also in agreement with already known data, overall central obesity levels were higher in males as compared to females. Obesity occurred at an earlier age in males, but there was a trend towards similar obesity rates in both sexes from 65 years of age.
Measurement of IR is one of the limitations of this study, as there is no established cut-off point. Thus, some studies18,19 used p75 of the sample excluding diabetic and glucose-intolerant subjects, others16 defined their own cut-off point, and still others did not specify their calculation method.20 The cut-off point decided upon in our sample was based on the criteria of Ascaso et al.16 IR was defined as a HOMA index ≥1.24. This value is quite different from those used in prior studies, such as the Ascaso et al. study, where a cut-off point of 3.8 was used,16,21 or the PREDIR study,20 which reported a cut-off point of 3.5. We think that such a difference is mainly due to the great variability in measurement of plasma insulin levels, although there may be other influential factors, such as the fact that our study was conducted on a population sample, while all other studies were done under standard practice conditions.
The prevalence of IR was found to be 39.8% (37.1% in females and 43.6% in males). Despite the different cut-off points, we found prevalence rates similar to Ascaso,16,21 but different from those reported by other authors (11.3% in the PREDIR study20 and 56.6% in the DESIRE study18).
Differences were also seen in IR prevalence by age group, but they were only significant in the female subgroup. An increasing trend was seen with age, except in subjects over 65 years of age, in whom IR prevalence paradoxically decreased in both sexes. This may be explained by the pathophysiology of diabetes. Thus, IR is known to occur much sooner than diabetes, being compensated for in prediabetes by increased insulin secretion. When this compensation is no longer sufficient, hyperglycemia occurs and the condition is diagnosed. IR then continues, and insulin secretion gradually decreases. The prevalence of diabetes increases with age. Thus, if we exclude this group from the study, subjects with IR will be excluded, which will result in this deceptive decrease in prevalence at advanced ages.
All the anthropometric measures assessed, including SAD, were higher in the IR group, with a statistically significant difference in all cases. These data agree with the proven relationship between obesity and IR. WC was measured in two positions, with higher mean values being found in the supine than in the standing position. The World Health Organization (WHO) recommends measurement of WC in the standing position.6 WC was measured in our study in both positions to assess the differences between them and to allow for a better comparison with SAD, as this is measured in a supine position.
The correlation coefficient between the HOMA index and the different anthropometric measures showed a narrow range of values (from 0.421 and 0.474). Evaluation using ROC curves showed that WCs best classify subjects with IR, although the difference was small. Prior studies reported conflicting results. The problems we found in making comparisons concerned differences in the study populations and the correct procedure for measuring SAD. Agreement appears to exist that SAD should be measured in the supine position,11,13,14 but there is no agreement as to whether measurement should be done with the legs extended or flexed.12,22 According to our results, there is no great difference between the use of SAD and WC that agrees with other studies such as the one reported by Mukuddem et al.22 In our view, the small differences found would not warrant a recommendation to use a more complex tool (calliper instead of measuring tape) that is less readily available in daily clinical practice. WC measurement in supine position could be worthwhile, because the technical difficulties involved are similar and it has been found to correlate better with the HOMA index and to provide better results when assessed as a diagnostic tool. Comparisons of this measure taken in both positions would be required to achieve more solid conclusions.
The logistic regression models used showed that increases in all anthropometric measures taken increase the risk of IR. An association between cholesterol levels (both HDL-C and non-HDL cholesterol) and IR persisted in all cases. These results are similar to those reported by other studies in terms of the association of IR with both anthropometric measures and lipid profile. Thus, Santi et al.8 noted increased IR and decreased HDL-C levels as WC increased. IR was not associated with decreased HDL-C levels, but was associated with increased TG levels. However, this study was conducted on males under 45 years of age and used a different cut-off point to define IR (2.2), which makes comparisons difficult. An association of decreased HDL-C levels and increased non-HDL cholesterol levels with increased visceral fat had already been seen in prior studies.9 Our results also show that they are associated with IR, which also occurs in the model when the anthropometric measure considered is BMI, a variable that provides the worst assessment of abdominal obesity. In the Demerath et al.23 study, a relationship was seen between visceral fat, increased BMI, and higher LDL cholesterol levels. In the Ohrvall, Berglund, and Vessby study,24 in which SAD was measured in 885 subjects in the same way as in our study, a better relationship of SAD, as compared to supine WC, was also found with both total cardiovascular risk and lipid profile, particularly in males.
In conclusion, a clear relationship exists between the different anthropometric measures, including SAD, and the presence of IR in the general population. The small difference found with the supine WC measurement does not justify recommending the use of SAD in daily clinical practice until more data are available. A relationship also exists between a change in lipid profile (decreased HDL-C and increased non-HDL cholesterol levels) and an increased risk of IR. It would also be convenient to establish common criteria for assessing IR, as measured by the HOMA index, to allow for making comparisons between different studies.
Fieldwork was supported by FISCAM grant no. 03069-00.
Please cite this article as: Simarro Rueda M, et al. Relación de la resistencia a la insulina con diferentes medidas antropométricas y factores de riesgo cardiovascular en una población no diabética. Endocrinol Nutr. 2011;58:464–71.
