


Only scarce information is available on body composition changes with age measured simultaneously by electrical impedance and computed tomography.
AimWe aimed to describe the age-related changes of the body composition and adipose tissue distribution in Bulgarians.
Material and methodsThis cross-sectional study included 130 participants (mean age 53±9.8 years, range 35–65), divided according to their body mass index (BMI): BMI<25.0kg/m2 (18 women, 12 men); BMI 25.0–34.9kg/m2 (50 women, 50 men). Body composition was assessed by bioelectrical impedance on a Tanita TBF-215 analyzer (Tanita Corp., Tokyo, Japan). The abdominal fat was measured by computed tomography on a CT/L scanner (GE Medical Systems, USA).
ResultsIncreasing age was associated with a mean decrease in body weight by 268g per year in the normal weight subjects and by 390g in the overweight ones as well as with a fat-free mass decrease of 321g and of 291g per year respectively (p<0.001). One year of increasing age was associated with a mean increase of visceral adipose tissue by 2.43cm2 in the overweight group and by 2.68cm2 in the normal weight subjects and with a decrease of the subcutaneous adipose tissue by 2.30cm2 per year in the latter group (p<0.001). The association of fat mass and fat-free mass with age in men and women was best described by quadratic equations (both increased until the age of 45–50 and decreased thereafter).
ConclusionsOur data showed a significant association between age and decreasing fat-free mass, increasing fat mass and abdominal fat accumulation.
Se dispone de escasa información sobre los cambios que acaecen con la edad en la composición corporal, medida simultáneamente por impedancia eléctrica y tomografía computarizada.
ObjetivoEl objetivo fue describir los cambios relacionados con la edad en la composición corporal y la distribución del tejido adiposo en la población búlgara.
Material y métodosEste estudio transversal incluyó a 130 participantes (edad media 53 años±9,8 años, intervalo 35–65 años), divididos de acuerdo a su índice de masa corporal (IMC): IMC <25,0kg/m2 (18 mujeres, 12 hombres), IMC entre 25,0 y 34,9kg/m2 (50 mujeres, 50 hombres). La composición corporal fue evaluada por impedancia bioeléctrica con un analizador Tanita TBF-215 (Tanita Corp., Tokio, Japón). La grasa abdominal se midió mediante tomografía computarizada en un escáner CT/L (GE Medical Systems, EE.UU.).
ResultadosLa edad avanzada se asoció con una disminución media del peso corporal de 268g por año en los sujetos de peso normal y de 390g en aquellos con sobrepeso. También se observó una disminución de la masa sin grasa de 321g y 291g por año, respectivamente, en los dos grupos mencionados (p<0,001). Cada aumento de un año en edad se asoció con un incremento medio de tejido adiposo visceral de 2,43cm2 en el grupo con sobrepeso y de 2,68cm2 en las personas con peso normal así como con una disminución del tejido adiposo subcutáneo de 2,30cm2 por año en el último grupo (p<0,001). La mejor descripción de la asociación entre la masa grasa y la masa sin grasa respecto a la edad en hombres y mujeres resultó de ecuaciones cuadráticas (ambas aumentaron hasta la edad de 45–50 años y disminuyeron a partir de esa edad).
ConclusionesNuestros datos muestran una asociación significativa entre la edad y la disminución de la masa sin grasa, con un aumento de la masa grasa y la acumulación de grasa abdominal.
Advanced age is characterized by a decrease in skeletal muscle mass and an increase in body fat defined as sarcopenia.1–3 A number of publications have shown that the sarcopenic loss of muscle mass contributes to functional impairment, physical disability, reduced ability to cope with stress, and increased mortality.4–6 The central or truncal adiposity is clearly associated with cardiovascular and metabolic (including diabetes mellitus) morbidity.7–10 The centralization of body fat in the presence of a steady total body weight in people with normal body mass index (BMI) was described as metabolic obesity in normal weight subjects.11 This type of obesity can be found in 13–18% of all normal weight subjects. On the other hand, there is clear evidence that diet and physical activity as well as some pharmacological interventions can stop or even reverse the progression of sarcopenia and sarcopenic obesity.12,13 There is therefore a clear need for epidemiological data on body composition changes with aging.14
A number of methods are used for measuring body composition and body fat distribution.15–18 Among the gold standards for body composition analysis are computed tomography (CT) and dual-energy X-ray absorptiometry (DXA). The bio-electrical body impedance analysis (BIA) is a simple, low-cost, safe, accurate, and reproducible method for body composition analysis.19 It has shown a great potential to be employed for epidemiological and clinical studies.20,21
To our knowledge, there is still no information available on body composition changes with aging in the Bulgarian population. Combined data coming from different body composition analysis methods are rather scarce.
The aim of the present study was to assess the age-related changes in the body composition and fat distribution in men and women as well as in subjects with normal weight (BMI<25.0kg/m2) and in subjects with overweight and grade I obesity (BMI 25.0–34.9kg/m2).
Materials and methodsPatientsThis study was a cross-sectional one and included 130 independent, community-dwelling Bulgarians aged between 35 and 65 years divided into two groups: (1) an overweight or mildly obese group consisting of 100 participants with a BMI between 25.0 and 34.9kg/m2 (50 men and 50 women), and (2) a normal weight group consisting of 30 participants with a BMI below 25.0kg/m2 (12 men and 18 women). The inclusion criteria were that subjects should be ambulatory, non-exercising, and non-smoking, and that, by self-reports, their body weight had changed by ≤2kg over the previous 6 months. The exclusion criteria included severe organ failure, and conditions and medications known to affect body weight and/or body composition. Half of the participants were recruited among subjects referred for bone density testing and the other half were volunteers referred from general practitioners and other medical specialists for body composition assessment. The study was approved by an independent Ethical Committee (Medical Institute—MVR). All participants gave their informed consent prior to the study procedures.
Metabolic parameters were studied in the morning after an overnight fast: fasting plasma glucose (FPG) and insulinemia (IRI), glycated hemoglobin A1c, and lipid profile. The Homeostatic Model Assessment (HOMA) index was calculated as FPG (mmol/l)×IRI (UI/l)/22.5. Blood pressure was measured twice with an aneuroid sphygmomanometer.
Body composition measurements by bio-electrical impedance analysisFoot-to-foot bioelectrical impedance analysis (BIA) was performed in the early morning after an overnight fasting for at least 12h. The subjects were required to adhere to standard BIA testing guidelines—European Society for Parenteral and Enteral Nutrition (ESPEN) guidelines for the use of BIA measurements of 2004.19 The bioelectrical impedance was measured in subjects wearing light clothes standing erect with bare feet on the analyzer's footpads. The feet were cleaned with soap and water and air-dried prior to the BIA procedure. A Tanita TBF-215 leg-to-leg analyzer (Tanita Corp., Tokyo, Japan) was used. Specific data for body composition calculations included age, sex, and body type (athletic, normal). The analyzer measured body height (to the nearest 1.0cm) and weight (to the nearest 0.1kg), as well as body impedance (in Ohms). BMI (in kilograms per square meter) was automatically calculated. This device provided further data for fat mass (FM) and fat-free mass (FFM) to the nearest 0.1kg, and for the percentage of total body fat (% BF) as well as for the resting metabolic rate (kcal/day).
In a previous work we had validated this BIA device versus body composition measured by dual-energy X-ray absorptiometry (Hologic QDR 4500A, Hologic Inc., Bedford, MA, USA).22 DXA derived body composition parameters were not significantly different from BIA estimates and were highly correlated (e.g. for FFM, r=0.82–0.95). In lean individuals BIA tended to produce lower values for FM and %BF and higher ones for FFM in comparison with DXA. This trend was reversed at BMI>35kg/m2.
Abdominal fat assessed by computed tomographyThe fat tissue distribution was assessed by computed tomography (General Electric Medical System—CT/L) in a single slice at the level of lumbar vertebrae L4–L5. The participants were lying in the supine position; the scanning time was 2s and the scan width was 10mm. The fat mass attenuation window was assumed to be 30–190Hounsfield units. The software computed the surfaces of the subcutaneous adipose tissue (SAT) and visceral adipose tissue (VAT) in square centimeters.
Precision studyThe in vivo coefficient of variation (CV%) of BIA was calculated according to Glüer et al.23 as root-mean-squares from duplicate measurements of 30 female subjects with their BMI ranging from 23.1 to 36.2kg/m2 (mean BMI—30.3kg/m2).
Statistical analysisData were analyzed using the SPSS software (version 12.0.1; SPSS Institute, Chicago, USA). All body composition parameters under study were assessed as normally distributed and descriptive statistics was applied. The relation between age and each body composition measurement was tested using regression analysis (the curve estimation procedure) in which the observed body composition value was set as the dependent variable. Statistical significance was set at p≤0.05.
ResultsThe in vivo CV% of BIA was 0.86% for %BF, 780g for FM, and 680g for FFM.
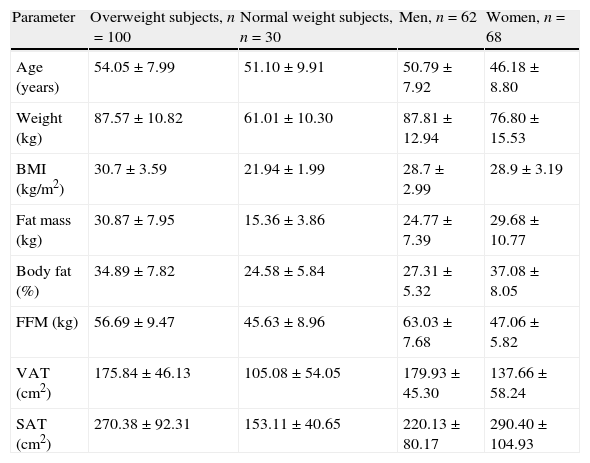
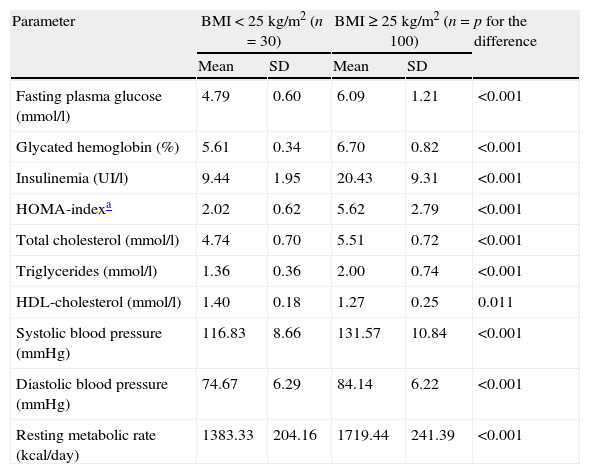
The descriptive characteristics of the study participants are summarized in Table 1. The metabolic data of the study subjects are summarized in Table 2.
The anthropometric, body composition and adipose tissue distribution data of the participants subdivided by sex (men and women) or body mass index (overweight and normal weight). Values are shown as mean±standard deviation.
| Parameter | Overweight subjects, n=100 | Normal weight subjects, n=30 | Men, n=62 | Women, n=68 |
| Age (years) | 54.05±7.99 | 51.10±9.91 | 50.79±7.92 | 46.18±8.80 |
| Weight (kg) | 87.57±10.82 | 61.01±10.30 | 87.81±12.94 | 76.80±15.53 |
| BMI (kg/m2) | 30.7±3.59 | 21.94±1.99 | 28.7±2.99 | 28.9±3.19 |
| Fat mass (kg) | 30.87±7.95 | 15.36±3.86 | 24.77±7.39 | 29.68±10.77 |
| Body fat (%) | 34.89±7.82 | 24.58±5.84 | 27.31±5.32 | 37.08±8.05 |
| FFM (kg) | 56.69±9.47 | 45.63±8.96 | 63.03±7.68 | 47.06±5.82 |
| VAT (cm2) | 175.84±46.13 | 105.08±54.05 | 179.93±45.30 | 137.66±58.24 |
| SAT (cm2) | 270.38±92.31 | 153.11±40.65 | 220.13±80.17 | 290.40±104.93 |
BMI, body mass index; FFM, fat-free mass; VAT, visceral adipose tissue; and SAT, subcutaneous adipose tissue.
The metabolic data of the overweight and normal weight groups are shown as mean and standard deviation.
| Parameter | BMI<25kg/m2 (n=30) | BMI≥25kg/m2 (n=100) | p for the difference | ||
| Mean | SD | Mean | SD | ||
| Fasting plasma glucose (mmol/l) | 4.79 | 0.60 | 6.09 | 1.21 | <0.001 |
| Glycated hemoglobin (%) | 5.61 | 0.34 | 6.70 | 0.82 | <0.001 |
| Insulinemia (UI/l) | 9.44 | 1.95 | 20.43 | 9.31 | <0.001 |
| HOMA-indexa | 2.02 | 0.62 | 5.62 | 2.79 | <0.001 |
| Total cholesterol (mmol/l) | 4.74 | 0.70 | 5.51 | 0.72 | <0.001 |
| Triglycerides (mmol/l) | 1.36 | 0.36 | 2.00 | 0.74 | <0.001 |
| HDL-cholesterol (mmol/l) | 1.40 | 0.18 | 1.27 | 0.25 | 0.011 |
| Systolic blood pressure (mmHg) | 116.83 | 8.66 | 131.57 | 10.84 | <0.001 |
| Diastolic blood pressure (mmHg) | 74.67 | 6.29 | 84.14 | 6.22 | <0.001 |
| Resting metabolic rate (kcal/day) | 1383.33 | 204.16 | 1719.44 | 241.39 | <0.001 |
BMI, body mass index; HOMA, homeostasis model assessment; SD, standard deviation; and HDL: high-density lipoprotein.
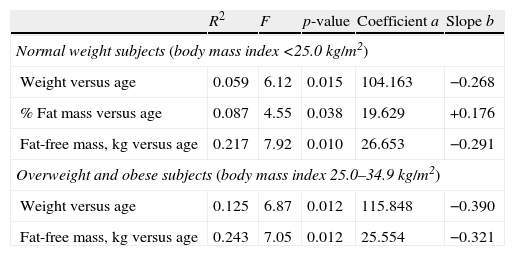
All tested associations of age with weight, % body fat, fat mass, and fat-free mass, although very week, were best described by linear regression models. The parameters of the regression equations such as square R, degrees of freedom (F), significance (p), regression line coefficients (a), and slopes (b), are summarized in Table 3.
The results of the regression analyses of the body composition parameters plotted against age are listed.
| R2 | F | p-value | Coefficient a | Slope b | |
| Normal weight subjects (body mass index <25.0kg/m2) | |||||
| Weight versus age | 0.059 | 6.12 | 0.015 | 104.163 | −0.268 |
| % Fat mass versus age | 0.087 | 4.55 | 0.038 | 19.629 | +0.176 |
| Fat-free mass, kg versus age | 0.217 | 7.92 | 0.010 | 26.653 | −0.291 |
| Overweight and obese subjects (body mass index 25.0–34.9kg/m2) | |||||
| Weight versus age | 0.125 | 6.87 | 0.012 | 115.848 | −0.390 |
| Fat-free mass, kg versus age | 0.243 | 7.05 | 0.012 | 25.554 | −0.321 |
The regression equations are linear: The studied body composition parameter=coefficient a+slope b×age (years).
Table 3 shows that 1 year of increasing age is associated with a mean decrease in body weight by 268g in the normal weight subjects and by 390g in the overweight subjects. In the normal weight subjects 1 year is also associated with a mean increase in %FM by 0.176%. In the overweight subjects there was no significant model for %FM versus age. One year of increasing age is associated with a mean FFM decrease of 321g and of 291g in the overweight and the normal weight subjects respectively. The associations of age with the body composition parameters were generally stronger in the overweight group.
The BMI was linearly correlated with age only in the normal weight group. One year of increasing age was associated with a BMI decrease by 0.1kg/m2. BMI and age were not correlated in the overweight group.
Abdominal fat in agingThe curve estimation analysis of VAT plotted against age produced a linear model in the overweight group and an S model in the normal weight group. The following equations best described the regression lines:
Normal weight group: VAT (cm2)=e(5.757−56.131/ageinyears); p=0.033, F=7.06, R2=0.502.
Overweight group: VAT (cm2)=54.425+2.429×age in years (p=0.016, F=6.31, R2=0.136).
These data show that 1 year of increasing age is leading to a mean increase of VAT by 2.43cm2 in the overweight group and by 2.68cm2 in the normal weight subjects.
The subcutaneous adipose tissue (cm2) was associated with age only in the normal weight group. The regression line was best described by the following linear model:
SAT in cm2=267.109−2.295×age in years (p=0.040, F=6.33, R2=0.475).
According to this, increasing age is leading to a mean decrease of SAT by 2.30cm2 per year in this group. No association was found between SAT and age in the overweight group.
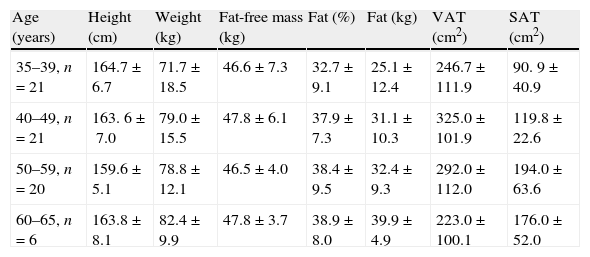
Body composition changes with age by sexThe body composition changes in both sexes are presented in the different age groups in Tables 4 and 5, separately for women and men.
The body composition data of the 68 female participants assessed by bio-electrical impedance and computed tomography are presented stratified by age (mean±standard deviation).
| Age (years) | Height (cm) | Weight (kg) | Fat-free mass (kg) | Fat (%) | Fat (kg) | VAT (cm2) | SAT (cm2) |
| 35–39, n=21 | 164.7±6.7 | 71.7±18.5 | 46.6±7.3 | 32.7±9.1 | 25.1±12.4 | 246.7±111.9 | 90. 9±40.9 |
| 40–49, n=21 | 163. 6±7.0 | 79.0±15.5 | 47.8±6.1 | 37.9±7.3 | 31.1±10.3 | 325.0±101.9 | 119.8±22.6 |
| 50–59, n=20 | 159.6±5.1 | 78.8±12.1 | 46.5±4.0 | 38.4±9.5 | 32.4±9.3 | 292.0±112.0 | 194.0±63.6 |
| 60–65, n=6 | 163.8±8.1 | 82.4±9.9 | 47.8±3.7 | 38.9±8.0 | 39.9±4.9 | 223.0±100.1 | 176.0±52.0 |
VAT, visceral adipose tissue; and SAT, subcutaneous adipose tissue.
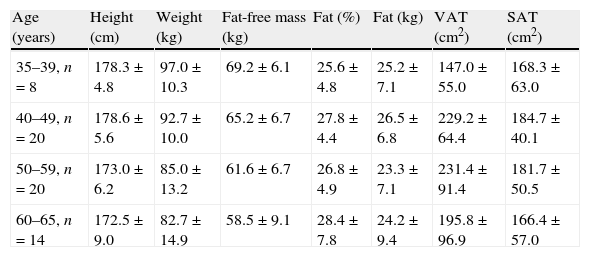
The body composition data of the 62 male participants assessed by bio-electrical impedance and computed tomography are presented stratified by age (means±standard deviations).
| Age (years) | Height (cm) | Weight (kg) | Fat-free mass (kg) | Fat (%) | Fat (kg) | VAT (cm2) | SAT (cm2) |
| 35–39, n=8 | 178.3±4.8 | 97.0±10.3 | 69.2±6.1 | 25.6±4.8 | 25.2±7.1 | 147.0±55.0 | 168.3±63.0 |
| 40–49, n=20 | 178.6±5.6 | 92.7±10.0 | 65.2±6.7 | 27.8±4.4 | 26.5±6.8 | 229.2±64.4 | 184.7±40.1 |
| 50–59, n=20 | 173.0±6.2 | 85.0±13.2 | 61.6±6.7 | 26.8±4.9 | 23.3±7.1 | 231.4±91.4 | 181.7±50.5 |
| 60–65, n=14 | 172.5±9.0 | 82.7±14.9 | 58.5±9.1 | 28.4±7.8 | 24.2±9.4 | 195.8±96.9 | 166.4±57.0 |
VAT, visceral adipose tissue; and SAT, subcutaneous adipose tissue.
Age influenced FM, FFM, SAT, and VAT differently in both sexes when data were combined for normal weight and overweight/obese individuals. In men, FM and FFM were best regressed on age by quadratic equations as shown below, whereas SAT and VAT were not significantly influenced by age (R2<0.200, p>0.05):
FM men (kg)=−62.96+3.92×age in years−0.043×(age in years)2 (R2=0.278, p=0.01);
FFM men (kg)=30.77+1.71×age in years−0.021×(age in years)2 (R2=0.223, p=0.029).
Both parameters (FM and FFM in men) increased slowly to the age of 45–47 years with a decline thereafter which was slower for FFM as compared to FM.
Similarly, in women FM and FFM were best regressed on age by quadratic equations as shown below:
FM women (kg)=−96.79+5.19×age in years−0.05×(age in years)2 (R2=0.299, p=0.049);
FFM women (kg)=44.02+1.12×age in years−0.02×(age in years)2 (R2=0.218, p=0.09).
Both parameters (FM and FFM in women) increased slowly to the age of 50 years with a decline thereafter which was less pronounced for FFM as compared to FM. The regression lines were very similar to those seen in men.
In women, SAT was not significantly influenced by age, whereas VAT regressed versus age produced a linear model:
VAT women (cm2)=−89.04+4.82×age in years (R2=0.524, p<0.001).
These data show that 1 year of increasing age is leading to a mean increase of VAT by 4.82cm2 in women.
DiscussionA few studies provide systematic data on the influence of the chronologic age on the body composition and body fat distribution. Most of them are of cross-sectional design and quite a few, such as The Baltimore Longitudinal Study of Aging and the ABC Study, actually provided long-term prospective data.24–27
Our cross-sectional data suggested a significant link between aging and the body composition changes. Increasing age was associated linearly with increasing percent body fat and with decreasing fat-free mass when subjects were subdivided into normal and overweight ones and the association was best fit by quadratic equations if subjects were divided according to sex. In both sexes FM and FFM increased until the age of 45–50 and decreased thereafter. The decrease was however steeper for fat-free mass, thus leading to accumulation of fat mass with aging. Our results are in line with other published studies.20,24,25 A study employing magnetic resonance imaging observed a reduction in relative skeletal muscle mass starting in the third decade; however, a noticeable decrease in absolute muscle mass was not observed until the end of the fifth decade.24 Another study using DXA found that all lean body mass parameters were significantly lower in subjects age 80 and older than in those aged 70–79, whereas the opposite trend was observed for fat mass.18 The bioelectrical impedance data from the NHANES III Study showed that FFM increased from the adolescent years to mid-adulthood and declined in older age groups.21 Mean total body fat also increased with older age groups to approximately 60 years of age, after which it decreased.
In addition to the age-related loss of skeletal muscle mass comes also the increased accumulation of visceral fat that was confirmed by a number of studies.7,15,18 Different imaging techniques provided a range of data about the increase of VAT. Enzi and Gasparo15 studied 130 participants aged 20 through 60 years and registered an increase of VAT of 0.49cm2 per year, while Lemieux et al.28 followed 32 moderately obese women aged 35±4 for 7 years and found an increase of 2.36cm2 per year. In a more recent study, DeNino et al.29 followed 178 normal weight women for 4–6 years and observed an increase in VAT of 4.57cm2 per year. The differences between the various studies can be explained by their design, study size, participants’ mean age, and the degree of obesity. In a longitudinal whole body MRI study, the mean yearly increase in VAT was 0.10kg.30 In our study the yearly changes of VAT and SAT were similar to those reported by DeNino et al. In the current study, the associations between age and the visceral fat accumulation were much stronger than those between age and the body composition parameters if accounting for BMI—in normal and overweight subjects (see also Table 2). The difference however disappeared when subjects were divided according to their sex. A much larger study assessing abdominal obesity by magnetic resonance reported that the waist-to-hip ratio in men and the waist circumference in women were the most powerful predictors of abdominal fat, whereas percentage of body fat was the most powerful predictor of subcutaneous fat.18
The variety of data coming from different studies as well as our results lead to the conclusion that body composition changes with aging cannot be described by a single model applicable to different ethnic populations or to different subsets of a single population. Our data show that the regression equations are different in normal weight and obese subjects as well as in men and women.
Our study has some limitations. It is of rather limited size and this precluded statistical analysis separately in men and women with normal weight and overweight to assess simultaneously the effects of obesity and sex. The study size created also limitations of the precision as some of the age groups included very low numbers of subjects. Our results cannot be applied uncritically to other populations or ethnic groups as they reflect body composition changes in a small group of subjects of Bulgarian origin and therefore our study lacks epidemiological validity. We used a cross-sectional design. Changes with advancing age are much better revealed in prospective cohort studies.
In conclusion, our study was able to confirm the expected age-related sarcopenic body composition changes and centripetal fat accumulation. This was the first study addressing the issue of aging and visceral obesity in a Bulgarian population. It did not address the prevalence of sarcopenia. More data are needed to establish a direct link between these age-related changes and specific metabolic risks.
Conflict of interestThe authors have no conflict of interest to declare.
Please cite this article as: Boneva-Asiova Z, Boyanov M. Age-related changes of body composition and abdominal adipose tissue assessed by bio-electrical impedance analysis and computed tomography. Endocrinol Nutr. 2011;58(9):472–7.
