


To report a pilot prevalence of maternal overweight, obesity and underweight in selected Greek counties.
MethodsA total of 441 adult childbearing women were recruited from maternity clinics in 6 Greek counties for this cross-sectional study. Pre-gravid weight status was defined according to the WHO cut-offs and gravid weight status was diagnosed with the Mardones and Rosso weight gain chart.
ResultsDuring gestation the majority of the participants were of normal body weight (BW) (34.0%), obesity was apparent in 25.6% of the sample, 23.8% of the participants were underweight, and the remaining 16.6% were overweight. Overall, pregnancy tripled the prevalence of underweight, increased the prevalence of obesity (by 388.0%) and decreased the number of participants in the normal BW category (p≤0.001 for all). The majority of participants classified in each pre-gravid weight-category remained in the same weight category during their gestation. All the pre-gravidly obese women were also obese during pregnancy. Underweight was more prevalent in Kavala (37.5%) and obesity was more frequent in Thessaloniki (30.8%). Women who were overweight prior to conception were highly likely to be overweight/obese during pregnancy (OR: 23.8, CI: 11.1–51.0).
ConclusionsThe results indicate a high prevalence of overweight, obesity and underweight among pregnant women in Greece.
Notificar una prevalencia piloto de sobrepeso, obesidad y bajo peso maternos en condados griegos seleccionados.
MétodosPara este estudio transversal se reclutó a un total de 441 mujeres adultas fértiles de maternidades de seis condados griegos. El estado ponderal pregrávido se definió de acuerdo con los puntos de corte de la OMS, y el estado ponderal grávido se diagnosticó con la tabla de ganancia de peso de Mardones y Rosso.
ResultadosDurante la gestación, la mayoría de las participantes (34,0%) tenían peso corporal (PC) normal. El 25,6% de la muestra tenía obesidad, el 23,8% bajo peso, y el 16,6% restante tenía sobrepeso. Globalmente, el embarazo triplicaba la prevalencia de bajo peso, aumentaba la prevalencia de obesidad (el 388,0%) y reducía el número de participantes en la categoría PC normal (p≤0,001 para todos) La mayoría de las participantes clasificadas en cada categoría de peso pregrávida permanecieron en la misma categoría de peso durante la gestación. Todas las mujeres obesas antes del embarazo siguieron siéndolo durante éste. El peso bajo fue más prevalente en Kavala (37,5%), y la obesidad fue más frecuente en Tesalónica (30,8%). Las mujeres con sobrepeso antes de la concepción tenían muchas probabilidades de presentar sobrepeso u obesidad durante el embarazo (OR: 23,8, IC: 11,1–51,0).
ConclusionesLos resultados indican una prevalencia alta de sobrepeso, obesidad y bajo peso en las mujeres griegas embarazadas.
Optimal gestational weight gain (GWG) has been found to decrease the number of complications during pregnancy, at delivery, and the postpartum periods,1 to contribute to a favorable pregnancy outcome2 and to limit adverse child health outcomes.3 However, despite the importance of optimal GWG, statistics on the prevalence of maternal obesity are limited,4 a fact mainly attributed to the lack of a unanimous definition of overweight/obesity during pregnancy.
In the UK, a few cohort studies have demonstrated an increase in maternal Body Mass Index (BMI) during the last few years.5 These results, however, do not depict the prevalence of obesity since BMI alone can only demonstrate a trend and does not provide a diagnosis when pregnant women are concerned. After all, BMI consists of a crude obesity index based on body mass according to one's height and is not applicable for determining weight status in populations like athletes and pregnant women.
Recently, the Institute of Medicine proposed ranges for optimal GWG according to the maternal pre-gravid weight status.6 However, these recommendations are lacking the exact amount of excess GWG that would diagnose overweight/obesity in each pre-gravid weight-category, in a given week of gestation. How would one classify a pregnant woman with 5kg above the recommended weight range? Is she considered overweight, obese or of normal body weight? Throughout scientific literature only one proposed diagnosis for underweight, overweight and obesity exists,6 based on a chart assessing BMI in each gestational week.7 Recent research in the Athens metropolitan area8 using the Mardones and Rossso7 chart demonstrated an alarming 41% of overweight/obesity during pregnancy.
The aim of the present cross-sectional study was (i) to assess the prevalence of maternal (gravid) underweight, overweigh and obesity in selected Greek counties, (ii) compare maternal gravid and pre-gravid weight-status, and (iii) assess the sociodemographic characteristics associated with maternal obesity.
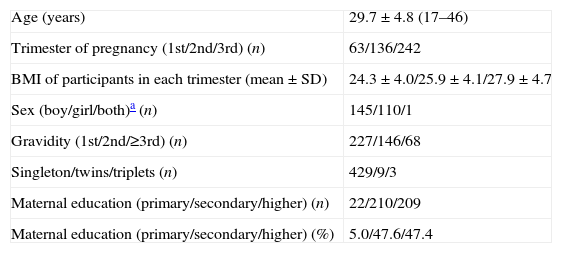
Materials and methodsA total of 441 childbearing women, all outpatients of hospitals and private maternity clinics in Greece were recruited during 2009–2010. Seventy-eight of the participants were recruited from clinics in Thessaloniki, 140 from Katerini, 100 from Serres, 22 from Thebes, 53 from Larisa and 48 from Kavala. All pregnant women willing to participate and able to communicate in the Greek language were included in the study. Sample characteristics are presented in Table 1. Permission for the study was granted from the Ethical Committee of the Alexander Technological Educational Institute and all participants provided informed consent prior to participation.
Sample characteristics.
| Age (years) | 29.7±4.8 (17–46) |
| Trimester of pregnancy (1st/2nd/3rd) (n) | 63/136/242 |
| BMI of participants in each trimester (mean±SD) | 24.3±4.0/25.9±4.1/27.9±4.7 |
| Sex (boy/girl/both)a (n) | 145/110/1 |
| Gravidity (1st/2nd/≥3rd) (n) | 227/146/68 |
| Singleton/twins/triplets (n) | 429/9/3 |
| Maternal education (primary/secondary/higher) (n) | 22/210/209 |
| Maternal education (primary/secondary/higher) (%) | 5.0/47.6/47.4 |
Body weight (BW) and height of participants were measured by an experienced physician (SECA 711 and SECA 220, Germany). Prepregnancy BW was attained from the medical records. BMI was calculated as BW (kg) divided by height squared (m). Pregestational BMI defined weight status before conception according to the WHO cut-offs (BMI<18.5kg/m2 for the classification of underweight, 25≤BMI<30kg/m2 for the classification of overweight and BMI≥30kg/m2 for diagnosis of obesity). Gestational BMI was used to classify participants as underweight/normal BW/overweight/obesity according to the Mardones and Rosso chart.7
Statistical analysesChi-square tests were used to compare each weight category among cities and to perform pre-gravid/gravid comparisons. Significance was set at 5%. Simple correspondence analysis (SCA)9,10 was performed to present categorical data graphically in a single plot. Wilcoxon's signed ranked test was used to compare the prevalence of each weight category prior and during pregnancy and McNemar's was applied in each weight category between cities. Odd ratios were calculated through the contingency tables and Pearson's correlation was applied. Two statistical software packages were used for the analyses, SPSS 15.0 (SPSS Inc., Chicago, IL, USA) and MiniTab® 14.0 (MiniTab Inc., State College, PA, USA).
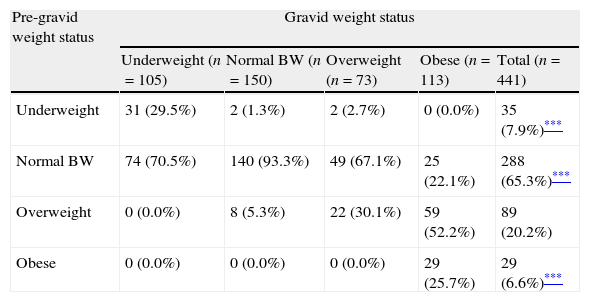
ResultsBefore pregnancy 7.9% of the sample was classified as underweight, the majority were of normal BW (65.3%), 20.2% of the participants were overweight, and 6.6% were obese (Table 2). During the gestational period 23.8% of the participants were underweight, the majority of the sample were still of normal BW (34.0%), 16.6% demonstrated excess in BW, whereas obesity was apparent in 25.6% of the sample. Overall, pregnancy tripled the prevalence of underweight increased the prevalence of obesity (by 388%) and decreased the number of participants within the normal BW category (p≤0.001 for all). The majority of women classified in each pre-gravid weight-category remained in the same weight category during their gestation. All the pre-gravidly obese women were also obese during pregnancy.
Participants in each weight category before and during pregnancy (n [%]).
| Pre-gravid weight status | Gravid weight status | ||||
| Underweight (n=105) | Normal BW (n=150) | Overweight (n=73) | Obese (n=113) | Total (n=441) | |
| Underweight | 31 (29.5%) | 2 (1.3%) | 2 (2.7%) | 0 (0.0%) | 35 (7.9%)*** |
| Normal BW | 74 (70.5%) | 140 (93.3%) | 49 (67.1%) | 25 (22.1%) | 288 (65.3%)*** |
| Overweight | 0 (0.0%) | 8 (5.3%) | 22 (30.1%) | 59 (52.2%) | 89 (20.2%) |
| Obese | 0 (0.0%) | 0 (0.0%) | 0 (0.0%) | 29 (25.7%) | 29 (6.6%)*** |
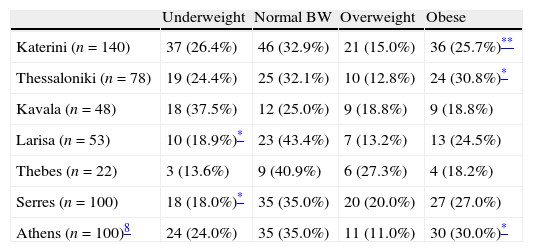
Table 3 presents the gravid weight status of participants according to the city of residence. Underweight was more prevalent in Kavala (37.5%), whereas the city with the greatest maternal obesity rate was Thessaloniki (30.8%). Maternal underweight was significantly lower in Serres and Larisa compared to Kavala (p≤0.05 for both). Larissa exhibited the highest prevalence of normal BW (43.4%) and inhabitants of Thebes were in their majority overweight (27.3%). Maternal obesity was more prevalent in Thessaloniki and Katerini compared to Kavala (p≤0.05 and p≤0.01 respectively).
Prevalence of maternal underweight, normal BW, overweight and obesity in selected Greek counties.
| Underweight | Normal BW | Overweight | Obese | |
| Katerini (n=140) | 37 (26.4%) | 46 (32.9%) | 21 (15.0%) | 36 (25.7%)** |
| Thessaloniki (n=78) | 19 (24.4%) | 25 (32.1%) | 10 (12.8%) | 24 (30.8%)* |
| Kavala (n=48) | 18 (37.5%) | 12 (25.0%) | 9 (18.8%) | 9 (18.8%) |
| Larisa (n=53) | 10 (18.9%)* | 23 (43.4%) | 7 (13.2%) | 13 (24.5%) |
| Thebes (n=22) | 3 (13.6%) | 9 (40.9%) | 6 (27.3%) | 4 (18.2%) |
| Serres (n=100) | 18 (18.0%)* | 35 (35.0%) | 20 (20.0%) | 27 (27.0%) |
| Athens (n=100)8 | 24 (24.0%) | 35 (35.0%) | 11 (11.0%) | 30 (30.0%)* |
Pre-gravidly underweight women were highly unlikely to become overweight/obese during gestation (OR: 0.1, CI: 0.0–0.3). Women aged ≤35 years old exhibited reduced odds in being overweight/obese during pregnancy (OR: 0.4, CI: 0.2–0.8). Between women of different pre-gravid weight statuses, those who were overweight prior to conception were highly likely to be overweight/obese during pregnancy (OR: 23.8, CI: 11.1–51.0). Primiparity, place of residence or education did not appear to have an effect on maternal overweight/obesity.
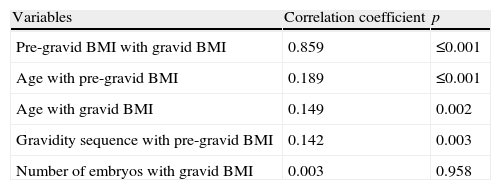
Correlation analysis revealed a strong association between pre-gravid and gravid BMI (r=0.859, p≤0.001) (Table 4). Additionally, weaker associations were observed between age with pre-gravid and gravid BMI, as well as between the sequence of gravidity and pre-gravid BMI. The number of embryos was not associated to the BMI of childbearing mothers.
Fig. 1 stresses the associations between different maternal weight statuses and demographic characteristics of the mothers, as determined by the SCA. Four distinct areas were defined, one for each weight status category. Underweight, situated on the left of the plot, was associated with secondary education. Normal BW, situated on the right of the plot, was associated with university education and singleton pregnancy. The prevalence of maternal obesity, shown on the upper middle of the plot, was associated with being in the 2nd trimester of pregnancy, multiparity and living in a rural environment. Maternal overweight was associated with being in the 3rd trimester of pregnancy, primiparity, singleton gravidity and urban residence.
Discussion
The overall prevalence of maternal obesity was 25.6%, whereas 16.6% of the participants were considered overweight. Pregnancy tripled the prevalence of underweight and nearly quadruplicated the prevalence of obesity. Pre-gravidly overweight women exhibited the greatest odds in becoming obese during gestation and all of those who were obese prior to conception remained obese during pregnancy as well.
The obesity epidemic does not seem to spare women of reproductive, and according to Heslehurst and associates,6 there is a trend toward an increase of maternal BMI during the last 15 years. Recent research from Athens8 demonstrated a higher prevalence of maternal obesity (30.0%) and a lower prevalence of overweight (11.0%) using the Mardones and Rosso7 weight gain chart. A total of 42.2% of the childbearing women herein exhibited excess in body weight (overweight and obesity together) during gestation, a finding akin to the Athens study.8 In Serres and Thebes this prevalence reached 47.0% and 45.5% respectively, with the lowest rate being demonstrated at Kavala (37.6%). Data concerning adult overweight/obesity in each region are limited and thus a comparison is not feasible. However these findings are alarming as maternal obesity is associated with increased risks for the health of both the mother and the fetus.
It is not known whether the increased prevalence of maternal overweight/obesity is the result of inadequate information provided by health practitioners. It is possible that a great majority of the overweight/obese women consider pregnancy as an opportunity to increase their food intake and gain weight on the advocacy of the fetus’ better growth. Recent research in Greece9 associated maternal obesity with low quality of diet, reduced meat and beans intake and attenuated protein intake. Since protein consists of the key nutrient for fetus growth, the argument of gaining weight for a healthy fetus growth is instantly rejected. It is more likely that pre-gravidly overweight women make use of pregnancy in order to camouflage their excess weight gain. This is further verified by the strong correlation observed between pre-gravid and gravid BMI. Gestation consists of a period characterized by weight gain; therefore, it is possible that overweight and obese women feel camouflaged to put on more weight. Althuizen11 described this phenomenon as the “maternal energy model”. Overweight women exhibit an excessive weight gain during pregnancy due to a perceived elevated food intake. This energy model has been verified in both Icelandic and Greek women.8,12 Additionally, the correlation analyses revealed a weak association between gravidity sequence and pre-gravid BMI, indicating that each pregnancy acts synergically in increasing the BMI of women.
On the other hand, the prevalence of underweight during pregnancy is increased, consisting of pre-gravidly normal weight or underweight women. In Athens,8 the prevalence of maternal underweight (24.0%) was akin to the present research. It is possible that these women experience fear of being fat even during gestation. Research has associated underweight during pregnancy with high quality of diet and greater protein intake,8 a finding indicative of health consciousness and a possible effort to ameliorate pregnancy outcome. The high prevalence of maternal underweight in the present sample consists of a new finding. Is maternal underweight the new trend or is underweight the result of morning sickness associated with the first months of pregnancy? Among the present participants, only 9.5% of the underweight were in the first trimester of gestation, 29.5% were in the second trimester and the remaining 61.0% were in the final trimester of pregnancy. Therefore the prevalence of underweight does not appear to stem from the nausea and vomiting experienced during the first trimester of gestation. It is more possible that the prevalence of maternal underweight is associated with health consciousness and body image perception and it would be useful if future research should address this matter. In the UK,13 maternal underweight during early pregnancy was related to malnutrition and residence in deprived neighborhoods. According to Melzer et al.14 however, gestation increases the resting metabolic rate of the childbearing mother which is partly compensated by a decrease in the activity energy expenditure. When energy needs are not met, a negative equilibrium is established, leading to underweight.
In Greece, maternal overweight and obesity have been associated with living in urban residence,8 whereas in the US it has been shown relevant to parity, ethnicity and education.6 According to the present findings, maternal overweight is associated with urban residence and obesity with rural residence. Previous research in Attica8 and Spain15 have demonstrated that urban residence is associated with lower diet quality during pregnancy and this could explain the increased prevalence of maternal obesity observed. As far as parity is concerned, the SCA associated overweight with primiparity and obesity with multiparity. University education was associated with normal BW during pregnancy and secondary education was associated with maternal underweight. This finding is important as it provides evidence on the importance of education, on weight maintenance and gain.
The aim of the present research was to report maternal weight status in selected Greek counties. Unfortunately due to lack of similar research in other countries the present findings are not easily comparable. The study is biased by its cross-sectional non-prospective design and the lack of participants from all Greek counties. However, the findings are important in stressing the increased prevalence of maternal underweight, overweight and obesity. Heslehurst5 noted that the majority of maternity units in the UK do not employ maternity-specific dieticians, a case also valid in Greece. However, it is of great importance for both the health of the mothers and their children to be diagnosed promptly in the case of underweight/obesity during pregnancy and to be monitored concerning their food intake by a professional.
Although the diagnosis of underweight, overweight and obesity during pregnancy is an important issue with impact on birth outcomes it has been left aside for many years. There appears to be lack of unanimous guidelines for these diagnoses, however the Mardones and Rosso weight gain Chart7 could serve as a provisional tool, since it is easily applicable from health practitioners and/or nurses. Some of the issues stated in the present manuscript warrant further research. Future research should assess GWG in each gravid weight category in order to determine the level of adherence to the GWG guidelines.
Conflict of interestNone declared.
