


Flash glucose monitoring in patients with type 1 diabetes provides new glucometric data that allow for the assessment of glycemic control beyond HbA1c. The objective of the study was to evaluate the relationship between HbA1c, time-in-range (TIR) and glycemic variability in a cohort of paediatric and adult patients with type 1 diabetes and treatment with flash glucose monitoring.
Material and methodsThis was a cross-sectional study in 195 patients with type 1 diabetes (42.6% females, 70 paediatric, 26.2% continuous subcutaneous insulin infusion, 28.7% coefficient of variation [CV]≤36%) in intensive treatment and flash glucose monitoring. Clinical, analytical and glucometric data were evaluated.
ResultsThe relationship between the TIR and HbA1c showed a strong negative linear correlation (R=−0.746; R2=0.557; P<.001), modified in those patients with CV≤36% (R=−0.852; R2=0.836) compared to CV>36% (R=−0.703; R2=0.551). A similar correlation was found when evaluating the TIR and the Glucose Management Indicator (R=−0.846; R2=0.715; P<.001); in patients with CV≤36% (R=−0.980; R2=0.960) versus CV>36% (R=−0.837; R2=0.701); P<.001. Both correlations remained stable in the paediatric population (R=−0.724; R2=0.525; P<.001) and adults (R=−0.706; R2=0.498; P<.001) and by type of treatment: multiple doses of insulin (R=−0.747; R2=0.558; P<.001) and continuous subcutaneous insulin infusion (R=−0.711; R2=0.506; P<.001). In a multiple regression analysis evaluating HbA1c as dependent variable, the only parameters that maintained statistical significance were the TIR (β=−0,031; P<.001), CV (β=0.843; P<.05) and TIR-CV interaction (β=−0.017; P<.01).
ConclusionsThe glycemic variability defined by the CV modifies the relationship between the TIR and HbA1c/Glucose Management Indicator and should be taken into account when individualising TIR targets, regardless of age or the type of treatment used.
La monitorización flash de glucosa en pacientes con diabetes tipo 1 proporciona nuevos datos glucométricos que permiten evaluar el control glucémico más allá de la HbA1c. El objetivo del presente estudio fue evaluar la relación de la HbA1c, el tiempo en rango (TIR) y la variabilidad glucémica en una cohorte de pacientes pediátricos y adultos con diabetes tipo 1 y monitorización flash de glucosa.
Material y métodosEstudio transversal en 195 pacientes con diabetes tipo 1 (42,6% mujeres, 70 pediátricos, 26,2% infusor subcutáneo de insulina, 28,7% coeficiente de variación [CV]≤36%) en tratamiento intensivo y monitorización flash de glucosa. Se evaluaron datos clínicos, analíticos y glucométricos.
ResultadosLa relación entre el TIR y la HbA1c mostró una correlación lineal fuerte negativa (R=−0,746; R2=0,557; p<0,001), modificada en pacientes con CV≤36% (R=−0,852; R2=0,836) frente a aquellos con un CV>36% (R=−0,703; R2=0,551). Esta misma correlación se observó al evaluar el TIR y el Glucose Management Indicator (R=−0,846; R2=0,715; p<0,001), tanto en pacientes con CV≤36% (R=−0,980; R2=0,960) como en aquellos con CV>36% (R=−0,837; R2=0,701); p<0,001. Ambas correlaciones se mantuvieron estables al ser evaluadas de manera independiente en población pediátrica (R=−0,724; R2=0,525; p<0,001), adultos (R=−0,706; R2=0,498; p<0,001) y por tipo de tratamiento: múltiples dosis de insulina (R=−0,747; R2=0,558; p<0,001) e infusor subcutáneo de insulina (R=−0,711; R2=0,506; p<0,001). En un modelo de regresión multivariante adoptando la HbA1c como variable dependiente, exclusivamente el TIR (β=−0,031; p<0,001), el CV (β=0,843; p<0,05) y la interacción TIR-CV (β=−0,017; p<0,01) mantuvieron la significación estadística.
ConclusionesLa variabilidad glucémica definida por el CV modifica la relación entre el TIR y la HbA1c/Glucose Management Indicator y debe tenerse en cuenta a la hora de individualizar objetivos de TIR, independientemente de la edad o el tipo de tratamiento utilizado.
The progressive implementation of continuous glucose monitoring (CGM), along with its further technological development and funding, have led to a revolution in the approach to metabolic control in type 1 diabetes mellitus (DM1). Although the relationship between HbA1c and the development of chronic complications is widely accepted, the huge amount of data provided by CGM has led to a change in the perception of blood glucose control “beyond HbA1c”.1 In fact, many authors advocate replacing the classic DM1 control parameters (HbA1c and hypoglycaemia) with new glucose parameters derived from the CGM evaluation, both measures of centrality (time in range [TIR]) and of blood glucose variability (BGV) (coefficient of variation [CV], standard deviation [SD], etc.).2
The limitations cited for the replacement of HbA1c include: the lack of precision measuring it in the laboratory in common clinical situations (haemoglobinopathies, anaemia, uraemia and pregnancy, among others); its variable and unpredictable relationship with the mean glucose on an individual level; and a half-life of around three months which does not allow for detecting rapid changes in the evaluation of blood glucose control.3
As an alternative to the classic control parameters, TIR and CV have been postulated as the preferred metrics, partly due to their close relationship with the levels of HbA1c and hypoglycaemia, respectively.4,5 Moreover, preliminary studies have associated these levels with the development of chronic complications.6 Despite this, the reference intervals assumed to be normal (TIR>70% and CV≤36%) have not been derived directly from prospective studies, but based on their linear relationship with the classic parameters: HbA1c<7.0% and increased incidence of severe hypoglycaemia episodes, respectively.5,7 Several authors recently questioned this correlation due to the lack of precision in the linear relationship between HbA1c and TIR,7 similar to that between HbA1c and mean glucose.8 In fact, recent studies in patients with type 2 diabetes and retrospective continuous glucose monitoring explain the lack of correlation between TIR and HbA1c as due to the influence of BGV, and insist on the need to establish individualised TIR targets taking this into account.9
The aim of this study was to assess the correlation between TIR and HbA1c and their relationship with BGV, in a cohort of paediatric and adult patients with DM1 on treatment with multiple dose injection (MDI) insulin therapy or continuous subcutaneous insulin infusion (CSII) and flash glucose monitoring.
Material and methodsCross-sectional study in a cohort of patients with DM1 on intensive insulin treatment (CSII or MDI) with flash glucose monitoring (Free Style Libre, Abbot Diabetes Care, Witney, United Kingdom) under follow-up at the Paediatric Endocrinology Unit and the Adult Endocrinology and Nutrition Department of a tertiary hospital. Flash glucose monitoring was prescribed following the public funding and prioritisation criteria approved by the Spanish National Health Service (visual impairment or severe functional limitations, recurrent hypoglycaemia, and pregnant women or women planning a pregnancy). We collected clinical and analytical data (HbA1c: turbidimetric inhibition immunoassay; NGSP, Roche Diagnostics, Geneva, Switzerland). We also analysed metabolic control data downloaded from the device for the last 15 days of flash glucose monitoring prior to the face-to-face consultation, when the device had been used for at least three months. Data collected from flash glucose monitoring were defined as: mean blood glucose; TIR (%) (defined as time with glucose 70–180mg/dl); CV (%); SD (mg/dl), Glucose Management Indicator (GMI); time above range (TAR [%], defined as time with glucose >180mg/dl); time below range (TBR [%], defined as time with glucose <70mg/dl); number of scans; and sensor use.10 Those patients with less than 80% use of the device were excluded. The study was approved by the hospital's Independent Ethics Committee.
The results are expressed as mean and SD. Normal distribution of the variables was analysed with the Kolmogorov–Smirnov test. Quantitative variables with normal distribution were analysed with a two-sided Student's t test. Non-parametric variables were evaluated using the Mann–Whitney U test. Qualitative variables were evaluated using the Chi-square test and, where necessary, Fisher's exact test. The association of quantitative variables was calculated using Pearson's linear correlation coefficient. Finally, a multiple regression model was used that incorporated as independent variables the effect of TIR, CV, age and type of treatment, as well as the interaction between TIR and CV (TIR-CV) on HbA1c as dependent variable.
P values <0.05 were considered statistically significant. We used the SPSS® statistical package, version 17.0 (SPSS Inc., Chicago, IL, USA) for the analysis.
ResultsWe studied 195 patients with DM1: 70 were paediatric patients (children and adolescents under 20 years of age) and 125 adults (≥20 years of age); 42.6% were female; 26.2% were on treatment with CSII and 28.7% had a CV≤36%. In the paediatric group, the mean age was 12.0±3.4 years, the mean time since onset of diabetes was 5.0±3.5 years and the mean HbA1c was 6.8±0.6%, with 28.6% on treatment with CSII. The mean number of flash glucose monitoring scans per day was 12.4±6.8, with mean blood glucose of 150±27 mg/dl, SD of 63.7±18.7 mg/dl, CV of 42.2±8.6% and TIR of 64.5±15.9%.
In the adult group (aged ≥20), the mean age was 37.7±12.3 years, the mean time since onset of diabetes was 18.6±10.8 years and the mean HbA1c was 7.4±1.1%. The mean number of flash glucose monitoring scans per day was 10.2±6.6, with mean blood glucose of 173±37 mg/dl, SD of 68.3±21.8 mg/dl, CV of 40.6±7.1% and TIR of 52.9±16.2% (Table 1).
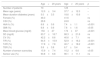
Comparison of results between paediatric and adult groups.
| Age<20 years | Age≥20 years | p | |
|---|---|---|---|
| Number of patients | 70 | 125 | – |
| Mean age (years) | 12.0±3.4 | 37.7±12.3 | – |
| Mean duration diabetes (years) | 5.0±3.5 | 18.6±10.8 | – |
| Female (%) | 48.3 | 41.6 | ns |
| CSII (%) | 28.6 | 24.8 | ns |
| HbA1c (%) | 6.8±0.6 | 7.4±1.1 | <0.001 |
| GMI (%) | 6.8±0.6 | 7.6±1.6 | <0.05 |
| Mean blood glucose (mg/dl) | 150±27 | 173±37 | <0.001 |
| SD (mg/dl) | 63.7±18.7 | 68.3±21.8 | ns |
| CV (%) | 42.2±8.6 | 40.6±7.1 | ns |
| TIR (%) | 64.5±15.9 | 52.9±16.2 | <0.001 |
| TAR (%) | 17.8±7.8 | 40.7±18.2 | <0.001 |
| TBR (%) | 5.8±3.8 | 6.7±5.4 | ns |
| Number of sensor scans/day | 15.9±7.4 | 10.2±6.6 | <0.05 |
| Sensor use (%) | 93.8±6.8 | 90.1±11.1 | ns |
CSII: continuous subcutaneous insulin infusion; CV: coefficient of variation; GMI: Glucose Management Indicator; HbA1c: plasma glycated haemoglobin; ns: not significant; SD: standard deviation; TAR: time above range; TBR: time below range; TIR: time in range.
Analysis of the association between TIR and HbA1c revealed a strong negative linear correlation (R=−0.746; R2=0.557; p<0.001) (Fig. 1). In other words, each absolute increase in TIR of 10% would mean a 0.75% change in HbA1c. However, when analysed in patients with low BGV, this correlation was altered (CV≤36%) (R=−0.852; R2=0.836), showing a higher correlation compared to patients with a high BGV index (CV>36%) (R=−0.703; R2=0.551); p<0.001 (Fig. 2A).

 and GMI (B) with respect to time in range stratified by coefficient of variation.")
Analysis of the association between TIR and GMI revealed a strong negative linear correlation (R=−0.846; R2=0.715; p<0.001). This correlation was also altered when analysing patients with low BGV (CV≤36%) (R=−0.980; R2=0.960) versus those with high BGV (CV>36%) (R=−0.837; R2=0.701); p<0.001 (Fig. 2B).
The TIR-HbA1c correlation remained stable when analysed separately in the paediatric group (R=−0.724; R2=0.525; p<0.001) and adult group (R=−0.706; R2=0.498; p<0.001), and by type of treatment used: MDI (R=−0.747; R2=0.558; p<0.001) and CSII (R=−0.711; R2=0.506; p<0.001).
When analysing HbA1c as a dependent variable in a multiple regression model that included TIR, CV, TIR–CV interaction, age and type of treatment as independent variables, the only variables that maintained statistical significance were TIR (β=−0.031; p<0.001), CV (β=0.843; p<0.05) and TIR-CV interaction (β=−0.017; p<0.01).
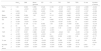
Lastly, we analysed the correlation between the different glucose metres used, finding a statistically significant higher correlation between the variables with a higher centrality component (mean glucose, HbA1c, GMI, TIR and TAR) and those with a higher dispersion component (SD, CV and TBR). Finally, a higher percentage of device use (number of scans and sensor use) was correlated with better values in the metabolic control parameters (Table 2).
Correlation between blood glucose measuring variables.
| HbA1c | GMI | Mean glucose | SD | CV | TIR | TAR | TBR | % use | Number of scans | ||
|---|---|---|---|---|---|---|---|---|---|---|---|
| HbA1c | r | 1.00 | 0.863 | 0.856 | 0.548 | 0.129 | −0.746 | 0.772 | −0.243 | −0.208 | −0.244 |
| p | – | <0.001 | <0.001 | <0.001 | ns | <0.001 | <0.001 | <0.001 | <0.001 | <0.001 | |
| GMI | r | 0.863 | 1.00 | 0.984 | 0.602 | 0.129 | −0.846 | 0.901 | −0.357 | −0.187 | −0.289 |
| p | <0.001 | – | <0.001 | <0.001 | ns | <0.001 | <0.001 | <0.001 | <0.05 | <0.001 | |
| Mean glucose | r | 0.856 | 0.984 | 1.00 | 0.617 | 0.112 | −0.857 | 0.888 | −0.376 | −0.234 | −0.314 |
| p | <0.001 | <0.001 | – | <0.001 | ns | <0.001 | <0.001 | <0.001 | <0.05 | <0.001 | |
| SD | r | 0.548 | 0.602 | 0.617 | 1.00 | 0.685 | −0.712 | 0.493 | 0.085 | −0.402 | −0.386 |
| p | <0.001 | <0.001 | <0.001 | – | <0.001 | <0.001 | <0.001 | ns | <0.001 | <0.001 | |
| CV | r | 0.129 | 0.129 | 0.112 | 0.685 | 1.00 | −0.381 | −0.009 | 0.561 | −0.307 | −0.316 |
| p | ns | ns | ns | <0.001 | – | <0.001 | ns | <0.001 | <0.001 | <0.001 | |
| TIR | r | −0.746 | −0.846 | −0.857 | −0.712 | −0.381 | 1.00 | −0.840 | 0.025 | 0.289 | 0.383 |
| p | <0.001 | <0.001 | <0.001 | <0.001 | <0.001 | – | <0.001 | ns | <0.001 | <0.001 | |
| TAR | r | 0.772 | 0.901 | 0.888 | 0.493 | −0.009 | −0.840 | 1.00 | −0.281 | −0.184 | −0.299 |
| p | <0.001 | <0.001 | <0.001 | <0.001 | ns | <0.001 | – | <0.001 | <0.05 | <0.001 | |
| TBR | r | −0.243 | −0.357 | −0.376 | 0.085 | 0.561 | 0.025 | −0.281 | 1.00 | −0.187 | −0.177 |
| p | <0.001 | <0.001 | <0.001 | ns | <0.001 | ns | <0.001 | – | <0.05 | <0.05 | |
| % use | r | −0.208 | −0.187 | −0.234 | −0.402 | −0.307 | 0.289 | −0.184 | −0.187 | 1.00 | 0.461 |
| p | <0.001 | <0.05 | <0.05 | <0.001 | <0.001 | <0.001 | <0.05 | <0.05 | – | <0.001 | |
| Number of scans | r | −0.244 | −0.289 | −0.314 | −0.386 | −0.316 | 0.383 | −0.299 | −0.177 | 0.461 | 1.00 |
| p | <0.001 | <0.001 | <0.001 | <0.001 | <0.001 | <0.001 | <0.001 | <0.05 | <0.001 | – |
CV: coefficient of variation; GMI: Glucose Management Indicator; HbA1c: plasma glycosylated haemoglobin; ns: not significant; SD: standard deviation; TAR: time above range; TBR: time below range; TIR: time in range.
CGM has revolutionised the approach to metabolic control in DM1. In fact, some authors advocate replacing HbA1c as the only control parameter, as it almost exclusively examines the central distribution of glucose levels.6 Nevertheless, although it is true that HbA1c has certain well-known limitations that can make it difficult to interpret,3 it is also the parameter with the most scientific evidence relating to the development of long-term complications.11 Therefore, having new alternative blood glucose parameters which allow a more complete assessment of the blood glucose profile without the limitations of HbA1c (centrality [TIR], hypoglycaemia [TBR], hyperglycaemia [TAR] and BGV [CV]) is a promising prospect.
The association between TIR and HbA1c, both parameters of centrality, is of particular interest when considering replacing HbA1c or the complementary use of the two variables. Recent studies have described a strong linear association between HbA1c and TIR.5,7 In fact, the authors who support this substitution base their arguments on the close correlation. However, it seems reasonable to think that patients with higher BGV should have lower TIR indices even with the same HbA1c, so the TIR control objective should be personalised, taking the BGV of each individual into account, or even their type of diabetes. To date, only one study in patients with type 2 diabetes and retrospective continuous glucose monitoring for 72 h has assessed the influence of BGV on the correlation between GMI and TIR.9 To our knowledge, this study is one of the first to assess the association between these glucose measurement systems in a population with DM1 treated with MDI or CSII and with different age ranges.
When we analysed the association between plasma HbA1c and TIR, we found a strong linear correlation, similar to those described in previous studies (R=−0.746; R2=0.557; p<0.001). In other words, each absolute increase in TIR of 10% would mean a 0.75% reduction in HbA1c. However, this linear correlation clearly changes according to the BGV and the TIR value. In fact, both regression lines stratified according to the CV intersect at an HbA1c of around 7.7%, similar to the study published by Lu et al. in type 2 diabetes.9 Therefore, the behaviour of the association between TIR and plasma HbA1c depends directly on the CV. In other words, with HbA1c>7.8%, the higher the CV, the greater the TIR; and inversely, with HbA1c<7.8%, the higher the CV, the lesser the TIR (Fig. 2A). This interdependence of the three variables (TIR, HbA1c and CV) is similar to that found when analysing TIR compared to GMI (R=−0.846; R2=0.715; p<0.001), being modified by the CV in a similar way to the association between plasma HbA1c and TIR for a GMI cut-off point of 8.1%. Moreover, it is particularly significant that the correlation between TIR and GMI in patients with low BGV is close to 1, i.e. practically perfect (R=−0.980; R2=0.960). That should not be so surprising, since the GMI comes from mathematical calculation using the mean blood glucose for the last 15 days of downloaded data, so it is logical that patients with practically no amplitude in their excursions, determined by BGV, should have a virtually “flat and non-fluctuating” blood glucose profile, with TIR and GMI matching in a perfect linear fashion (Fig. 2B).12 In fact, divergences between GMI and HbA1c have recently been related by the glycosylation index more than other biological factors.13
Our study found this relationship between the variables analysed regardless of the age of the patients studied (adult or paediatric) and the type of treatment used (MDI or CSII). In other words, as supported by the multiple regression analysis, the relationship between HbA1c/GMI and TIR is modified by the CV in the different groups studied, and not by age or the type of treatment.
Lastly, Table 2 shows the correlations between the different glucose measurement parameters most used in daily clinical practice according to international consensus.10 The statistically significant relationship between practically all the variables analysed clarifies things greatly. This relationship reflects the close dependence between the different parameters and, as has been recently described, highlights the difficulty of modifying some of them independently from the others.14 Obviously, this relationship is particularly close between variables that measure the same distribution pattern, such as centrality (HbA1c, GMI, mean glucose, TIR) and BGV-amplitude of blood glucose excursions (SD, CV, TAR and TBR), in addition to the relationship between intensive use of the device (percentage of use and number of scans) and better metabolic control. This interrelation supports the use of the new glucose metres as descriptive variables of metabolic control to be used together, and not as a replacement for the classic control parameters.
This study is one of the first to analyse the relationship between TIR and HbA1c and their association with BGV in a cohort of adult and paediatric patients with DM1 on treatment with MDI or CSII and using flash glucose monitoring in real clinical practice. Although the relatively small sample size may be considered one of its main limitations (especially compared to big data studies), the fact that it was conducted in a DM1 cohort under follow-up at a tertiary hospital ensures a thorough overall analysis of the patients’ clinical characteristics and metabolic control analytical variables, traditionally absent in this type of study.
In conclusion, the CV changes the association between the TIR and HbA1c/GMI and must be taken into account when personalising TIR targets, regardless of age or the type of treatment used. This close interrelation between the different glucose metres as variables of metabolic control supports them being used together, and not as replacements for the classic control parameters.
Conflicts of interestThe authors declare that they have no conflicts of interest.
GDS and MPBH made equal contributions to this manuscript.
Please cite this article as: Díaz-Soto G, Bahíllo-Curieses MP, Jimenez R, Nieto MO, Gomez E, Torres B, et al. Relación entre hemoglobina glucosilada, tiempo en rango y variabilidad glucémica en una cohorte de pacientes pediátricos y adultos con diabetes tipo 1 con monitorización flash de glucosa. Endocrinol Diabetes Nutr. 2021;68:465–471.

articles