


Pheochromocytoma and paraganglioma are uncommon tumours whose best known symptoms include high blood pressure, palpitations, headache, and sweating. Clinical identification is not easy, however, and requires biochemical tests that allow for early diagnosis, including measurement of metanephrines levels. The aim of this study was to assess the diagnostic performance of plasma free metanephrines (PMETs) and to verify the transferability of the reference values used.
MethodsPMETs levels were measured by liquid chromatography coupled to tandem mass spectrometry. Other biochemical tests evaluated (plasma catecholamine, urine metanephrine, catecholamine and vanilmandelic acid levels) were performed by liquid chromatography with electrochemical detection. Requests of these tests from 01/09/2015 to 31/10/2017 were reviewed, and both the reference values (document EP28-A3c) and the parameters of biological variation (Fraser method) for PMETs were estimated.
ResultsThe study sample consisted of 1279 patients (61.3% females) aged 0–90 years, including 19 with pheochromocytoma/paraganglioma. Tests requested included: PMETs (n=662), catecholamines (n=589), metanephrines (n=586), and vanilmandelic acid (n=513) in urine, and plasma catecholamines (n=228). Tests with higher sensitivity were urinary fractionated metanephrines (91.7%) and PMETs (82.4%). When performance was compared in patients with both tests (n=243), they detected the same number of tumours (90.9%), but PMETs showed greater specificity (93.5% vs. 88.8%). Plasma normetanephrine levels showed a significant association with age (rho=0.19, p<0.0001).
ConclusionPMETs and urinary fractionated metanephrines are the biochemical tests with better performance in diagnosis of pheochromocytomas/paragangliomas.
Los feocromocitomas y paragangliomas son tumores poco frecuentes cuyos síntomas más conocidos son hipertensión arterial, palpitaciones, cefalea y diaforesis. Sin embargo, su identificación clínica no es fácil. Por ello, se utilizan pruebas bioquímicas que permitan un diagnóstico precoz, destacando las metanefrinas. El objetivo de este estudio fue evaluar el rendimiento diagnóstico de las metanefrinas libres plasmáticas (MLP) y verificar la transferibilidad de los valores de referencia utilizados.
MétodosLas MLP fueron cuantificadas mediante cromatografía líquida de alta resolución acoplada a espectrometría de masas. Otras pruebas bioquímicas evaluadas (catecolaminas en plasma, metanefrinas, catecolaminas y ácido vanilmandélico en orina) fueron analizadas por cromatografía líquida de alta resolución con detección electroquímica. Se revisaron las solicitudes de dichas pruebas del 01/09/2015 al 31/10/2017 y se estimaron los valores de referencia (documento EP28-A3c) y los parámetros de variabilidad biológica (método de Fraser) de las MLP.
ResultadosSe estudiaron 1.279 pacientes (61,3% mujeres), con edades entre 0-90 años, incluyendo 19 casos de feocromocitoma/paraganglioma. Las solicitudes bioquímicas fueron: MLP (n=662), catecolaminas urinarias (n=589), metanefrinas urinarias (n=586), ácido vanilmandélico urinario (n=513) y catecolaminas plasmáticas (n=228). Las pruebas con mayor sensibilidad fueron las metanefrinas fraccionadas urinarias (91,7%) y las MLP (82,4%). Cuando se comparó el rendimiento en pacientes con ambas pruebas (n=243), estas detectaron los mismos casos (90,9%), pero las MLP fueron más específicas (93,5 vs. 88,8%). Para la normetanefrina plasmática se observó una asociación significativa con la edad (rho=0,19; p<0,0001).
ConclusiónLas MLP y las metanefrinas fraccionadas urinarias son las pruebas bioquímicas que ofrecen un mayor rendimiento en el diagnóstico de los feocromocitomas/paragangliomas.
Pheochromocytomas (PCTs) and paragangliomas (PGLs) are infrequent tumours, with 1–2 cases per 100,000 inhabitants and year, and are mainly derived from the chromaffin cells of the sympathetic nervous system.1 These neoplasms are located in the adrenal gland medulla (80–85% of all PCTs) or in the sympathetic nervous system ganglia of the chest, abdomen and pelvis (15–20% of all PGLs), and usually produce abnormally high levels of catecholamines and their metabolites. Paragangliomas located in the head and skull base are of parasympathetic origin.2
The typical signs and symptoms of PCTs/PGLs are well known, but are not very specific. The episodic secretion of catecholamines is responsible for most of the symptoms, including major fluctuations in blood pressure3,4 and the classic triad of palpitations (58%), headache (52%) and perspiration (49%).5 However, only 30–40% of all patients experience these three symptoms.3,6 The clinical identification of PCT/PGL is not easy, because approximately half of all patients experience paroxysmal arterial hypertension (AHT) or have normal blood pressure,7,8 and necropsy studies have shown that approximately 0.05% of all deceased individuals have undiagnosed PCT/PGL.9 At present, up to 40% of all PCTs/PGLs are considered to be hereditary, while the remaining 60% correspond to spontaneous cases.10
Pheochromocytomas/paragangliomas occur more frequently in individuals between 40 and 50 years of age, with a slight female predominance (55%).11 The prevalence differs according to the population studied. Thus, in the general population, the prevalence of PCT/PGL is less than 0.1%,8 while in patients with AHT the figure increases to 0.2–0.6%, and in patients with adrenal incidentalomas the prevalence is usually 3–7%2 but can reach 20%.12
The most common reasons for the biochemical study of PCT/PGL are the presence of AHT and episodic symptoms attributable to excess catecholamine output, as well as treatment-resistant AHT. Other indications are the determination of functionality of an adrenal incidentaloma, the assessment of genetic predisposition, the exclusion of tumour recurrence,13 young patients with AHT, and individuals with a history of hypertensive crises during anaesthesia. The traditionally used biochemical techniques have been the analysis of vanillylmandelic acid (VMA) and total catecholamines and metanephrines (MNs) in urine, and plasma catecholamines.
However, in recent years several publications have shown fractionated MNs in 24-h urine and plasma free metanephrines (PFMs) to afford a better diagnostic performance.14–18
In fact, according to the current recommendations of the American Society of Endocrinology, the initial biochemical study of PCT/PGL should include one of these two tests.19
Since PCTs/PGLs are potentially fatal tumours, especially if the patient suffers an adrenergic crisis, the establishment of an early diagnosis is very important.20 The availability of biochemical tests with a good diagnostic performance, in which sample extraction is fast and simple, is very useful for obtaining such an early diagnosis. To the best of our knowledge, the Medicine laboratory of the Department of Clinical Biochemistry of Hospital Universitario Central de Asturias (HUCA) was the first laboratory in Spain to incorporate the mass spectrometry measurement of PFMs within its range of services. The objective of the present study was to clinically validate the PFM test, introduced in 2015, based on a review of its diagnostic performance during its first two years of use, and to compare it with other classical biochemical tests used for the same purpose. In addition, the transferability of the reference values used for plasma MNs and normetanephrine (NMN) was verified and their biological variability parameters were assessed.
Material and methodsPre-analytical conditionsA sample collection for the determination of plasma MNs and catecholamines was made in a purple stopper tube containing K3-EDTA. The patients were instructed to avoid chocolate, bananas, vanilla, pineapple, nuts, coffee and tea before sampling. They were also instructed to avoid alcohol consumption. In addition, the suppression of drugs such as levodopa, hydrazine and its derivatives, monoamine oxidase inhibitors (MAOIs) and prochlorperazine was requested. Sampling was performed with the patient in the supine position after at least 15min of rest.
Urinary MNs, catecholamines and VMA were determined from 24-h urine collected in specific 3-l amber containers with a vacuum port, holding 10ml of HCl 6N as a stabilizing preservative.
Analytical methodsPlasma free metanephrines were quantified with a triple quadrupole mass spectrometer (QTRAP 5500, AB Sciex) coupled to a liquid chromatograph (Ekspert ultra LC 100, Eksigent). The method was developed and validated in our laboratory. Briefly, the technique includes the initial separation of MNs (500μl of plasma EDTA) using solid phase extraction cartridges (SampliQ WCX, 30mg, 1ml [Agilent]). After extraction, the MNs are subjected to gradient chromatographic separation using two mobile phases: ammonium formate with 0.2% formic acid, pH=3.2 (solution A) and methanol with 0.2% formic acid (solution B). These mobile phases are prepared with high purity reagents: LiChrosolv® methanol (Merck-Millipore), ultrapure Milli-Q® water, Suprapur® formic acid (Merck-Millipore) and ammonium formate, purity ≥99% (Fluka). The chromatographic precolumn and column used are: Pursuit 3 PFP MetaGuard 10mm×2mm and Pursuit 3 PFP, 2mm×150mm (Agilent), respectively. The calibrators are prepared from certified reference material: Catecholamine Mix 2 (Metanephrines) solution (Sigma–Aldrich). In addition, isotopic (deuterium) labelled internal standards are used for the standardization of all the steps of the analytical process: (±)-Metanephrine-D3 hydrochloride solution and (±)-Normetanephrine-D3 hydrochloride solution, 100μg/ml in methanol (Sigma–Aldrich). Software is used to operate the mass spectrometer and analyze the results: Analyst® (version 1.6.2) and MultiQuant™ (version 2.1.1296.0).
The linearity of the method is 20–2000pg/ml for both MN and NMN, with correlation coefficients (r2)>0.995. The inter-assay coefficients of variation (CV) are ≤4.1% and 6.2% for MN and NMN, respectively. The limit of quantitation (LoQ) was established at 20pg/ml.
The remaining biochemical tests evaluated (catecholamines in plasma and MN, catecholamines and VMA in urine) were analyzed using commercial analytical methods previously implemented in our laboratory. Specifically, these tests are quantified using high-performance liquid chromatography (HPLC) with electrochemical detection. The equipment used is a liquid chromatograph (model 1200 series, Agilent) with an electrochemical detector (model 1640, Bio-Rad®). Bio-Rad® kits are used for sample preparation and analysis.
The reference values used for all these tests are: <100 and <165pg/ml (for plasma MN and NMN, respectively), 10–67 and 95–446pg/ml (for plasma epinephrine and norepinephrine, respectively), 64–302 and 162–528μg/24h (for urinary MN and NMN, respectively), 0.6–20 and 15–80μg/24h (for urinary epinephrine and norepinephrine, respectively), and 1.8–6.7mg/24h (for urinary VMA).
PatientsA review of the medical records of the patients commented on below was made with the purpose of determining whether they had or had had PCT/PGL, based on the medical reports, imaging tests and pathology findings:
- Inclusion criteria: Patients with 24-h urine and/or plasma samples received at the Department of Clinical Biochemistry of HUCA between 1 September 2015 and 31 October 2017 (25 months), and a request for at least one of the following tests: PFM, plasma catecholamines, MN, catecholamines and VMA in urine.
- Exclusion criteria: Patients for whom data could not be obtained from the medical records.
The following software was used to review the electronic medical records: PowerChart (Cerner Millennium®) for reviewing the case histories of the patients seen at HUCA, and Cerner Selene® for reviewing the case histories of the patients seen at other district hospitals of the Asturian health service system, which refer these tests to our Department, our hospital being the corresponding reference centre.
During the study period, requests for some of the selected biochemical tests were received corresponding to 1794 patients. However, only 71.3% of the case histories (1279 patients) could be accessed, since the remainder corresponded to patients seen at the district hospitals and who had not received previous care at HUCA.
This situation prevented us from accessing their electronic medical records from PowerChart (Cerner Millennium®).
The final 1279 patients with a known history ranged in age from 0 to 90 years. The median age was 60 years, with an interquartile range (IQR) of 49–70 years. A little over one-half of the patients (61.3%) were women. The following biochemical tests were requested in these patients: PFMs (n=662), urinary catecholamines (n=589), urinary fractionated MNs (n=586), urinary VMA (n=513) and plasma catecholamines (n=228). In the cases of patients who had any of these tests performed more than once during the study period, we used the first of the biochemical test results.
The indications for these biochemical studies were: adrenal gland mass (n=445; 34.8%), AHT (n=234; 18.3%), known or suspected neuroendocrine tumour (NET) other than a PCT/PGL (n=186; 14.5%), the clinical triad (headache, perspiration and/or palpitations) (n=73; 5.7%), PCT/PGL (n=64; 5.0%), genetic disorder (n=44; 3.4%), and other reasons (n=233; 18.3%). Thus, more than half of the requests (53.1%) referred to patients with an adrenal mass or AHT. The main reasons for studies in patients with AHT were: hypertensive crisis, AHT difficult to control and/or resistant to drugs, AHT in young patients, and the exclusion of secondary causes of AHT in patients with chronic kidney disease or heart disease. Patients in which the reason for study was PCT/PGL, NET or carcinoid tumour were often individuals with an already known tumour and subjected to follow-up, or cases with simple clinical suspicions that were not subsequently confirmed. Many of the patients with possible NETs were studied in the context of suspected carcinoid tumour due to the presence of flushing and/or gastrointestinal disorders (mainly chronic diarrhoea and important weight losses).
Nineteen cases of PCT/PGL were finally detected in the study period (13 PCTs and 6 PGLs) (13 women and 6 men) and diagnosed by a combination of biochemical tests and imaging studies, with subsequent histopathological confirmation (immunohistochemical markers) after surgery.
Biological variability for MN and NMN was estimated based on serial plasma samples (n=25) corresponding to 8 individuals (3 samples per patient except for one individual with 4 samples), 7males and one female between 19 and 82 years of age. These were patients subjected to periodic follow-up due to RET gene mutation (n=5) or an adrenal gland mass (n=3) with no growth or functionality.
Statistical analysisA review was made of the appropriateness of the reference values used for PFM (<100pg/ml for MN and <165pg/ml for NMN), which were values established internally and used by the Mayo Clinic (Rochester) (https://www.mayomedicallaboratories.com/test-catalog/Clinical+and+Interpretive/81609) and published in the literature.21 To this effect, the results of all the patients with PFM test requests during the study period and with no presence of PCT/PGL were used, and a series of statistical analyses were made with MedCalc®, version 12.5.
The search for aberrant values was performed using the Reed test. Normal data distribution was assessed using the Kolmogorov–Smirnov test. Since the MN and NMN values did not follow a normal distribution, nonparametric tests were used for the remaining analyses. Thus, the Mann–Whitney U-test and the Kruskal–Wallis test were used to compare two or more groups of values of independent variables, respectively. Associations between variables were established based on the Spearman correlation coefficient. Lastly, the reference values were estimated according to the recommendations of document EP28-A3c of the Clinical and Laboratory Standards Institute, which provides methodological guidelines and statistical procedures to establish and verify values and reference ranges for quantitative analytical methods applied to clinical tests.22
The reference values were calculated using the nonparametric method, which required data ordering from lower to higher. The reference limits were then defined as percentiles 2.5 and 97.5 of the previously ordered data.
Accordingly if the data (x=1…n) are ordered from 1 to n, the order number is obtained according to the following formula:


The datum corresponding to that order number or the nearest whole number is the reference limit obtained. In this case, for PFM only the upper reference limit was used.
The biological variability parameters for MN and NMN were estimated, based on the Fraser method.23 The intra- (CVI) and inter-individual coefficients of variation (CVG) were calculated using the following formulas:
where SA+I2 is the experimental variance obtained with the results of each individual; SA2 is the analytical variance; ST2 is the total variance obtained with the results of all the individuals; and M is the mean concentration.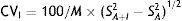
The individuality index (II) was calculated using the following formula:24
ResultsBiochemical diagnostic performance
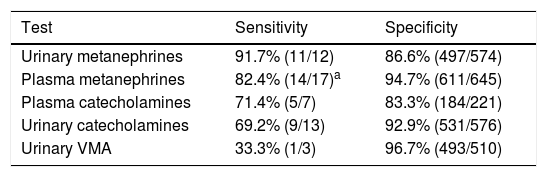
Table 1 shows the diagnostic performance of the different biochemical tests, in decreasing order of sensitivity. The tests showing the greatest sensitivity were urinary fractionated MN (91.7%) followed by PFM (82.4%). As regards specificity, VMA showed the best results (96.7%), followed by PFM (94.7%). On considering the 24-h urine results, MN showed far greater sensitivity than the other tests (catecholamines and VMA), but with lower specificity. Similarly, the results in plasma showed MN to offer better sensitivity (82.4% vs. 71.4%) and specificity (94.7% vs. 83.3%) than catecholamines.
Diagnostic performance of the different biochemical tests.
| Test | Sensitivity | Specificity |
|---|---|---|
| Urinary metanephrines | 91.7% (11/12) | 86.6% (497/574) |
| Plasma metanephrines | 82.4% (14/17)a | 94.7% (611/645) |
| Plasma catecholamines | 71.4% (5/7) | 83.3% (184/221) |
| Urinary catecholamines | 69.2% (9/13) | 92.9% (531/576) |
| Urinary VMA | 33.3% (1/3) | 96.7% (493/510) |
VMA: vanillylmandelic acid.
On comparing only the results obtained in urine samples involving the simultaneous request for MN and catecholamines (n=452), urinary MN continued to show greater diagnostic sensitivity (90.9% [10/11] vs. 81.8% [9/11]) despite poorer specificity (84.4% [372/441] vs. 91.4% [403/441]). Similarly, on comparing only the results obtained in plasma samples involving the simultaneous request for MN and catecholamines (n=129), MN continued to show better results in terms of sensitivity (85.7% [6/7] vs. 71.4% [5/7]) and specificity (93.4% [114/122] vs. 78.7% [96/122]).
Since MN measurement showed the greatest diagnostic sensitivity, we compared the results obtained in patients with this measurement in both urine and plasma (n=243). In these patients, both tests detected the same cases (90.9% [10/11]), but PFM proved comparatively more specific (93.5% [217/232] vs. 88.8% [206/232]). It should be noted that there were only three false positives (FPs) showing high MNs in both samples (plasma and urine), while in the remaining cases MNs were found to be elevated only in plasma or urine.
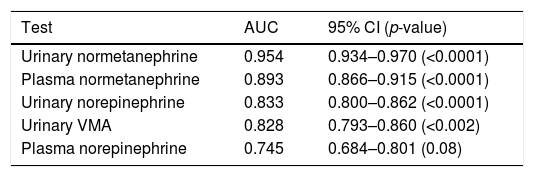
On plotting the diagnostic performance curves for the different biochemical tests analyzed in the 1279 patients, and focusing on the tests with the highest performance (NMN, norepinephrine and AVM), urinary NMN exhibited the greatest area under the curve (AUC=0.954), followed by plasma NMN (AUC=0.893) (Table 2). In addition, the Youden index calculated for plasma NMN was found to be 0.715 (sensitivity=76.5%; specificity=95.0%).
Diagnostic performance curves of some of the individual biochemical tests.
| Test | AUC | 95% CI (p-value) |
|---|---|---|
| Urinary normetanephrine | 0.954 | 0.934–0.970 (<0.0001) |
| Plasma normetanephrine | 0.893 | 0.866–0.915 (<0.0001) |
| Urinary norepinephrine | 0.833 | 0.800–0.862 (<0.0001) |
| Urinary VMA | 0.828 | 0.793–0.860 (<0.002) |
| Plasma norepinephrine | 0.745 | 0.684–0.801 (0.08) |
AUC: area under the curve; VMA: vanillylmandelic acid; 95% CI: 95% confidence interval.
This result was obtained using a cut-off point for plasma NMN of 168pg/ml, which is very similar to that currently used (165pg/ml).
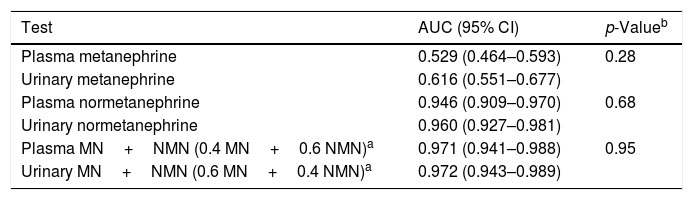
On plotting the diagnostic performance curves for urinary and plasma MN and NMN in patients with both measurements (n=243), the AUC of the urine tests was greater than that of the plasma tests, though statistical significance was not reached (Table 3). Furthermore, on combining MN and NMN, the AUCs obtained in urine and plasma were nearly equal (0.972 and 0.971, respectively).
Diagnostic performance curves in patients with simultaneous testing for urinary and plasma metanephrines.
| Test | AUC (95% CI) | p-Valueb |
|---|---|---|
| Plasma metanephrine | 0.529 (0.464–0.593) | 0.28 |
| Urinary metanephrine | 0.616 (0.551–0.677) | |
| Plasma normetanephrine | 0.946 (0.909–0.970) | 0.68 |
| Urinary normetanephrine | 0.960 (0.927–0.981) | |
| Plasma MN+NMN (0.4 MN+0.6 NMN)a | 0.971 (0.941–0.988) | 0.95 |
| Urinary MN+NMN (0.6 MN+0.4 NMN)a | 0.972 (0.943–0.989) |
95% CI: 95% confidence interval.
In the subjects (n=645) in which no PCT/PGL was identified, and who were between 9 and 90 years of age, the plasma levels ranged from 20 to 479pg/ml for MN and 20 to 3626pg/ml for NMN, respectively. One MN value (479pg/ml) and one NMN value (3626pg/ml) were identified as aberrant values and were excluded. Therefore, the range of results in the remaining 644 samples was 20–165pg/ml for MN, with a median of 25pg/ml, and 20–612pg/ml for NMN, with a median of 67pg/ml.
In the case of MN, significant gender differences were observed (p<0.0001), with a median and interquartile range of 29 (21–40)pg/ml for males (n=237) and 24 (20–33)pg/ml for females (n=407). However, no significant association was observed between MN levels and patient age (rho=0.02; p=0.67).
In the case of NMN, no significant gender differences were observed (p=0.95), with a median and interquartile range of 68 (44–96)pg/ml for males (n=237) and 67 (47–91)pg/ml for females (n=407). By contrast, a significant positive association was observed between NMN levels and patient age (rho=0.19; p<0.0001) (Fig. 1). On comparing the NMN results stratified according to age groups (<40 years, 40–60 years and >60 years), significant differences were observed among the three groups (p<0.0001), with a median and interquartile range of 48 (40–61)pg/ml for patients <40 years (n=66), 65.5 (46–89)pg/ml for individuals aged 40–60 years (n=250), and 76 (51–101.5)pg/ml for those >60 years (n=328), respectively (Fig. 2).

.")
The reference value obtained for MN according to the nonparametric method (Clinical and Laboratory Standards Institute, EP28-A3c) was (value and 90% confidence interval): 55 (53–60)pg/ml for all individuals (n=644), regardless of age or gender.
The reference values obtained for NMN were: 168 (146–187)pg/ml for all individuals (n=644), 97(85–129)pg/ml for individuals <40 years (n=66), 164 (134–188)pg/ml for individuals aged 40–60 years (n=250), and 180 (157–223)pg/ml for individuals >60 years of age (n=328).
With regard to the biological variability study, NMN exhibited values between 23 and 119pg/ml, with a mean value of 72.4pg/ml. The analytical coefficient of variation (CV) was 8.2%. The CVI and CVG obtained based on the formulas described above were 32% and 19.6%, respectively. Therefore, the individuality index (II) obtained was 1.63. Since this index was greater than 1.4, the individuality of the test is considered to be low, and it is not advisable to use the reference value of the change to detect significant changes; rather, the use of population reference values is considered more appropriate. The results for MN were similar, with CVI>CVG, and therefore the individuality index (II) obtained was >1.4.
DiscussionTo the best of our knowledge, this is the first study in Spain to assess the diagnostic performance obtained with the routine measurement of PFMs using a reference method (liquid chromatography coupled to tandem mass spectrometry) and other classical biochemical tests. The results obtained show that MNs, in both plasma and urine, are better markers of PCT/PGL than the other biochemical parameters (plasma and urinary catecholamines, and urinary VMA). This supports the notion that catecholamines and VMA provide little additional information beyond that already afforded by MNs, and consequently should not be used for the diagnosis of PCT/PGL. However, many clinicians still request these tests.
The determination of PFMs constitutes a test with a good performance in diagnosing these tumours. However, their quantification represents an analytical challenge for the laboratory, due to their low plasma concentration. Mass spectrometry offers excellent sensitivity and specificity in the determination of these analytes, and has been established as a reference method.
Plasma free metanephrines have some advantages over urinary MNs, such as relatively easy sample collection, easier control regarding the effects of diet and medication, and the possibility of using the test in patients with chronic kidney disease, where urinary MNs are of no use.25 However, one of its main limitations is the need for very strict control of the pre-analytical conditions in which sample collection occurs.26,27 A recent meta-analysis concluded that PFM sensitivity is significantly higher when the blood samples are obtained with the patient in the supine rather than in the sitting position (95% vs. 89%; p<0.02). In addition, the specificity of PFMs in the supine position is significantly higher than that of urinary MNs (95% vs. 90%; p<0.03).28 Our study obtained results very similar to those described above, with the two tests showing the same sensitivity (91%), and PFM exhibiting greater specificity (94%) than urinary MNs (89%), on considering those patients where both tests were requested.
Another key aspect for achieving optimal performance in determining PFMs is the use of adequate reference values. In this regard, the ideal reference population comprises patients who are studied for suspected PCT/PGL and in whom the disease is finally discarded.2
The results of our study show that the plasma MN levels exhibit no differences according to age, though there are gender differences, with significantly higher (but clinically irrelevant) levels in males. By contrast, the NMN levels increase significantly with advancing patient age. Accordingly, the reference value obtained was close to 100pg/ml in younger patients (<40 years of age) versus 164pg/ml in patients aged 40–60 years (very similar to the currently used reference value), and 180pg/ml in older patients (>60 years). Therefore, using age-differentiated reference values can reduce the number of false negative findings in younger patients and false positive readings in older individuals. Other authors have obtained similar results, with stable MN levels over the entire age range and NMN levels that increase with age.29 Specifically, Lenders and Eisenhofer2 recommend the use of a single reference value for MN (88.8pg/ml) and a variable value for NMN conditioned to patient age: 86.1pg/ml (5–17 years); 106.3pg/ml (18–29 years); 128.2pg/ml (30–39 years); 144.7pg/ml (40–49 years); 159.4pg/ml (50–59 years); and 192.4pg/ml (>60 years). Based on our results and those reported in the literature, it seems clear that in order to maximize the sensitivity of this test without significantly reducing its specificity, we should lower the NMN reference value in patients <40 years of age from 165pg/ml to 100pg/ml (Fig. 2).
With regard to biological variability, since CVI for both MN and NMN is greater than CVG, it is not advisable to use the reference value of the change to detect individual significant changes that may be associated with the presence of PCT/PGL; instead, it is more appropriate to use population-based clinical decision values.
The greatest challenge in interpreting the biochemical results of MNs occurs when results close to the normal limit are obtained. In these cases, the reading obtained is more likely to be a false positive result due to drug treatment or a physiological increase in catecholamine levels than a true positive result, due to the low prevalence of PCT/PGL. The results of our study show that the combination of PFM with urinary fractionated MN is an adequate strategy for differentiating between true positive and false positive readings, since an elevation evidenced by both tests is strongly suggestive of PCT/PGL.
Regarding the possible causes of false negative results, it is important to remember that PGL of the head and neck are non-secretory tumours, and these tests are therefore normally of little use in such cases.2,13 In the present study, one of the three cases of PCT/PGL not detected with PFM testing corresponded to a patient with a jugular (non-secretory) PGL.
Another case was a 38-year-old woman with NMN 110pg/ml (>100pg/ml being proposed as the reference value in individuals <40 years of age). Therefore, with reference values adjusted for age and excluding non-secretory tumours, the sensitivity obtained is 94% (16/17 cases), with a decrease in specificity of only 0.4% (94.3%).
The limitations of our study include the small number of patients with plasma catecholamine measurement and the small number of cases of PCT with the determination of VMA in urine. This is because in the event of the simultaneous measurement of plasma and urinary catecholamines, our laboratory cancels the former test because it does not offer information complementary to that provided by urinary catecholamine testing. Furthermore, VMA measurement in urine is performed concomitantly with the determination of homovanillic acid and 5-hydroxy-indoleacetic acid; as a result, many of the VMA measurements were performed in patients with a suspected NET/carcinoid tumour. Another possible limitation is that the PFM reference values have been calculated taking into account all the patients studied, this being a population that probably includes some individuals on different drug treatments as well as patients for whom the other pre-analytical and sample extraction conditions might not have been recommended. However, we feel that the sample size involved, and the statistical tests applied, guarantee that the results obtained are reliable and representative of our population.
To sum up, this study validates the diagnostic usefulness of PFM determination in the routine clinical practice of a real-life working environment. Adjusting the clinical decision values for plasma NMN in younger patients allows for the increased sensitivity of this test. All clinicians should focus the biochemical diagnosis of PCT/PGL on the analysis of PFMs and urinary fractionated MNs, when available, avoiding the other classical biochemical tests.
Conflicts of interestThe authors declare that they have no conflicts of interest.
Please cite this article as: Martínez-Morillo E, Valdés Gallego N, Eguia Ángeles E, Fernández Fernández JC, Prieto García B, Álvarez FV. Rendimiento de las metanefrinas libres plasmáticas en el diagnóstico de los feocromocitomas y paragangliomas en la población asturiana. Endocrinol Diabetes Nutr. 2019;66:312–319.
