


Patients with cystic fibrosis (CF) undergo a slow and progressive process toward diabetes. Oral glucose tolerance test (OGTT) is recommended to diagnose impaired glucose levels in these patients. Continuous glucose monitoring (CGM) measures glucose profiles under real-life conditions.
ObjectiveTo compare OGTT and CGM results in CF patients.
MethodsPaired OGTT and 6-day CGM profiles (146.2±9.1h/patient) were performed in 30 CF patients aged 10–18 years.
ResultsAccording to OGTT, 14 patients had normal glucose tolerance (NGT), 14 abnormal glucose tolerance (AGT), and two cystic fibrosis-related diabetes (CFRD). In 27 patients (13 NGT, 13 AGT, 1 CFRD), CGM showed glucose values ranging from 140 to 200mg/dL during similar monitoring times (2%–14% with NGT, 1%–16.9% with AGT, and 3% with CFRD). Glucose peak levels ≥200mg/dL were seen in seven patients (3 NGT, 3 AGT, 1 CFRD).
According to CGM, two patients had all glucose values under 140mg/dL (1 NGT, 1 AGT). Seventeen patients had glucose levels ranging from 140 to 200mg/dL (10 NGT, 6 AGT, 1 CFRD). Ten patients (3 NGT, 7 AGT) had glucose values ≥200mg/dL for ≤1% of the monitoring time and one (CFRD) for >1% of the monitoring time.
ConclusionsOGTT results did not agree with those of the CGM. CGM allows for diagnosis of glucose changes not detected by OGTT. Such changes may contribute to optimize pre-diabetes management in CF patients.
Los pacientes con fibrosis quística (FQ) evolucionan lenta y progresivamente hacia la diabetes, siendo el test de tolerancia oral a la glucosa (TTOG) el método utilizado para diagnosticar sus alteraciones glucémicas. La monitorización continua de glucosa (MCG) proporciona perfiles de glucosa en condiciones de vida habituales del paciente.
ObjetivoComparar los resultados del TTOG y de la MCG en pacientes con FQ.
MétodosTTOG seguido de MCG (146,2±9,1h/paciente) en 30 pacientes con FQ (10-18 años de edad).
ResultadosSegún el TTOG, 14 pacientes presentaron tolerancia normal a la glucosa (TNG), 14 tolerancia anormal a la glucosa (TAG) y 2 diabetes relacionada con la fibrosis quística (DRFQ). En 27 pacientes (13 con TNG, 13 con TAG, uno con DRFQ) la MCG mostró valores de glucosa 140-200mg/dL durante periodos similares de tiempo (2-14%, 1-16,9% y 3%, respectivamente). Picos de glucosa ≥200mg/dL se observaron en 7 pacientes (3 con TNG, 3 con TAG y uno con DRFQ).
Según la MCG, 2 pacientes tuvieron todos los valores de glucosa <140mg/dL (uno con TNG y otro con TAG); 17 pacientes entre 140-200mg/dL (10 con TNG, 6 con TAG y uno con DRFQ); 10 pacientes ≥200mg/dL durante ≤1% del tiempo valorado (3 con NGT, 7 con TAG) y uno ≥200mg/dL durante >1% del tiempo valorado (con DRFQ).
ConclusionesLos resultados del TTOG no concuerdan con los de la MCG. La MCG permite el diagnóstico de anomalías de la glucosa no detectadas mediante el TTOG y sus resultados podrían contribuir a optimizar el tratamiento de la prediabetes en estos pacientes.
Cystic fibrosis (CF) patients undergo a slow and progressive process toward diabetes.1 Cystic fibrosis-related diabetes (CFRD) is associated with impaired lung function and nutritional status and, consequently, higher mortality rates.1,2 Moreover, decreased insulin secretion contributes to weight loss and lung function deterioration, even before CFRD is diagnosed.3–5 Thus, it is of the utmost importance to establish the right time to start insulin therapy.6–9
CFRD is usually diagnosed by the oral glucose tolerance test (OGTT). The International Society of Pediatric and Adolescent Diabetes (ISPAD)10 and the American Diabetes Association11 recommend annual OGTT screening in CF patients over 10 years of age.
Continuous glucose monitoring (CGM) provides glucose profiles under real-life conditions and has proved to be a useful clinical tool for evaluating changes in these profiles in CF patients12–14 even before CFRD is diagnosed by the OGTT.15–18 However, since the OGTT followed immediately by CGM maintained under real-life conditions for six days has not been reported to date, we aimed to compare OGTT and CGM profiles in this setting.
Patients and methodsPatientsProspective study (November 2012–May 2015) to evaluate OGTT and CGM profiles in 30 CF children treated at the Cystic Fibrosis Unit of the Vall d’Hebron Hospital, Barcelona. Inclusion criteria were age over ten and below eighteen years and genetically-confirmed CF. Patients with respiratory exacerbations in the previous 6 weeks, treated with steroids and/or growth hormone, and those receiving insulin therapy or who had a lung transplant were excluded.
Clinical characteristics were age: 14.6±2.6 years; sex: 46.7% male, 53.3% female; Tanner pubertal stage II to V; percent forced expiratory volume in one second (%FEV1): 85.76±15.39 (range: 39–119)19 and body mass index (BMI) Z-score values: −0.6±0.6 SD (range: −1.92 to +1.8).20 Twenty-seven were on enzyme replacement therapy and three (patients 5, 14 and 22) were not. Colonization by Staphylococcus aureus and intermittent or chronic colonization by Pseudomonas aeruginosa were found in 50% and 40% of patients, respectively. Glycated hemoglobin values (HbA1C) were in normal range in all patients (5.5%±0.14; range: 5.2%–5.8%). Genotypes were: homozygous F508Del (36.7%), heterozygous F508Del (40%) and other mutations (23.3%)
Oral glucose tolerance testThe OGTT (1.75g/kg dextrose, maximum dose 75g) was performed after an overnight fast preceded by a three-day diet (55% of calories from carbohydrates) and usual physical activity. Blood glucose and insulin samples were collected at 0, 30, 60, 90 and 120min. Glucose and insulin plasma levels were determined using a standard glucose oxidase method and chemiluminescence immunoassay (CentaurXpi, Siemens), respectively. According to the results, patients were classified as having normal glucose tolerance (NGT), abnormal glucose tolerance (AGT) which included Indeterminate glycaemia (INDET) and Impaired glucose tolerance (IGT) or CFRD, based on ISPAD and ADA criteria.10,11
Continuous glucose monitoring profilesImmediately after the OGTT was completed, CGM was performed using the Medtronic-iProTM2 system. The glucose sensor was inserted into subcutaneous tissue of the anterior abdominal wall and remained there for the six outpatient-real-life-day period. Patients entered a minimum of four self-monitored capillary blood glucose values (Accu-chek performa, Roche, Germany) for daily CGM calibration. The glucose evaluation period was 146.2±9.1h/patient (range: 102–155h/patient).
Fasting glucose (FG) was evaluated after an 8-h fast by calculating the mean of values obtained daily between 6.00 a.m. and 7.00 a.m. over the monitoring period. In line with previous studies,4,15–17 percentages of monitoring time in which glucose values remained between 140mg/dL and 200mg/dL and above 200mg/dL and the number of glucose peaks over 200mg/dL were recorded for each CGM profile.
Data analysisStatistical analysis was performed using Stata version13.1 (Stata Corp, College Station, TX). Descriptive analysis of baseline characteristics included mean, standard deviation, range for continuous variables and frequencies and percentages for discrete variables. Comparison between groups was performed using Kruskal–Wallis non-parametric test. All tests were considered statistically significant when the p-value was <0.05.
EthicsThis study was approved by the Ethics Committee of The Children's Hospital Vall d’Hebron. Parental written informed consent, and consent of the children, when applicable, were obtained from all participants.
ResultsOGTT. Relationship with CGM profilesAccording to plasma glucose values on the OGTT, fourteen patients (47%) had NGT, fourteen (47%) AGT, and two CFRD (6%) (Fig. 1). None had fasting plasma glucose over 126mg/dL. Thirteen of the fourteen patients with AGT had glucose intolerance and one (number 27) indeterminate glycemia.

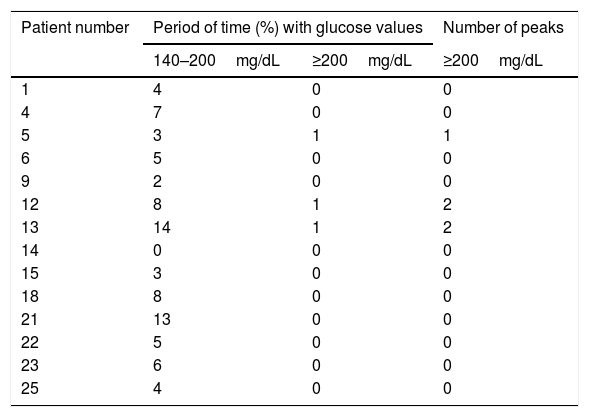
CGM readings in patients with NGT by the OGTT are shown in Table 1. All but one (patient 14) had glucose values between 140mg/dL and 200mg/dL during variable periods of monitoring time (range: 2%–14%). In addition, patient 5 had one glucose peak over 200mg/dL and patients 12 and 13 two each.
Continuous glucose monitoring evaluation in patients with normal glucose tolerance by oral glucose tolerance test.
| Patient number | Period of time (%) with glucose values | Number of peaks | |
|---|---|---|---|
| 140–200mg/dL | ≥200mg/dL | ≥200mg/dL | |
| 1 | 4 | 0 | 0 |
| 4 | 7 | 0 | 0 |
| 5 | 3 | 1 | 1 |
| 6 | 5 | 0 | 0 |
| 9 | 2 | 0 | 0 |
| 12 | 8 | 1 | 2 |
| 13 | 14 | 1 | 2 |
| 14 | 0 | 0 | 0 |
| 15 | 3 | 0 | 0 |
| 18 | 8 | 0 | 0 |
| 21 | 13 | 0 | 0 |
| 22 | 5 | 0 | 0 |
| 23 | 6 | 0 | 0 |
| 25 | 4 | 0 | 0 |
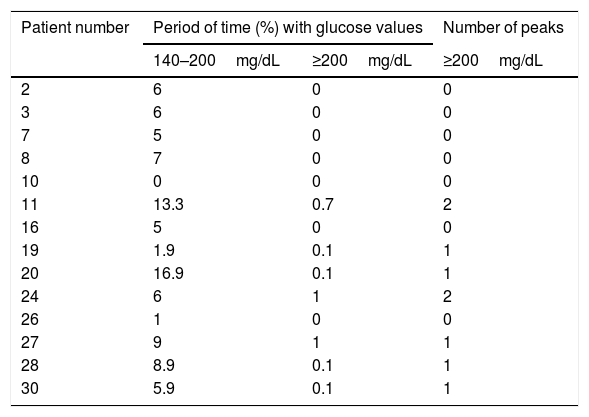
CGM readings in patients with AGT by the OGTT are shown in Table 2. All but one (patient 10) had glucose values between 140mg/dL and 200mg/dL during variable periods of monitoring time (range: 1%–16.9%). In addition, patients 19, 20, 27, 28 and 30 had one interstitial glucose peak over 200mg/dL, and patients 11 and 24 two each.
Continuous glucose monitoring evaluation in patients with abnormal glucose tolerance by oral glucose tolerance test.
| Patient number | Period of time (%) with glucose values | Number of peaks | |
|---|---|---|---|
| 140–200mg/dL | ≥200mg/dL | ≥200mg/dL | |
| 2 | 6 | 0 | 0 |
| 3 | 6 | 0 | 0 |
| 7 | 5 | 0 | 0 |
| 8 | 7 | 0 | 0 |
| 10 | 0 | 0 | 0 |
| 11 | 13.3 | 0.7 | 2 |
| 16 | 5 | 0 | 0 |
| 19 | 1.9 | 0.1 | 1 |
| 20 | 16.9 | 0.1 | 1 |
| 24 | 6 | 1 | 2 |
| 26 | 1 | 0 | 0 |
| 27 | 9 | 1 | 1 |
| 28 | 8.9 | 0.1 | 1 |
| 30 | 5.9 | 0.1 | 1 |
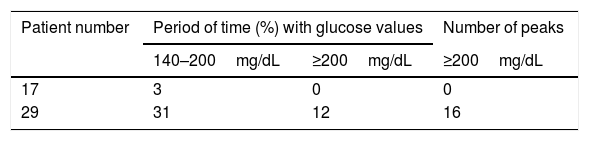
CGM readings in the two patients classified as CFRD by the OGTT are shown in Table 3. Patient 29 had glucose values on CGM readings concurring with the OGTT diagnosis and patient 17's results were similar to those found in patients with NGT and AGT according to the OGTT.
FEV1 and BMI were similar in the three groups with no statistically-significant differences among them (data not shown).
CGM profiles. relationship with OGTT resultsFasting glucose values in the CGM profiles were under 126mg/dL in 26 patients and between 126mg/dL and 156mg/dL in the remaining four (7, 17, 28 and 29).
According to the degree of glucose abnormalities found in the CGM profiles, patients were distributed in four groups (Fig. 1).
Group 1. Patients with glucose values under 140mg/dL throughout the monitoring period, n=2. Of these, one (number 14) had NGT and the other (number 10) AGT on the OGTT.
Group 2. Patients with glucose values between 140mg/dL and 200mg/dL during variable monitoring periods (range: 1%–13%), n=17. According to the OGTT, ten (1, 4, 6, 9, 15, 18, 21, 22, 23 and 25) had NGT, six (2, 3, 7, 8, 16 and 26) AGT and one17 CFRD. The percentage of monitoring time with glucose values between 140mg/dL and 200mg/dL ranged from 2% to 13% in NGT, from 1% to 7% in AGT and was 3% for the patient classified as CFRD. No statistically-significant differences in the mean percentage of monitoring time between 140 and 200mg/dL were observed between NGT and AGT patients (data not shown).
Group 3. Patients with glucose values between 140mg/dL and 200mg/dL during variable monitoring periods (range: 2%-17%) and over 200mg/dL for ≤1% of the total monitoring time, n=10. Three (5, 12 and 13) had NGT and seven (11, 19, 20, 24, 27, 28 and 30) AGT according to the OGTT.
Group 4. Patient with glucose values between 140mg/dL and 200mg/dL and over 200mg/dL for 31% and 12% of the total monitoring time, respectively, n=1 (number 29). This patient has CFRD according to the OGTT.
FEV1 and BMI were similar in the four groups with no statistically-significant differences among them (data not shown).
DiscussionIn CF patients, OGTT is the test recommended by the American Diabetes Association and ISPAD to diagnose AGT and CFRD.10,11 Although several CGM studies have evaluated glucose profiles in CF patients and shown abnormal glucose peaks even before CFRD is diagnosed by OGTT,15–18 the relationship of the latter with clinical outcomes and criteria for starting insulin therapy needs to be established. The majority of those CGM studies were conducted over a 72-h period and not immediately after the OGTT.
The present study compared the OGTT results with those of the CGM profiles over a longer period of time for all 30 patients. According to the OGTT, patients were classified as having NGT, AGT or CFRD, and the CGM profiles were analyzed in these three groups. CGM profiles were similar in patients with NGT and AGT by the OGTT. In addition, only one of the two patients with CFRD by OGTT had glucose values between 140mg/dL and 200mg/dL for 31% of the total CGM evaluation period and over 200mg/dL for 12% of that time, while the other had a similar profile to those found in patients with NGT and AGT by OGTT.
Furthermore, when patients were classified in four groups according to the degree of glucose abnormalities observed in the CGM profiles, no relationship was observed between CGM and OGTT results. Patients with similar CGM profiles had NGT, AGT and even CFRD on the OGTT. These data show that, in CF patients, the OGTT results observed did not concur with those found by the CGM system and agree with those reported by others.7,16,21
The OGTT measures plasma glucose; however, glucose values in CGM profiles may be close to those found in capillary blood, since capillary blood glucose values are used to calibrate the CGM system, and capillary blood glucose values are lower than plasma glucose values. In addition, errors affecting the OGTT (e.g. compliance lapses in the previous three-day dietary intake, among others) or CGM system calibration may account for the differences observed between the results of the two methods. The OGTT is an acute glucose overload test performed in a well-defined, in-hospital setting, while CGM constitutes a long-term glucose evaluation under real-life activity and dietary conditions. Thus, these two methods do not evaluate the same factors, which might have caused the disagreement between their results.
In our study, CGM detected abnormal glucose levels in CF patients with NGT according to the OGTT, and even discrete glucose abnormalities in a patient with CFRD according to the OGTT. These data suggest that CGM over six days period would be more informative of overall glucose levels than the OGTT. Moreover, the specificity of the OGTT has been reported to be poor in CF patients.22–25 However, the CGM is more expensive and may be troublesome for patients.
Our results also show that, in CF patients, CGM is able not only to detect a wide spectrum of glucose levels ranging from normal to abnormal, but also differences in the periods when glucose values are abnormal (1%–31% for glucose levels 140mg/dL–200mg/dL and 0% to 12% for glucose values over 200mg/dL). These results concur with those reported by others21–25 and suggest that CFRD may be a late event preceded by subtle glucose abnormalities which may be detected by CGM and not by the OGTT.7,16,18,21 However, the clinical repercussions of subtle glucose abnormalities and the right time to start insulin therapy need to be established, since decreased insulin secretion contributes to weight loss and lung function deterioration.6–9
Our CGM results also support the hypothesis that hyperglycemic values are present in nearly all CF patients, to a higher or lower degree. These glucose abnormalities might be caused not only by exocrine pancreas fibrosis but also by insulin secretion disorders due to the abnormal cystic fibrosis transmembrane conductance regulator (CFTR) in beta cells.26 The glucose-potentiated arginine test performed in CF patients with and without pancreatic sufficiency suggested that the loss of beta cell mass could be the major cause of CFRD.27 In our study, the three patients with pancreatic sufficiency had NGT on the OGTT; however, on CGM evaluation two patients (5 and 22) were found to have glucose peaks of 245mg/dL and 184mg/dL, respectively. These data would concur with the hypothesis that not only beta cell mass loss but also CFTR dysfunction may account for CFRD development.
In our work, glucose cut-off values on the CGM profiles were established in accordance with data reported by others.4,15–18 In addition, in CF patients, 140mg/dL is the glycemic value above which poor weight gain is likely to occur and is the threshold for glucose detection in the airway.28 The presence of glucose in airway secretions has been associated with higher rates of infections and colonization by pathogenic bacteria.28,29
In summary, in concordance with those previously published,4,13,15–18 our results show that CGM may be a useful clinical tool for evaluating glucose profiles in CF patients, allowing the diagnosis of subtle and early glucose abnormalities not detected by the OGTT. The early detection of abnormal glucose values could help to optimize the management of these patients before overt diabetes becomes established. However, more prospective CGM studies with higher number of patients, are required to ascertain the relationship between abnormal glucose values and the clinical onset of diabetes in CF patients.
Conflict of interestThe authors declare that there is no conflict of interest regarding the publication of this paper.
