


The study objective was to estimate during post-discharge follow-up the incidence of diabetes and to ascertain mortality in hospitalized patients, classified during follow-up as having stress hyperglycemia (SH) or normoglycemia (NG) based on blood glucose levels.
Material and methodsA retrospective cohort of non-diabetic adults with SH (>140mg/dl and HbA1c<6.5%) or NG (all blood glucose values ≤140mg/dl) was used.
ResultsThere were 3981 patients with NG and 884 with SH. During the observation period (median follow-up of 1.83 years), there were 255 cases of diabetes and 831 deaths. The cumulative incidence of diabetes per year was 1.59% (95%CI: 1.23–2.06) in patients with NG and 7.39% (95%CI: 5.70–9.56) in those with SH. SH was significantly associated to diabetes (crude HR 1.33, 95%CI: 1.13–1.73, p 0.025), even after adjusting for age and sex (adjusted HR 1.38, 95%CI 1.06–1.78, p 0.014). The mortality rate at one year was 10.07% (95%CI: 9.18–11.05) in NG patients and 13.24% (95%CI: 11.17–15.65) in SH patients. The sub-hazard ratio of developing diabetes considering death as a competitive event was 1.41 (95%CI 1.29–1.53, p<0.001).
ConclusionsSH is a risk factor for diabetes. There were no differences in mortality during follow-up, but death appears to be a competitive event in development of diabetes in this population.
El objetivo fue estimar la incidencia de diabetes y explorar la mortalidad de pacientes hospitalizados durante el seguimiento posterior al alta, clasificados durante la misma según el comportamiento glucémico como hiperglucemia de estrés (HE) o normoglucemia (NG).
Material y métodosCohorte retrospectiva de adultos no diabéticos con HE (>140mg/dl y HbA1c<6,5%) o NG (todos los valores de glucemia<=140mg/dl).
ResultadosSe identificaron 3981 pacientes con NG y 884 con HE. Durante el período de observación (mediana de seguimiento de 1,83 años), hubo un total de 255 casos de diabetes y 831 muertes. La incidencia acumulada de diabetes al año fue de 1,59% (IC95%:1,23-2,06) en NG y 7,39% (IC95% 5,70-9,56) en HE. HE se asoció significativamente con la incidencia de diabetes (HR crudo 1,33; IC95% 1,13-1,73; p 0,025), incluso después del ajuste por edad y sexo (HR ajustado 1,38; IC95% 1,06-1,78; p 0,014). La incidencia de mortalidad al año fue 10,07% (IC95%:9,18-11,05) en NG y 13,24% (IC95%:11,17-15,65) en HE. El sub hazard ratio de desarrollar diabetes considerando la muerte como evento competitivo fue 1,41 (IC95% 1,29-1,53; p<0,001).
ConclusionesLa HE es un factor de riesgo para desarrollar diabetes. No hubo diferencias de mortalidad en el seguimiento, pero la muerte parece comportarse como un evento competitivo al desarrollo de diabetes en esta población.
In-hospital hyperglycemia (HH), defined as a glycemia level of over 140mg/dl, may occur in a patient with diabetes, or as a manifestation of a phenomenon called stress hyperglycemia (SH), when the individual with HH does not meet the diagnostic criteria for diabetes or has no history of diabetes, in the presence of a glycosylated hemoglobin (HbA1c) concentration of under 6.5%.1,2 The frequency of SH varies greatly depending on the definition used, with reported incidences of 12–40%.3–5
Previous publications have recognized the association between HH and/or SH and increased mortality and morbidity (such as infectious complications or longer hospital stay) during admission.6,7 Other studies have suggested that SH is a risk factor for the development of diabetes and a mortality marker during follow-up after patient discharge.8 However, the results are controversial and variable, and are conditioned by the definition used for SH. In addition, the behavior of this phenomenon in our setting is not known, as there have been no local studies or publications corresponding to other Latin American countries.
The objective of this study was to estimate the incidence of diabetes and mortality during follow-up after discharge among patients classified as presenting SH or normal glycemia (NG) during their hospital stay.
Material and methodsA retrospective cohort study was carried out involving non-diabetic adults admitted for any reason between 1 June 2014 and 3 May 2015 to a multispeciality hospital in Argentina with a diagnosis of SH (defined as glycemia>140mg/dl with HbA1c<6.5%) or NG (defined as glycemia≤140mg/dl during hospital admission). We excluded patients with no blood glucose measurement upon admission, patients with hyperglycemia without HbA1c measurement, and pregnant women, since these present glycemia values that differ from those defining glycemic disorders. Patients receiving corticosteroid treatment were not excluded.
Our center is a multispeciality third-level university hospital in Buenos Aires (Argentina), with 750 beds (200 critical care beds). All clinical and administrative information in our hospital is collected and filed in a single centralized database accessible through the electronic case history (ECH), and from which the laboratory data for our study were obtained. All glycemia values during admission and all HbA1c measurements in the previous three months, during admission and/or after discharge were requested.
The patients affiliated to State prepayment constituted a closed cohort from which reliable data regarding death or loss to follow-up were obtained. For the purposes of the study, the patients were followed-up on from hospital discharge corresponding to the index admission (we excluded deaths occurring in hospital) to the appearance of a new diabetes problem, death, loss to follow-up or the date of administrative censoring (1 January 2017).
A new diagnosis of diabetes was established on the first date of one of the following: a new problem entered in the ambulatory ECH, and/or new insulin administration and/or glucose-lowering drug prescription from the pharmacy registry, and/or HbA1c after discharge ≥6.5%. In order to ensure adequate classification of blood glucose behavior (SH versus NG) during the index admission, as well as to identify the true cases of diabetes during follow-up, a manual review of the ECH was carried out by a specialist (from a random selection of patients or doubtful/suspected cases).
We estimated the cumulative incidence of diabetes and death at the different timepoints with the corresponding 95% confidence intervals (95%CI), as well as considering death as a competing event to diabetes. In order to estimate the cumulative incidence of diabetes, we calculated the time from the date of hospital discharge to the first date on which the diagnosis was recorded, in the presence of death as a competing event. In order to estimate the cumulative incidence of mortality, we calculated the time from hospital discharge to the date of death.
A Cox proportional hazards model was used to calculate the hazard ratio (HR) for death and its corresponding 95%CI. Kaplan-Meier curves for mortality were plotted according to glycemic behavior (SH versus NG) and were compared with the log-rank test.
A Fine and Gray multivariate regression model was used9,10 to estimate diabetes, with the competing event being taken into consideration. The variables gender and age were taken into consideration in the adjustment. The estimated crude and adjusted sub-hazard ratios (SHRs) were calculated with their 95%CIs.
Each statistical test considered two-tailed testing and p<0.05 for statistical significance. The STATA version 14.2 package (StataCorp.) was used for the statistical analysis.
The study protocol was evaluated and approved by the Institutional Review Board (CEPI number 2446).
ResultsA total of 25,331 adult patients were admitted during the study period. Based on the classification of glycemic behavior, we documented 8358 patients with NG and 1579 patients with SH. However, we excluded those patients who died during the index admission and those with non-institutional healthcare coverage, leaving 4865 patients for analysis (3981 with NG and 884 with SH (Fig. 1).

Regarding the baseline characteristics of our cohort (n=4865): 60.72% (n=2954) of the patients were female, with a median age of 74 years (interquartile range [IQR] 84–60). The admissions were on an emergency (i.e., non-elective) basis in 57.82% of the cases (n=2813), and 44.34% underwent surgery (n=2157). The median duration of admission was 3.8 days (IQR 6.9–2). The reasons for admission were classified as: non-cardiac surgery 42.75% (n=2080), clinical 37.35% (n=1817), cardiovascular 18.44% (n=897) and critical cases 1.46% (n=71). Table 1 shows the differences in patient baseline characteristics between the two glycemic behavior groups. The median duration of follow-up of this patient cohort was 1.83 years. During the observation period 255 cases of diabetes were detected and 831 deaths were recorded. In the SH group, 97 cases of diabetes were detected (10.97%, 95%CI 8.98–13.22), versus 158 cases in the NG group (3.97%, 95%CI 3.38–4.62). There were 180 deaths (20.36%, 95%CI 17.75–23.16) in the SH group and 651 deaths in the NG group (16.35%, 95%CI 15.21–17.53).
Baseline characteristics of the study population according to glycemia behavior.
| Stress hyperglycemia (n=884) | Normal glycemia (n=3981) | p-value | |
|---|---|---|---|
| Female gender | 58.03% (513) | 61.32% (2441) | 0.07 |
| Age, in years | 78 (69–85) | 73 (57–83) | 0.00 |
| Emergency admission | 54.19% (479) | 58.63% (2334) | 0.01 |
| Reason for admission | 0.00 | ||
| Clinical | 33.48% (296) | 38.21% (1521) | |
| Non-cardiac surgery | 37.22% (329) | 43.98% (1751) | |
| Cardiovascular | 25.57% (226) | 16.86% (671) | |
| Critical case | 3.73% (33) | 0.95% (38) | |
| Surgery | 53.85% (476) | 42.23% (1681) | 0.00 |
| Days of admission, median | 6 (3.45–10.45) | 3.4 (1.8–6) | 0.00 |
| Median glycemia during admission (mg/dl) | 125.08 (SD 28.03) | 100.50 (SD 13.11) | 0.00 |
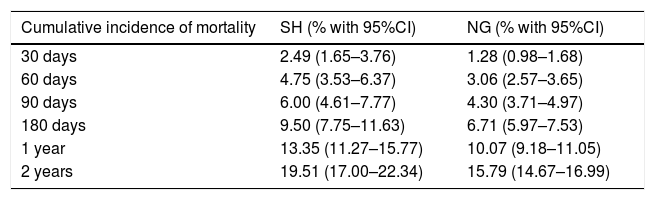
Table 2 shows the cumulative incidence of mortality in the groups according to glycemic behavior at different timepoints over follow-up.
Cumulative incidence of mortality according to glycemia behavior.
| Cumulative incidence of mortality | SH (% with 95%CI) | NG (% with 95%CI) |
|---|---|---|
| 30 days | 2.49 (1.65–3.76) | 1.28 (0.98–1.68) |
| 60 days | 4.75 (3.53–6.37) | 3.06 (2.57–3.65) |
| 90 days | 6.00 (4.61–7.77) | 4.30 (3.71–4.97) |
| 180 days | 9.50 (7.75–11.63) | 6.71 (5.97–7.53) |
| 1 year | 13.35 (11.27–15.77) | 10.07 (9.18–11.05) |
| 2 years | 19.51 (17.00–22.34) | 15.79 (14.67–16.99) |
Fig. 2 in turn shows the Kaplan Meier plot for estimating event mortality. Stress hyperglycemia was not significantly associated with the incidence of mortality (crude HR 1.02, 95%CI 0.87–1.21; p=0.742), even after adjusting for age and gender (adjusted HR 1.03, 95%CI 0.87–1.21; p=0.717).

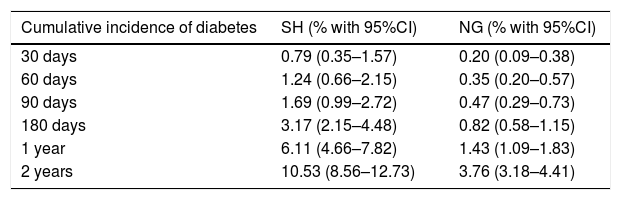
Table 3 shows the cumulative incidences of diabetes (death being considered as a competing event) at different timepoints over follow-up according to glycemic behavior (SH and NG).
Cumulative incidence of diabetes (with death as a competing event).
| Cumulative incidence of diabetes | SH (% with 95%CI) | NG (% with 95%CI) |
|---|---|---|
| 30 days | 0.79 (0.35–1.57) | 0.20 (0.09–0.38) |
| 60 days | 1.24 (0.66–2.15) | 0.35 (0.20–0.57) |
| 90 days | 1.69 (0.99–2.72) | 0.47 (0.29–0.73) |
| 180 days | 3.17 (2.15–4.48) | 0.82 (0.58–1.15) |
| 1 year | 6.11 (4.66–7.82) | 1.43 (1.09–1.83) |
| 2 years | 10.53 (8.56–12.73) | 3.76 (3.18–4.41) |
Fig. 3 shows the function for the cumulative incidence of diabetes, death being considered as a competing event. Stress hyperglycemia was significantly associated with the incidence of diabetes (crude SHR 2.82, 95%CI 2.19–3.65; p<0.01), even after adjusting for age and gender (adjusted SHR 2.65, 95%CI 2.03–3.47; p<0.01).
Discussion
In our cohort, the annual cumulative incidence of diabetes was 7.4% in patients with SH and 1.6% in those with NG. Other studies have reported similar differences. A Canadian study involving patients hospitalized due to pneumonia reported a 5-year incidence of diabetes of 14% in individuals with SH versus 6% in patients with NG.8 A Scottish cohort of hospitalized patients yielded a global three-year incidence of diabetes of 2.3%, though with variability conditioned to the glycemia values upon admission.11 The DIAFIC study15 reported an incidence of 7% at 8 months, with a higher cut-off value for defining SH. In an Australian study, assessment of the risk of developing diabetes yielded an SHR of 1.88 and an adjusted SHR of 1.91.12
By comparison, a study conducted in Iran reported an odds ratio (OR) of 3.418 for developing diabetes based on blood glucose levels upon admission.13
The mortality rate at one year was 13.24% (95%CI 11.17–15.65) in the SH group and 10.07% in the NG group (95%CI 9.18–11.05). Such high values might be attributable to the age of the cohort, drawn from an aging population. Unlike other studies,14 we observed no association between SH and mortality over follow-up (crude HR 1.02, 95%CI 0.87–1.21; p=0.742 and age- and gender-adjusted HR 1.03, 95%CI 0.87–1.21; p=0.717). A potential explanation for this discrepancy could be the duration of follow-up. Based on the above, we estimated the SHR for developing diabetes with death being considered as a competing event, with a crude SHR of 2.82, 95%CI 2.19–3.65 (p<0.01) and an SHR adjusted for age and gender of 2.65, 95%CI 2.03–3.47 (p<0.01).
A number of points should be taken into account regarding the present study: (a) Although this was a single-center study, our institution is a multispeciality hospital and a national reference center. In consequence, the results could be applicable to other similar populations or institutions; (b) The fact that ours was a closed cohort ensured correct event definition and classification (diabetes or death) and few losses to follow-up; (c) Although the exclusion of in-hospital deaths during index admission could constitute selection bias, it was consistent with the clinical objective (i.e., follow-up after hospital discharge); (d) The large sample size allowed for a precise estimation of the results; (e) Ours was a pragmatic cohort including elderly patients in a natural proportion, such individuals generally being under-represented in other studies.
We would have liked to have taken other important adjusting variables into consideration (e.g., the Charlson comorbidity index, oncological disease, cardiovascular risk, body weight or the body mass index, among others). However, this was not possible due to the characteristics inherent to the study design (data collection in retrospective studies depends on the availability of the information and its adequate recording in the case history). One of the relevant limitations of the study was that less than half of the patients with SH (42%) underwent at least one HbA1C measurement after discharge. This could have resulted in an underdiagnosis of diabetes over the follow-up period.
However, these findings do provide relevant information for the medical community regarding SH as a risk factor for developing diabetes during follow-up. This information is useful for decision making and for designing follow-up strategies following patient discharge.
Conflicts of interestThe authors declare that they have no conflicts of interest.
Please cite this article as: Russo MP, Grande Ratti MF, Giunta DH, Elizondo CM. Pacientes hospitalizados con hiperglucemia de estrés: incidencia de diabetes y mortalidad al seguimiento. Endocrinol Diabetes Nutr. 2018;65:571–576.
