


IntroductionCommon or non-syndromic obesity is a complex polygenic trait conditioned by biallelic or single-base polymorphisms called SNPs (Single-Nucleotide Polymorphisms) that present an additive effect and act synergistically. Most genotype-obese phenotype association studies include body mass index (BMI) or waist-to-height ratio (WtHR), and very few introduce a broad anthropometric profile.
ObjectiveTo verify whether a genetic risk score (GRS) developed from 10 SNPs is associated with the obesity phenotype assessed from anthropometric measures indicative of excess weight, adiposity and fat distribution.
Material and methodsA series of 438 Spanish schoolchildren (6–16 years old) were evaluated anthropometrically (weight, height, waist circumference, skinfold thickness, BMI, WtHR, body fat percentage [%BF]). Ten SNPs were genotyped from saliva samples, generating a GRS for obesity, establishing genotype-phenotype association.
ResultsSchoolchildren categorised as obese by BMI, ICT and %BF had higher GRS than their non-obese peers. The prevalence of overweight and adiposity was higher in subjects with a GRS above the median. Similarly, between 11 and 16 years of age, all anthropometric variables presented higher averages.
ConclusionsGRS estimated from the 10 SNPs can be a diagnostic tool for the potential risk of obesity in Spanish schoolchildren and could be useful from the preventive perspective.
IntroducciónLa obesidad común o no sindrómica es un rasgo poligénico complejo condicionado por polimorfismos bialélicos o de una sola base denominados single nucleotide polimorphisms (SNP) que presentan un efecto aditivo y que actúan sinérgicamente. La mayor parte de los estudios de asociación genotipo-fenotipo obeso incluyen índice de masa corporal (IMC) o índice cintura talla (ICT), siendo escasos los que introducen un amplio perfil antropométrico.
ObjetivoComprobar si una puntuación de riesgo genético (PRG) desarrollada a partir de 10 SNP se encuentra asociada al fenotipo de obesidad evaluado a partir de medidas antropométricas indicativas de exceso ponderal, adiposidad y distribución de la grasa.
Material y métodosUna serie de 438 escolares españoles (de 6 a 16 años) fueron evaluados antropométricamente (peso, talla, perímetro de la cintura, pliegues adiposos subcutáneos, IMC, ICT, porcentaje de grasa corporal [%GC]). Se genotiparon 10 SNP a partir de muestras de saliva que generaron una puntuación de riesgo genético de obesidad y establecieron asociación genotipo-fenotipo.
ResultadosLos escolares categorizados como obesos mediante IMC, ICT y %GC presentaron puntuaciones más altas de riesgo poligénico que sus pares no obesos. La prevalencia de exceso de peso y adiposidad fue más elevada en los sujetos con una PRG por encima de la mediana. Así mismo, entre los 11 y los 16 años todas las variables antropométricas presentaron promedios superiores.
ConclusionesLa PRG estimada a partir de los 10 SNP puede ser un instrumento diagnóstico del riesgo potencial de obesidad en escolares españoles, con utilidad desde una perspectiva preventiva.
As Genome-Wide Association Studies(GWAS) have demonstrated, common or non-syndromic obesity is a polygenic trait conditioned by biallelic or single-base polymorphisms called single nucleotide polymorphisms (SNPs), which have an additive effect and act synergistically.1 The review by Buniello et al.2 on a total of 60 GWAS studies showed that hundreds of variants associated with the obese phenotype have already been identified in the general population. The contribution of each one of them is modest to varying degrees and its expression depends to a large extent on the environment, which manifests itself above all through eating habits and exercise.3
Most of the GWAS studies have been performed using samples from the adult population, although in recent years some research has focused on the paediatric and adolescent age groups. One example is the meta-analysis published by Bradfield et al.,4 which analysed the association between SNPs and body mass index (BMI) from 30 previous studies. These studies were conducted with samples of young people between the ages of two and 18 years and with a wide diversity in terms of their ethnic and population origin, since they included series with populations with European, African, South American and Asian ancestry.
It should be borne in mind that the first SNP associated with obesity, located in the FTO gene, was identified in 2007.5 Other variants located in or near other genes were soon identified, such as TMEM18, INSIG2, GNPDA2, CLOCK, FAIM2, FAM120AOS and OLFM4, involved in the development of excess weight through different mechanisms such as regulation of appetite and satiety, increase in energy expenditure or metabolism of fats, to name but a few.6 Given the additive effect that the fact of having a homozygous or heterozygous genotype for the risk allele in each of the SNPs can have, the concept of genetic risk score (GRS) arose. This score is a tool that makes it possible to assess genetic predisposition to any trait, characteristic or complex disease, subject to additive heritability.7 The predictive capacity of the GRS is particularly recommended in cases where the sample size is heterogeneous or relatively small.8
Having deeper knowledge of the genotype-nutritional condition interactions in the paediatric and adolescent age groups is a fundamental aspect for a better understanding of obesity, as well as for a comprehensive and individualised approach to it, from prevention to treatment at younger ages. In light of the above, the aim of this study is to find out if the GRS based on a battery of 10 SNPs (already associated with obesity in the scientific literature) predicts the anthropometric profile in a sample of Spanish schoolchildren.
Material and methodsThis is a descriptive and analytical cross-sectional study in a sample of 438 Madrid schoolchildren between the ages of 6 and 16 years (60.05% male and 39.95% female). The data were collected between 2019 and 2021 from schools and sports centres in the Community of Madrid, Spain.
The data used in the study are anonymous and are disaggregated from information that can identify the subject. It was required to obtain the informed consent of the parents or guardians and the assent of the participants, respecting the bioethical principles of the Declaration of Helsinki in its most updated version,9 in addition to being approved by the Ethics Committee of the Autonomous University of Madrid (IEC-91-1699).
Each subject was anthropometrically assessed and their obesity GRS was calculated by genotyping 10 SNPs from saliva samples.
Anthropometric assessmentFollowing the protocols of the International Biological Program (IBP)10 and the International Society for the Advancement of Kinanthropometry (ISAK),11 height (cm), weight (kg), umbilical waist circumference (cm) and biceps, triceps, subscapular and suprailiac adipose skinfolds (mm) were measured. GPM anthropometer (1mm precision), SECA digital scales (100g precision), Holtain anthropometric tape and Holtain adipometer (constant pressure and 0.2mm precision) were used, always calibrated before the measurement process. From these direct dimensions, the BMI (weight kg/height m2) and the waist-to-height ratio (WHtR: waist circumference/height) were calculated. The body fat percentage (BF%) was estimated using the Siri equation, with prior calculation of density by applying the Brook or Durnin and Rahaman formulas, all described by Marrodán and González Montero de Espinosa.12 The nutritional diagnosis was made, taking the percentile references proposed by Marrodán et al. as cut-off points for waist circumference, adipose skinfolds, WHtR and BF%. 13–16 For BMI, the Cole and Lobsteincriterion was followed.17
GenotypingA total of 10 SNPs previously identified as being associated with common obesity in the paediatric and adolescent population were analysed, in a total of eight genes: rs6548238 (TMEM18 gene), rs7566605 (INSIG2 gene), rs10938397 (GNPDA2 gene), rs801260 (CLOCK gene), rs944990 (FAM120AOS gene), rs7138803 (FAIM2 gene), rs12429545 (OLFM4 gene) and three SNPs of the FTO gene (rs1558902, rs17817449 and rs9939609). DNA was extracted from saliva samples using the Speedtools Tissue DNA Extraction kit from BioTools B&M S.A. Subsequently, genotyping was carried out in the laboratories of the node of the Universidad de Santiago de Compostela [University of Santiago de Compostela] of the National Genotyping Centre (CeGen), which is part of the Plataforma en Red de Recursos Biomoleculares y Bioinformáticos del Instituto de Salud Carlos III [Network Platform for Biomolecular and Bioinformatic Resources of the Carlos III Health Institute]. iPLEX® Gold technology was used for the MassARRAY® platform from Agena Bioscience Inc.18 The genotypic and risk allele frequencies for each of the SNPs can be found in Appendix B of the supplementary material, Table S.1.
Statistical procedureThe genotype of each SNP was classified as per the methodology proposed by Jääskeläinen et al.,19 with two points awarded if the individual was homozygous for the risk allele, one point if heterozygous and zero points if homozygous for the alternate allele. The total GRS could therefore lie in a range between zero and 20 (no risk allele in the first case, risk homozygous for the 10 SNPs in the second). Following the criteria recommended by Zhao et al.,20 based on the median and quartiles, subjects were classified into levels from lower (GRS≤Q1) to higher (GRS>Q3) genetic risk. Parametric (Student's t, ANOVA) or non-parametric (Mann-Whitney U, Kruskal-Wallis) tests were used to establish the comparisons between groups, checking the normality of the distributions. For the prevalence analysis, the sample was stratified by age groups (6–10 and 11–18 years). The proportions were contrasted using a Chi-square test (χ2). P values ≤.05 were considered statistically significant. Data were analysed with the IBM SPSS 24 statistical package.
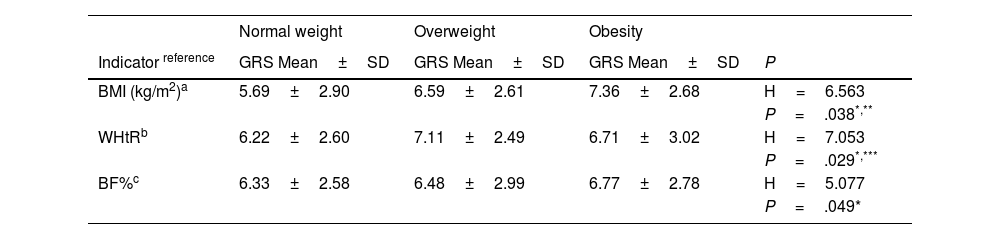
ResultsOverall, 31.10% of the individuals in the sample were overweight according to BMI (22.50% overweight and 7.60% obese). Some 47.10% of the participants had a high BF% (17.60% between the 90–97th percentile and 29.50% >97th percentile) and 43.40% had abdominal obesity according to the cut-off points of the WHtR. As shown in Table 1, for direct measurements (waist circumference and adipose skinfolds) no differences were observed between the average GRS obtained by schoolchildren classified above the 90th percentile compared to the rest. However, subjects with overweight and obesity according to BMI, BF% and WHtR obtained significantly higher genetic risk scores than those with normal weight. The anthropometric profile of the participants can be consulted in Appendix B of the supplementary material, Table S.2.
Comparison of the genetic risk score (GRS) based on the nutritional status of schoolchildren, evaluated according to different anthropometric indicators (n=438).
| Normal weight | Overweight | Obesity | ||
|---|---|---|---|---|
| Indicator reference | GRS Mean±SD | GRS Mean±SD | GRS Mean±SD | P |
| BMI (kg/m2)a | 5.69±2.90 | 6.59±2.61 | 7.36±2.68 | H=6.563 |
| P=.038*,** | ||||
| WHtRb | 6.22±2.60 | 7.11±2.49 | 6.71±3.02 | H=7.053 |
| P=.029*,*** | ||||
| BF%c | 6.33±2.58 | 6.48±2.99 | 6.77±2.78 | H=5.077 |
| P=.049* |
| ≥p90 | |||
|---|---|---|---|
| Umbilical waist circumference (cm)d | 6.45±2.65 | 6.61±3.24 | H=0.352 |
| P=.657 | |||
| Triceps skinfold (mm)e | 6.41±2.67 | 6.75±2.83 | H=1.165 |
| P=.280 | |||
| Biceps skinfold (mm)e | 6.38±2.72 | 6.89±2.70 | H=2.784 |
| P=.085 | |||
| Subscapular skinfold (mm)e | 6.42±2.71 | 6.88±2.71 | H=1.961 |
| P=.161 | |||
| Suprailiac skinfold (mm)e | 6.39±2.67 | 6.89±2.93 | H=2.512 |
| P=.113 |
BF%: body fat percentage; BMI: body mass index; GRS: genetic risk score; SD: standard deviation; WHtR: waist-to-height ratio.
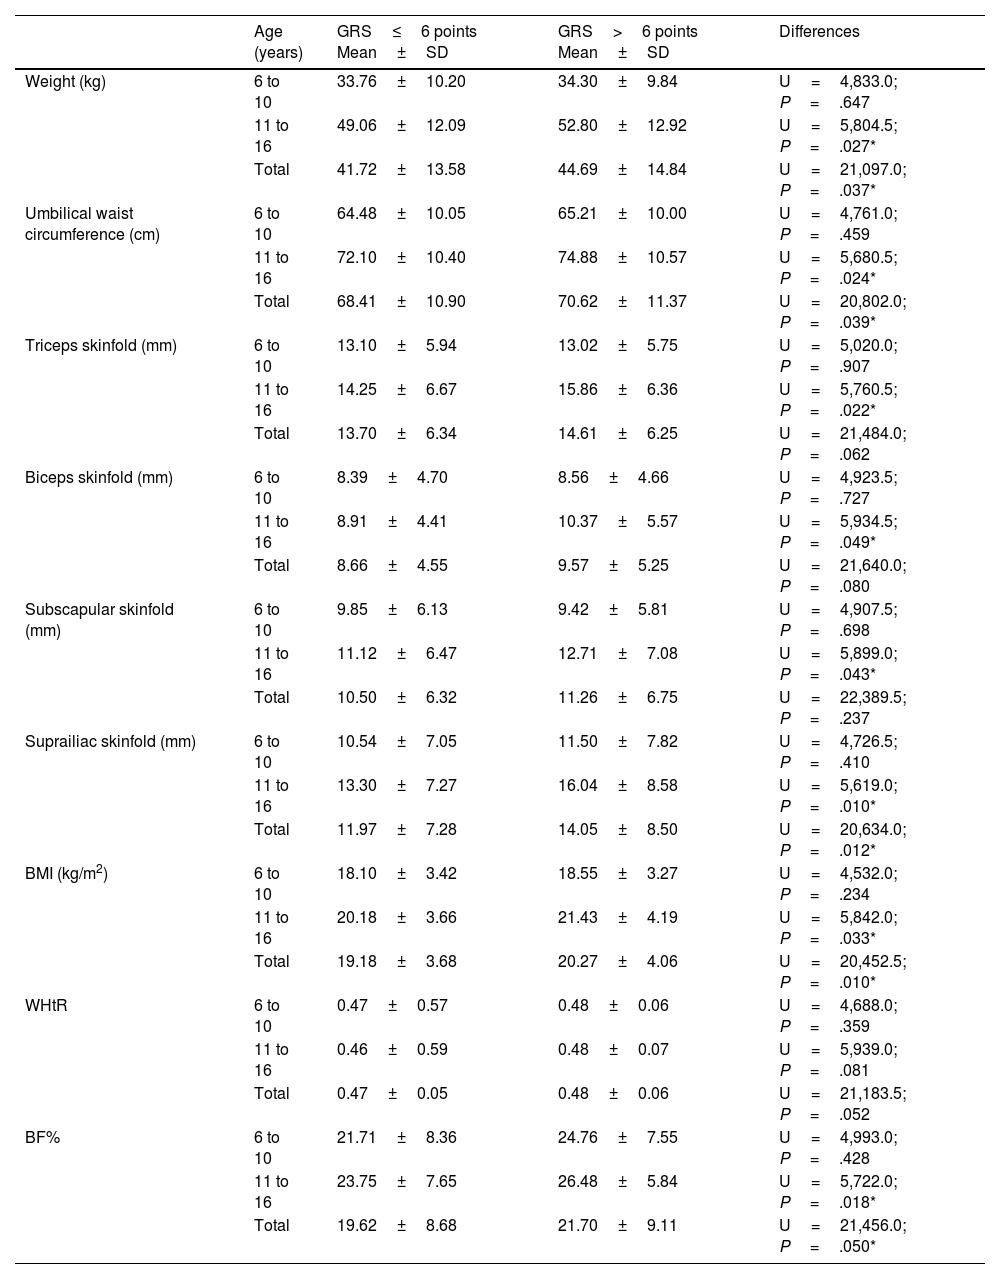
Table 2 compares the means for the direct and derived anthropometric variables depending on the GRS (above or below six points, median value). For all the parameters analysed, the highest averages corresponded to the category with the highest genetic risk. As can be observed, the subjects with GRS>6 points had greater weight, umbilical waist circumference, thickness of adipose skinfolds, BMI and BF% between 11 and 16 years of age (P<.05).
Comparison of means of anthropometric variables related to excess weight and adiposity between groups established according to age and the genetic risk score (GRS).
| Age (years) | GRS≤6 points Mean±SD | GRS>6 points Mean±SD | Differences | |
|---|---|---|---|---|
| Weight (kg) | 6 to 10 | 33.76±10.20 | 34.30±9.84 | U=4,833.0; P=.647 |
| 11 to 16 | 49.06±12.09 | 52.80±12.92 | U=5,804.5; P=.027* | |
| Total | 41.72±13.58 | 44.69±14.84 | U=21,097.0; P=.037* | |
| Umbilical waist circumference (cm) | 6 to 10 | 64.48±10.05 | 65.21±10.00 | U=4,761.0; P=.459 |
| 11 to 16 | 72.10±10.40 | 74.88±10.57 | U=5,680.5; P=.024* | |
| Total | 68.41±10.90 | 70.62±11.37 | U=20,802.0; P=.039* | |
| Triceps skinfold (mm) | 6 to 10 | 13.10±5.94 | 13.02±5.75 | U=5,020.0; P=.907 |
| 11 to 16 | 14.25±6.67 | 15.86±6.36 | U=5,760.5; P=.022* | |
| Total | 13.70±6.34 | 14.61±6.25 | U=21,484.0; P=.062 | |
| Biceps skinfold (mm) | 6 to 10 | 8.39±4.70 | 8.56±4.66 | U=4,923.5; P=.727 |
| 11 to 16 | 8.91±4.41 | 10.37±5.57 | U=5,934.5; P=.049* | |
| Total | 8.66±4.55 | 9.57±5.25 | U=21,640.0; P=.080 | |
| Subscapular skinfold (mm) | 6 to 10 | 9.85±6.13 | 9.42±5.81 | U=4,907.5; P=.698 |
| 11 to 16 | 11.12±6.47 | 12.71±7.08 | U=5,899.0; P=.043* | |
| Total | 10.50±6.32 | 11.26±6.75 | U=22,389.5; P=.237 | |
| Suprailiac skinfold (mm) | 6 to 10 | 10.54±7.05 | 11.50±7.82 | U=4,726.5; P=.410 |
| 11 to 16 | 13.30±7.27 | 16.04±8.58 | U=5,619.0; P=.010* | |
| Total | 11.97±7.28 | 14.05±8.50 | U=20,634.0; P=.012* | |
| BMI (kg/m2) | 6 to 10 | 18.10±3.42 | 18.55±3.27 | U=4,532.0; P=.234 |
| 11 to 16 | 20.18±3.66 | 21.43±4.19 | U=5,842.0; P=.033* | |
| Total | 19.18±3.68 | 20.27±4.06 | U=20,452.5; P=.010* | |
| WHtR | 6 to 10 | 0.47±0.57 | 0.48±0.06 | U=4,688.0; P=.359 |
| 11 to 16 | 0.46±0.59 | 0.48±0.07 | U=5,939.0; P=.081 | |
| Total | 0.47±0.05 | 0.48±0.06 | U=21,183.5; P=.052 | |
| BF% | 6 to 10 | 21.71±8.36 | 24.76±7.55 | U=4,993.0; P=.428 |
| 11 to 16 | 23.75±7.65 | 26.48±5.84 | U=5,722.0; P=.018* | |
| Total | 19.62±8.68 | 21.70±9.11 | U=21,456.0; P=.050* |
BMI: body mass index; WHtR: waist-to-height ratio; BF%: body fat percentage.
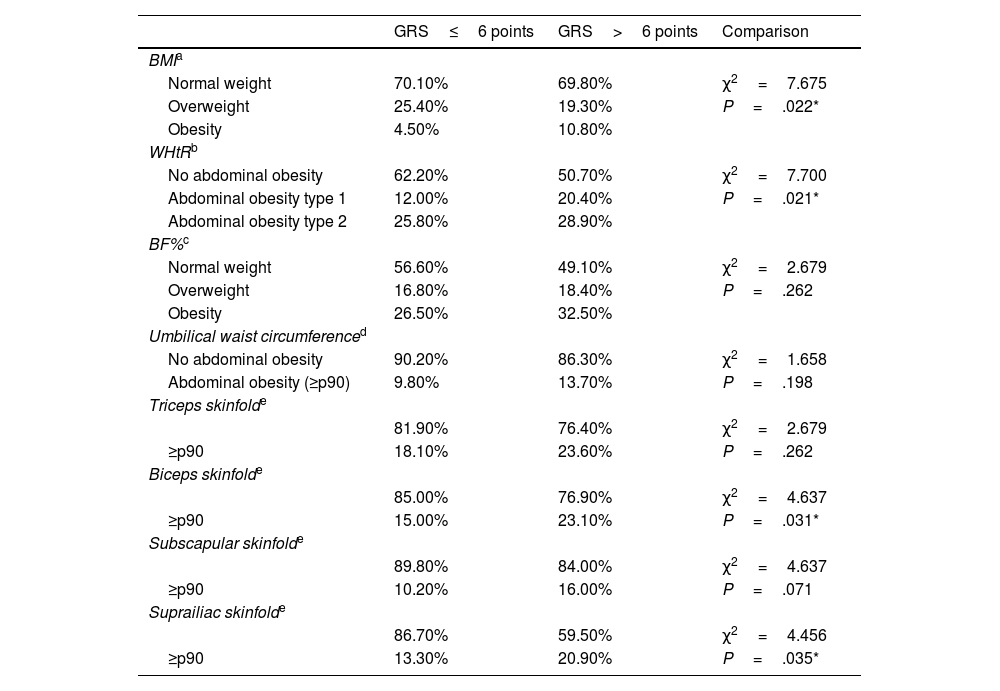
Table 3 shows the comparison of the prevalence of normal weight, overweight and obesity according to BMI, WHtR and BF% among schoolchildren with a lower and higher genetic predisposition to obesity based on the median of the GRS (six points). It also shows the comparison of the prevalence of abdominal obesity according to the measurement of the umbilical waist circumference and the triceps, biceps, subscapular and suprailiac skinfolds. The percentage of overweight and obesity categorised by BMI and WHtR is significantly higher among subjects with a higher genetic predisposition to obesity. Percentile values for biceps and suprailiac skinfolds are also significantly higher in subjects with higher scores for genetic predisposition to obesity.
Comparison of the prevalence of excess weight and adiposity based on the GRS comparing between groups of genetic risk of obesity established based on the median score.
| GRS≤6 points | GRS>6 points | Comparison | |
|---|---|---|---|
| BMIa | |||
| Normal weight | 70.10% | 69.80% | χ2=7.675 |
| Overweight | 25.40% | 19.30% | P=.022* |
| Obesity | 4.50% | 10.80% | |
| WHtRb | |||
| No abdominal obesity | 62.20% | 50.70% | χ2=7.700 |
| Abdominal obesity type 1 | 12.00% | 20.40% | P=.021* |
| Abdominal obesity type 2 | 25.80% | 28.90% | |
| BF%c | |||
| Normal weight | 56.60% | 49.10% | χ2=2.679 |
| Overweight | 16.80% | 18.40% | P=.262 |
| Obesity | 26.50% | 32.50% | |
| Umbilical waist circumferenced | |||
| No abdominal obesity | 90.20% | 86.30% | χ2=1.658 |
| Abdominal obesity (≥p90) | 9.80% | 13.70% | P=.198 |
| Triceps skinfolde | |||
| 81.90% | 76.40% | χ2=2.679 | |
| ≥p90 | 18.10% | 23.60% | P=.262 |
| Biceps skinfolde | |||
| 85.00% | 76.90% | χ2=4.637 | |
| ≥p90 | 15.00% | 23.10% | P=.031* |
| Subscapular skinfolde | |||
| 89.80% | 84.00% | χ2=4.637 | |
| ≥p90 | 10.20% | 16.00% | P=.071 |
| Suprailiac skinfolde | |||
| 86.70% | 59.50% | χ2=4.456 | |
| ≥p90 | 13.30% | 20.90% | P=.035* |
BMI: body mass index; WHtR: waist-to-height ratio.
Today it is fully accepted that genetic predisposition to common obesity, like other complex characteristics, is based on the additive effect of a multiplicity of SNPs. For this reason, the use of the unweighted GRS, the method used in this study, is considered a good analytical approach. This tool is particularly useful in studies of the association between the genetic profile and the anthropometric phenotype of obesity, even with relatively small samples.21
The 10 SNPs analysed were chosen because they had been found to be associated in isolation with obesity measured by BMI in the child or adolescent population in the scientific literature consulted and had been analysed in a previous study published by the authors on a small sample.22 These are, for the most part, markers that are located within or near genes that have to do with metabolic processes. Of these, it is undoubtedly the SNPs of the FTO gene that have been cited the most in relation to excess weight, both in children and in adults. From the first article by Frayling et al.,5 several authors have related this polymorphism with the capacity to eat, with appetite changes, with energy regulation, with the accumulation of triglycerides in adipose tissue or with the size of white adipocytes, especially with the variants of the SNP rs9939609.23 We also selected SNPs from the TMEM18 gene that codes for transmembrane protein18 that regulates insulin load, INSIG2 that is involved in cholesterol metabolism, GNPDA2 that codes for glucosamine-6-phosphate deaminase2, an isoenzyme that is involved in the metabolism of glucose, and the CLOCK gene that regulates circadian rhythms.24 Also included in the battery of SNPs were some from the OLFM4 gene, related to the inhibition of cell apoptosis in inflammatory processes, and from FAM120AOS and FAIM2 that code for a membrane protein that is expressed in the brain hippocampus and regulates neuronal apoptosis.24
It should be noted that, although there is abundant literature on the relationship between GRS evaluated from SNP and obesity phenotype, this is more numerous in the adult population, and with regard to anthropometric variables, most of the publications include BMI, waist circumference and WHtR, but there are still few that incorporate a broad anthropometric profile, including the measurement of direct or relative adiposity. In this sense, in this study GRS has been associated with the obese phenotype through various anthropometric indicators that incorporate not only BMI and indicators of fat distribution, but also the value of adipose skinfolds and BF%. The results have shown that GRS is associated not only with excess weight, but also with adiposity, both general and focal, that is, with abdominal obesity and skinfold size. This situation becomes particularly evident when disaggregating the sample by age groups, since between the ages of 11 and 16years the anthropometric differences are magnified for direct measurements and body composition based on the GRS.
From the evidence obtained, we can derive the fact that the variability of the nutritional condition associated with genetic predisposition, despite the fact that it is forged during childhood (where the tendency towards overweight is already greater in those with a higher genetic risk), exhibits its maximum influence at this stage of rapid growth and pubertal development. This fact is reflected especially in longitudinal studies, in which it is observed that the tendency for individuals with high GRS to develop excess weight peaks in adolescence, despite the fact that differences begin to be found at earlier ages.25
In relation to the above, and in support of what has been found here, it should be noted that certain recent studies, carried out on cohorts of European adolescents, suggest that the polygenic risk of obesity is expressed preferentially in the phase of ontogeny that corresponds to adolescence. This occurs through the mediation of different biological pathways or hormonal factors that act on the accumulation of body fat, appetite control and energy intake.26 In contrast, some research shows that genetic risk conditions the obese phenotype early. This is the case of the study performed by Monnereau et al.27 on a sample of close to 4000 Dutch schoolchildren in which a GRS constructed from 91SNPs (associated with obesity in adults) was associated with anthropometric indicators of overweight and abdominal obesity in six-year-old subjects. Along the same line, Belsky et al.28 reported that although GRS was not associated with birth weight, children with high scores gained weight and fat rapidly during the growth spurt phase that occurs in early childhood.
As indicated above, there are relatively few studies aimed at assessing the genetic risk profile for the development of obesity in subjects in the process of growth. It is necessary to cite the work of Seyednasrollah et al.29 in a sample of 1142 Finnish adolescents in which a GRS was constructed from 97SNPs that managed to predict excess weight; as well as the work that emerged from the HELENA study (Healthy Lifestyle in Europe by Nutrition in Adolescence) that enrolled 1069 adolescents and in which the obesity-associated GRS was made up of a total of 21 SNPs.30
This study has some limitations. In view of the results obtained, the effective sample would need to be increased to ensure the power of the observed associations. However, it also has some strengths. In the two studies referred to in the previous paragraph,27,30 the GRS was developed with a greater number of SNPs; at least double those used in our study. However, the GRS developed in our study is associated not only with BMI, but also with other anthropometric indicators that measure the amount and distribution of adipose tissue, thus providing new information. In conclusion, it can be stated that the GRS estimated from the 10SNPs considered constitutes a diagnostic tool for the potential risk of obesity in Spanish schoolchildren. Hence its usefulness as one further element to take into account for evaluating the nutritional condition with a preventive approach.
FundingProject PR41/17_21008Banco de Santander [Santander Group].
Conflicts of interestThe authors declare that they have no conflict of interest related to this publication.
The following is Supplementary data to this article:
