


Glycemic variability is an independent predictor of mortality in critically ill patients. The objective of this study was to compare two intravenous insulin protocols in critically ill patients regarding the glycemic variability.
Material and methodsThis was a retrospective observational study performed by reviewing clinical records of patients from a Critical Care Unit for 4 consecutive months. First, a simpler Scale-Based Intravenous Insulin Protocol (SBIIP) was reviewed and later it was compared for the same months of the following year with a Sliding Scale-Based Intravenous Insulin Protocol (SSBIIP). All adult patients admitted to the unit during the referred months were included. Patients in whom the protocol was not adequately followed were excluded. A total of 557 patients were reviewed, of whom they had needed intravenous insulin 73 in the first group and 52 in the second group. Four and two patients were excluded in each group respectively.
ResultsGlycemic variability for both day 1 (DS1) and total stay (DST) was lower in SSBIIP patients compared to SBIIP patients: SD1 34.88 vs 18.16 and SDT 36.45 vs 23.65 (p<0.001).
ConclusionA glycemic management protocol in critically ill patients based on sliding scales decreases glycemic variability.
La variabilidad glucémica es un predictor independiente de la mortalidad en pacientes críticos. El objetivo del presente estudio es comparar 2 protocolos de administración de insulina intravenosa en críticos en cuanto a la variabilidad glucémica se refiere.
Material y métodosSe trata de un estudio observacional retrospectivo realizado mediante revisión de historias clínicas de los pacientes de una unidad de críticos durante 4 meses consecutivos. Primero se revisó un protocolo de insulina más simple o protocolo de insulina intravenosa basado en una escala (PIVBE), que fue comparado con los mismos meses del siguiente año donde se utilizó protocolo insulina intravenosa basado en escalas dinámicas (PIVBED). Se incluyó a todos los pacientes, adultos, ingresados en la unidad durante los meses referidos. Se excluyó a los pacientes en los que el protocolo no se siguió correctamente. Se revisó a 557 pacientes, de los cuales habían necesitado insulina intravenosa 73 en el primer grupo y 52 en el segundo. Fueron excluidos 4 y 2 pacientes en cada grupo, respectivamente.
ResultadosLa variabilidad glucémica tanto del primer día (DS1) como la total de la estancia (DST) fue menor en aquellos pacientes tratados con el PIVBED frente al PIVBE: DS1 34,88 frente a 18,16 y DST 36,45 frente a 23,65 (p<0,001).
ConclusiónUn protocolo de manejo de glucemia en pacientes críticos basado en escalas dinámicas disminuye la variabilidad glucémica.
Hyperglycemia is a severity marker in critical patients, where it is associated with poor outcomes, and constitutes an independent mortality factor.1 It has recently been demonstrated that variability in blood glucose (glycemia) levels is also a predictor of mortality in critical patients, being regarded as even more important than hyperglycemia in this regard.1–8
Intravenous insulin perfusion (IVP) is the best approach for blood glucose control in critical patients.9 There are many protocols for the administration of IVP, though none have been shown to be superior to the rest,10 mainly because of the few studies that have been carried out in this respect. The study objective was to compares glycemic variability using two IVI administration protocols.
Patients and methodsA retrospective, observational study was conducted in a 12-bed medical-surgical intensive care unit (ICU) of a regional reference hospital. Following approval from the ethics committee of our hospital, a review was made of the clinical histories of patients admitted during four consecutive months in 2011, when a simpler scale-based intravenous insulin protocol (SBIIP) was used at the unit (Fig. 1). The data of that period were compared with those of the same months of 2012, when a sliding scale-based intravenous insulin protocol (SSBIIP) was used (Fig. 2). All adult patients admitted to the unit during those months were enrolled and classified into categories: polytrauma cases, surgical cases (including elective or emergency post-surgery patients or those who had undergone surgery in the previous seven days) and medical cases. Patients in whom the protocol was not adequately followed (defined as the existence of five or more failures during the application of the protocol) were excluded. Protocol failure was defined as any action taken in relation to blood glucose other than that which should have been carried out according to the protocol. The two study groups were in turn divided into patients with hyperglycemia who required IVI and those who did not. A total of 557 patients were reviewed, of whom 73 in the first group and 52 in the second group had required IVI. Four and two patients were excluded in each group respectively. A total of 3120 blood glucose measurements were made.
.")
.")
The protocol used in the first period (SBIIP) (Fig. 1) was designed to keep the blood glucose level between 80 and 150mg/dl. The measurements were made at the patient's bedside via capillary puncture or arterial blood sampling (according to nursing criterion) using an Optium Xcced glucometer® (Abbott Diabetes Care, MediSense Products, Doncaster, Australia), calibrated according to the instructions of the manufacturer. Measurements were made every hour at the start of infusion and after modification of the infusion rate, every 2h if no changes were seen between two consecutive measurements of 1h, and every 4h if no changes were found between two consecutive measurements of 2h.
The protocol used in the second period (SSBIIP) (Fig. 2) was designed to keep the blood glucose level between 140 and 180mg/dl, in compliance with the recent recommendations of scientific bodies, which have switched from strict control to a more permissive glycemia interval.11 The measurements were made via capillary puncture in hemodynamically stable postsurgery patients, in the absence of vasoactive drug perfusion, and in the first 48–72h of their stay at the Unit. In all other patients, the measurements were made using arterial blood. The frequency of the measurements was established taking into account the changes in algorithms following the protocol. The glucometer used was the same as in the previous period.
The standard deviation (SD) of the patient's glycemia values was used for calculating blood glucose variability.12 The primary endpoints were SD of the first day of stay (DS1) and SD of the total stay (DST), and we also recorded the mean blood glucose of the first day (GM1) and of the total stay (GMT), the number of samplings or measurements per patient (total and average), the daily intravenous insulin dose (total and average), and the number of hypoglycemia episodes (hypoglycemia being defined as blood glucose <60mg/dl). As secondary endpoints we documented the patient's age and gender, the Acute Physiology and Chronic Health Evaluation II (APACHE II) score, the admission category (polytrauma, surgical, medical), the presence of prior diabetes and its type, corticosteroid administration, enteral nutrition (EN) or total parenteral nutrition (TPN), the need for vasoactive drugs and the need for mechanical ventilation.
The statistical analysis was performed using Excel software to calculate SD, and SPSS software for all other calculations and analyses. Qualitative variables were reported as frequencies and percentages. Quantitative variables were given as the mean and SD or median and range, depending on whether the data were normally distributed or not, and comparisons between groups were made with a Student's t test and a Mann–Whitney U test respectively. Four linear regression models were generated to assess the variables (apart from the study intervention) with a potential impact on the result. The dependent variable was SD1 in the first two models and SDT in the other two models. Independent variables included the study intervention (SBIIP or SSBIIP, with the former taken as reference), the APACHE II score, the admission category (polytrauma, surgical, medical, with surgical cases taken as reference), the type of diabetes (stress, type 1, type 2 with oral antidiabetic drugs and type 2 with insulin, with stress hyperglycemia as reference), the need for vasoactive drugs, TPN, EN, corticosteroid use, and the need for mechanical ventilation. Backward stepwise regression was used in both cases to select the best model.
Values of p<0.05 were considered statistically significant.
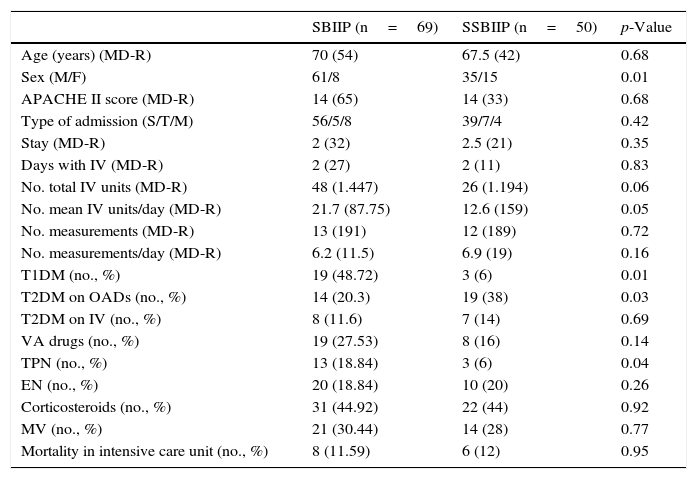
ResultsA total of 557 patients were reviewed in the two periods, of which 73 in the first group (SBIIP group) and 52 in the second group had received IVI (SSBIIP group). Four and two patients were excluded in each group respectively. Table 1 shows the demographic and clinical characteristics of the study patients. The only differences in these characteristics were that the second group included more females, fewer patients with type 1 diabetes (T1DM), more patients with type 2 diabetes (T2DM) being treated with oral antidiabetic drugs (OADs), and fewer patients with TPN.
Demographic and clinical characteristics of the patients.
| SBIIP (n=69) | SSBIIP (n=50) | p-Value | |
|---|---|---|---|
| Age (years) (MD-R) | 70 (54) | 67.5 (42) | 0.68 |
| Sex (M/F) | 61/8 | 35/15 | 0.01 |
| APACHE II score (MD-R) | 14 (65) | 14 (33) | 0.68 |
| Type of admission (S/T/M) | 56/5/8 | 39/7/4 | 0.42 |
| Stay (MD-R) | 2 (32) | 2.5 (21) | 0.35 |
| Days with IV (MD-R) | 2 (27) | 2 (11) | 0.83 |
| No. total IV units (MD-R) | 48 (1.447) | 26 (1.194) | 0.06 |
| No. mean IV units/day (MD-R) | 21.7 (87.75) | 12.6 (159) | 0.05 |
| No. measurements (MD-R) | 13 (191) | 12 (189) | 0.72 |
| No. measurements/day (MD-R) | 6.2 (11.5) | 6.9 (19) | 0.16 |
| T1DM (no., %) | 19 (48.72) | 3 (6) | 0.01 |
| T2DM on OADs (no., %) | 14 (20.3) | 19 (38) | 0.03 |
| T2DM on IV (no., %) | 8 (11.6) | 7 (14) | 0.69 |
| VA drugs (no., %) | 19 (27.53) | 8 (16) | 0.14 |
| TPN (no., %) | 13 (18.84) | 3 (6) | 0.04 |
| EN (no., %) | 20 (18.84) | 10 (20) | 0.26 |
| Corticosteroids (no., %) | 31 (44.92) | 22 (44) | 0.92 |
| MV (no., %) | 21 (30.44) | 14 (28) | 0.77 |
| Mortality in intensive care unit (no., %) | 8 (11.59) | 6 (12) | 0.95 |
OADs: oral antidiabetic drugs; APACHE II: Acute Physiology and Chronic Health Evaluation II; T1DM: type 1 diabetes mellitus; T2DM: type 2 diabetes mellitus; VA: vasoactive drugs; IV: intravenous insulin; F: female; MD: median; EN: enteral nutrition; TPN: total parenteral nutrition; SBIIP: scale-based intravenous insulin protocol; SSBIIP: sliding scale-based intravenous insulin protocol; S/T/M: surgical/polytrauma/medical; R: range; M: male; MV: mechanical ventilation.
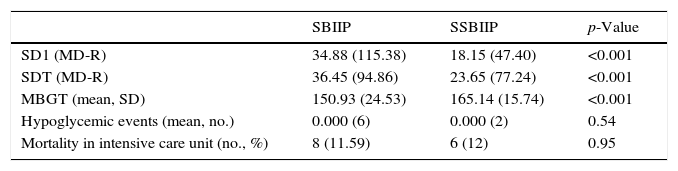
Both SD1 and SDT were lower in the second group (SSBIIP group), with p<0.001 in both cases: median 34.88 versus 18.15 for SD1 and median 36.45 versus 26.65 for SDT. There were no significant differences in mortality or the number of hypoglycemic episodes. These results are shown in Table 2.
Results.
| SBIIP | SSBIIP | p-Value | |
|---|---|---|---|
| SD1 (MD-R) | 34.88 (115.38) | 18.15 (47.40) | <0.001 |
| SDT (MD-R) | 36.45 (94.86) | 23.65 (77.24) | <0.001 |
| MBGT (mean, SD) | 150.93 (24.53) | 165.14 (15.74) | <0.001 |
| Hypoglycemic events (mean, no.) | 0.000 (6) | 0.000 (2) | 0.54 |
| Mortality in intensive care unit (no., %) | 8 (11.59) | 6 (12) | 0.95 |
SD: standard deviation; SDT: standard deviation of total blood glucose measurements of each patient; SD1: standard deviation of blood glucose measurements of the first day; MD: median; MBGT: mean total blood glucose during the stay of each patient; SBIIP: scale-based intravenous insulin protocol; SSBIIP: sliding scale-based intravenous insulin protocol; R: range.
On generating the linear regression model using only the study intervention as independent variable and DS1 as dependent variable, the resulting R2 was 0.205. The beta coefficients were 37.04 for the constant and −16.36 for the type of intervention (p<0.001). It may thus be concluded that the SSBIIP intervention was associated with a decrease in glycemic variability.
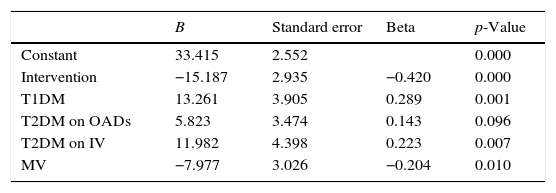
On repeating this model with the inclusion of other variables that might influence the results, the corresponding R2 was 0.332. Table 3 describes this model in detail.
Linear regression model using DS1 as dependent variable.
| B | Standard error | Beta | p-Value | |
|---|---|---|---|---|
| Constant | 33.415 | 2.552 | 0.000 | |
| Intervention | −15.187 | 2.935 | −0.420 | 0.000 |
| T1DM | 13.261 | 3.905 | 0.289 | 0.001 |
| T2DM on OADs | 5.823 | 3.474 | 0.143 | 0.096 |
| T2DM on IV | 11.982 | 4.398 | 0.223 | 0.007 |
| MV | −7.977 | 3.026 | −0.204 | 0.010 |
OA: oral antidiabetics; B: coefficient B; DM1: type 1 diabetes mellitus; DM2: type 2 diabetes mellitus; DS1: glycemic variability of the first day; IV: intravenous insulin; MV: mechanical ventilation.
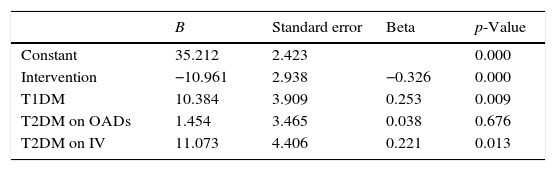
On generating the linear regression model using only the study intervention as independent variable and DST as dependent variable, the resulting R2 was 0.141. The beta coefficients were 39.61 for the constant and −12.63 for the type of intervention (p<0.001). It may thus also be concluded that the intervention was associated with a decrease in glycemic variability. On repeating this model with the inclusion of other variables that might influence the results, the corresponding R2 was 0.219. Table 4 describes this model in detail.
Linear regression model using DST as dependent variable.
| B | Standard error | Beta | p-Value | |
|---|---|---|---|---|
| Constant | 35.212 | 2.423 | 0.000 | |
| Intervention | −10.961 | 2.938 | −0.326 | 0.000 |
| T1DM | 10.384 | 3.909 | 0.253 | 0.009 |
| T2DM on OADs | 1.454 | 3.465 | 0.038 | 0.676 |
| T2DM on IV | 11.073 | 4.406 | 0.221 | 0.013 |
OADs: oral antidiabetic drugs; B: coefficient B; T1DM: type 1 diabetes mellitus; T2DM: type 2 diabetes mellitus; SDT: glycemic variability of the total stay; IV: intravenous insulin.
The most relevant finding of this study is that a sliding scale-based IVI protocol decreases both SD1 and SDT in critical patients.
Broad fluctuations in blood glucose have been related to increased mortality in seriously ill patients.7,13 The most widely recommended glycemia variability measures in the literature12 are the SD of glucose around the mean glucose value, the coefficient of variation (CV) of glucose, the percentage time of hyperglycemia and hypoglycemia, the area under the curve (AUC) above or below a certain glucose value, and the mean amplitude of glycemic excursions (MAGE). We chose SD because it is a parameter that has been used in other studies3,4 and is both relatively simple to calculate and reproducible.
The first research study to draw attention to glycemic variability in critical patients was published by Egi et al.3. In a cohort of 7049 patients, these authors demonstrated an increase in mortality among those individuals exhibiting greater variability (measured both with SD and with CV), and concluded that glycemic variability is an independent mortality predictor. Two years later these findings were corroborated by Krinsley14 in another study involving 3253 patients. Ali et al.15 reproduced the same results in septic patients. Dosset et al.16 also demonstrated increased mortality in surgical patients using SD. Waeschle et al.17 in turn found SD >20 to be associated with increased mortality. Interestingly, in a recent study the authors concluded that blood glucose variability increases mortality in critical patients, but not in those with prior diabetes–specifically, those with HbA1c>8.5%.7
The reason why such variability leads to poorer outcomes in critical patients is not clear, though some authors have suggested the possible induction of oxidative stress, increased cell apoptosis, or the deterioration of endothelial function.7,8,18
Intravenous insulin perfusion (IVP) is the best approach for blood glucose control in critical patients.9–11 Many protocols have been developed for the administration of IVP, in line with the blood glucose targets, the maximum glycemia value allowed for starting intravenous insulin, and the adjustment of insulin therapy, among other factors. Krikorian et al.10 reviewed a total of 26 protocols and observed an significant lack of homogeneity among them. According to these authors, none of the protocols were able to achieve the minimum desirable performance of an ideal protocol, i.e., the rapid achievement of the blood glucose target, with minimum hypoglycemia episodes, easy use and 100% patient adhesion.
Although the superiority of the approach has not been confirmed, it has been suggested that there may be a trend to a better control with protocols that use a sliding scale and take individual sensitivity to insulin into account, because of the insulin resistance shown by many critically ill patients.6,19 In our study we chose a sliding scale comprising several columns, scales or algorithms already described by Markovitz et al.20 in 2002, adapting it to the needs of the Department and modifying it on the basis of the current recommendations regarding hyperglycemia management in critical patients11,21 (target glycemia 140–180mg/dl), under the supervision of the Department of Endocrinology of the hospital, and having provided the nursing staff with the required training. This choice was based on the conviction that the best protocol is one that has been adapted both to each specific center, in order to promote the training and commitment of the healthcare staff involved, and to the particular patient population.10
Few studies have evaluated glycemic variability according to the protocol used. Recently, Raurell Torredà et al. conducted a prospective study of two protocols that differ in terms of the target blood glucose range, 110–140mg/dl versus 140–180mg/dl, and found lesser glycemia variability in the patients subjected to stricter blood glucose control.22 This result is exactly the opposite to that seen in our study, where variability was lower with the protocol involving a greater target blood glucose range. In our opinion, this means that glycemic variability is probably not dependent upon the target range but on other factors such as the administered insulin protocol.
Hypoglycemia is also considered to be an independent mortality risk factor in critical patients.23–25 In our study, more hypoglycemic episodes occurred with the first protocol (SBIIP), and although statistical significance was not reached, it cannot be ruled out that significance would have been reached had the study sample been larger.
In the present study there were no differences in terms of mortality, though SSBIIP reduced SD1 by 48% and SDT by 35% with respect to the first protocol (SBIIP). However, after making a comparison with the study published by Meynaar et al.4, where the critical patients that survived had SD=1.70 while those who died presented SD=2.02 (i.e., a reduction of 16%), it could be postulated that a larger sample might have resulted in differences.
The limitations of our study include the fact that it was conducted in a single hospital and in a patient population in which the inherent complexity of care did not rule out potential confounding factors that were not clinically evident. Most patients were in the postoperative period. The caloric requirements were not recorded, though Al-Dorzi et al.13 did not find them to be predictors of blood glucose variability. The target range differed between the protocols because the new recommendations in the international guidelines for blood glucose control in critically ill patients were made in the period between our use of the two protocols, and the new recommendations were therefore applied only in the second protocol. However, from the statistical perspective, it is always possible to compare two populations whether they have identical ranges or not. It is possible that a less strict blood glucose target range could influence glycemic variability by reducing the risk of hypoglycemic episodes. However, in our study there were no statistically significant differences in the number of such episodes, and as we commented above, a study22 has compared two equal protocols with different ranges, in which lesser variability was observed in the case of the protocol with the narrowest (or strictest) blood glucose range. This is in clear contrast to our own observations – thus suggesting that there are other factors that influence variability.
In the first group, blood glucose measurements were made via capillary puncture or arterial blood sampling at the discretion of the nursing staff, rather than based on a pre-established criterion as in the second group. Although the criterion was arbitrary, the more seriously ill patients or those receiving vasoactive drugs usually had an arterial catheter placed, which was used for measuring blood glucose. This was more convenient for both the patient and the staff in charge because it avoided the need for capillary puncture. We therefore think that, although nursing criterion prevailed, the practice was not very different from that found in the second group of patients.
Finally, the groups were not fully equivalent, since the SBIIP group included more patients both with T1DM and on TPN. A possible influence of these factors upon the results cannot therefore be ruled out. When the linear regression model was calculated using both SD1 and SDT as dependent variables, T1DM and T2DM patients on insulin treatment were found to have an influence on the results, increasing glycemic variability. Such results are consistent with those of earlier studies in which no clear explanation was found, although some authors attribute them to a greater number of hypoglycemic episodes in diabetic patients. In any case, both variables had less weight in the model than the intervention.
In our model, mechanical ventilation was found to be a variable that decreased SD1 only, though it also had less weight than the study intervention. However, other studies have reported a detrimental effect of mechanical ventilation upon blood glucose control, and we cannot therefore explain this influence based on the current results. Further studies are needed to clarify the relationship between mechanical ventilation and glycemic variability.
Despite the limitations of our study, a sliding scale-based protocol may be considered safe and able to decrease glycemic variability in our patients.
In conclusion, a sliding scale-based protocol decreases blood glucose fluctuations and variability, and thus, according to the current literature, could reduce mortality in critically ill patients. These algorithms are somewhat more complicated to apply and require greater training of the professionals involved to guarantee the outcomes as far as possible. In any case, additional studies comparing the safety and effectiveness of the different IVI protocols are needed.
Conflicts of interestNone of the authors have conflicts of interest.
Thanks are due to the nursing staff of the intensive care unit of the department of anesthesia and resuscitation of Albacete Hospital (Albacete, Spain) for their daily dedication, and to the department of endocrinology and nutrition.
Please cite this article as: Gómez-Garrido M, Rodilla-Fiz AM, Girón-Lacasa M, Rodríguez-Rubio L, Martínez-Blázquez A, Martínez-López F, et al. Comparación de 2 protocolos de insulina intravenosa: variabilidad de la glucemia en pacientes críticos. Endocrinol Diabetes Nutr. 2017;64:250–257.
