


The tall cell subtype of papillary thyroid carcinoma (PTC) is considered to have poor prognosis, but its diagnostic criteria have been modified on several occasions. The aim of our study was to find the best diagnostic criteria to relate the tall cell subtype with aggressiveness and poor prognosis.
Material and methodsIn 171 cases of classic subtype and tall cell subtype of PTC, the percentage of cells between two and three times taller than wide (C2−3) and cells more than three times taller than wide (Cx3) was determined by two observers, after obtaining reference images. Groups were made based on the percentage of cells of each component (<2%, between 2 and 10%, between 11 and 30%, between 31 and 50% and >50%) and were correlated with clinical and histopathological data. Interobserver agreement was also assessed.
ResultsAccording to the current WHO classification criteria, only 8 cases (5%) of tall cell subtype were identified. The comparison of the risk of recurrence at 5 years based on the percentage and type of cells showed that it increased significantly from >10% of the Cx3 cell component, while there were no significant differences in recurrence rate with any C2−3 cell percentages. Very good interobserver agreement was obtained (Kappa index: 0.83).
ConclusionsWe consider relevant reporting the presence of Cx3 cells from 10% in PTC as it is associated with a significant increase in the recurrence rate at 5 years. Interobserver agreement is very good if reference images are available.
El subtipo de célula alta del carcinoma papilar de tiroides (CPT) se considera de mal pronóstico, pero sus criterios diagnósticos han sido modificados en varias ocasiones. El objetivo de nuestro estudio fue la búsqueda de los mejores criterios en relación con la agresividad y al pronóstico.
Material y métodosEn 171 casos de subtipo clásico y subtipo de células altas de CPT se determinó, por dos observadores, el porcentaje de células entre dos y tres veces más altas que anchas (C2−3) y de células más de tres veces altas que anchas (Cx3), previa realización de imágenes de referencia. Se elaboraron grupos en función del porcentaje de células de cada componente (<2%, 2−10%, 11−30%, 31−50% y >50%) y se correlacionaron con datos clínicos e histopatológicos. Se valoró asimismo la concordancia interobservador.
ResultadosSegún los criterios actuales de la clasificación de la OMS, se identificaron únicamente 8 casos (5%) de subtipo de células altas. La comparación del riesgo de recidiva a los 5 años en función del porcentaje y tipo de células demostró que éste se incrementó significativamente a partir de >10% de componente de células Cx3, mientras que no existieron diferencias significativas entre porcentajes de células C2−3. Se obtuvo muy buena concordancia interobservador (índice Kappa: 0.83).
ConclusionesConsideramos recomendable informar de la presencia de células Cx3 a partir de un 10% en los CPT al asociarse a un aumento significativo de recidivas a los 5 años. La concordancia interobservador es muy buena si se dispone de imágenes de referencia.
The tall cell variant of papillary thyroid carcinoma (PTC) was described in 1976 by Hawk and Hazard as a histological variant with a poor prognosis, characterized by cells at least twice as tall as they are wide.1 Since then, multiple changes have been made in the World Health Organization (WHO) diagnostic criteria, changing the required cell height from at least twice as tall as they are wide to cells 3 times as tall as they are wide (Cx3) in 2004, reverting in 2017 to cells between 2 and 3 times as tall as they are wide (C2−3), and returning to Cx3 in 2022. In addition to these changes in cell description, changes have been made in the required percentage of tumor area occupied by tall cells for diagnosis: while the original description required the tall cell component to be clearly predominant, in 2004 it was required that tall cells should make up >50% of the tumor, and in 2017 the cutoff was cut down to 30%.2
Furthermore, numerous studies indicate that the tall cell variant is associated with a worse prognosis. This poor prognosis has been demonstrated regardless of the diagnostic criteria applied: 30% of cells at least twice as tall as they are wide,3 50% of cells at least twice as tall as they are wide,4 30% of C2-3,5 30% of Cx3,6 50% of Cx3,7 or studies with large case numbers obtained from databases where the criteria were likely not homogeneous.8,9
The greater aggressiveness of the tall cell variant has been determined by larger tumor size,10,11 higher rates of extrathyroidal extension,10–14 lymph node metastasis,12,14–17 and distant metastasis12–15,17,18 vs classical papillary carcinoma. Additionally, these tumors tend to occur in older patients,10,11,18 present more recurrences,10,13,15,16,19 and are associated with lower survival rates.10,12–17,19
Given the disparity in criteria used across different studies over time, which complicates their interpretation, we aimed to elucidate the best criteria that could define the tall cell variant so that its diagnosis would have prognostic significance. To this end, we evaluated cell height and the percentage of tumor area occupied by tall cells, correlating these with tumor characteristics and outcomes across different groupings, establishing the percentage at which the tall cell component becomes relevant and the height these cells should have.
Materials and methodsThis retrospective observational cohort study followed the STROBE guidelines. All cases coded as PTC in the Pathology Department of our hospital from January 1st, 2000 through December 31st, 2017, were selected for review. Before starting the case review, a tall cell case not included in the study period was selected to obtain images for measuring cell height and width and calculating height/width ratios. This established a reference for defining Cx3 and C2−3 to unify criteria among observers before the review began. The study was approved by the center Ethics Committee.
We conducted a histopathological review of all cases to confirm diagnosis and classify by histological subtype. Cases diagnosed with any subtype other than classical papillary carcinoma or tall cell variant were excluded. Tumors meeting all three of the following conditions were also excluded: maximum diameter<2mm, no lymph node involvement, and incidental diagnosis. For included cases, 2 observers (an experienced pathologist and a senior resident) reviewed the cases to determine the percentage of tall cells in the tumor. Each observer determined the percentage of Cx3 (Fig. 1) and C2−3 (Fig. 2). These percentages were recorded in intervals: <2%, 2−10%, 11−30%, 31−50%, and >50%. In cases where observers disagreed, a joint review was conducted to agree on the percentage of tall cells. Multicentricity, tumor-capsule relationship, presence or absence of oncocytic cytoplasm (abundant and eosinophilic), and elongated follicles in the tumor were also recorded.


From the included cases, relevant clinical data were obtained, such as age at diagnosis, sex, lesion size, lymph node involvement, distant metastasis, TNM stage, persistence of neoplasia after surgery, vital status, and presence of recurrence at 5 years and at the last available follow-up. Recurrence was defined as any evidence of disease, confirmed by histopathology, imaging, and/or biochemical tests. Persistence of disease after surgery was not considered recurrence. The 5-year follow-up was calculated from the date of thyroid surgery.
Descriptive methods were used for exploratory data analysis. For quantitative variables, the mean, standard deviation, and median were calculated. For qualitative variables, frequencies and proportions were determined. Inferential analyses were performed using IBM SPSS Statistics version 29.0.0.0, R version 4.3.1 (2023-06-16 ucrt), and RStudio 2023.09.0 Build 463. Associations were evaluated using the chi-square test or Fisher’s exact test. Interobserver agreement was assessed using the kappa coefficient and density plots. Statistical significance was set at 5%.
ResultsA total of 369 tumors from 366 patients (3 patients had 2 synchronous tumors of different histological types at surgery) were reviewed, 307 of which had nuclear features of PTC without a poorly differentiated carcinoma component. Of these, 171 patients had classical papillary carcinoma or tall cell variant.
The 136 excluded cases were excluded for the following reasons: 22 were incidental findings, <2mm, and without lymph node involvement; 22 were noninvasive follicular thyroid neoplasms with papillary carcinoma nuclear features; 2 were tumors of uncertain malignant potential; and 90 were subtypes other than classical or tall cell (81 follicular variant, 3 diffuse sclerosing variant, 2 oncocytic variant, 2 hobnail variant, 1 Warthin-like variant, and 1 cribriform morular carcinoma). Of the 171 included tumors, corresponding to 171 patients, using the current WHO criteria for tall cell variant (at least 30% of the tumor composed of Cx3),20 163 would be classified as classical papillary carcinoma and 8 as tall cell variant.
Twelve out of the 171 included patients did not have 5-year follow-up: 4 died from causes unrelated to the study, 1 died from thyroid carcinoma—with persistent neoplasm—and 7 were lost to follow-up, although 1 had recurrence before being lost. For this study, these patients were considered not to have recurrence, except for the one who recurred before being lost. Among the 12 patients, the patient who died from disease had 30–50% Cx3, 3 patients had 2−10% Cx3, and 8 patients had <2% Cx3, with 1 of them recurring.
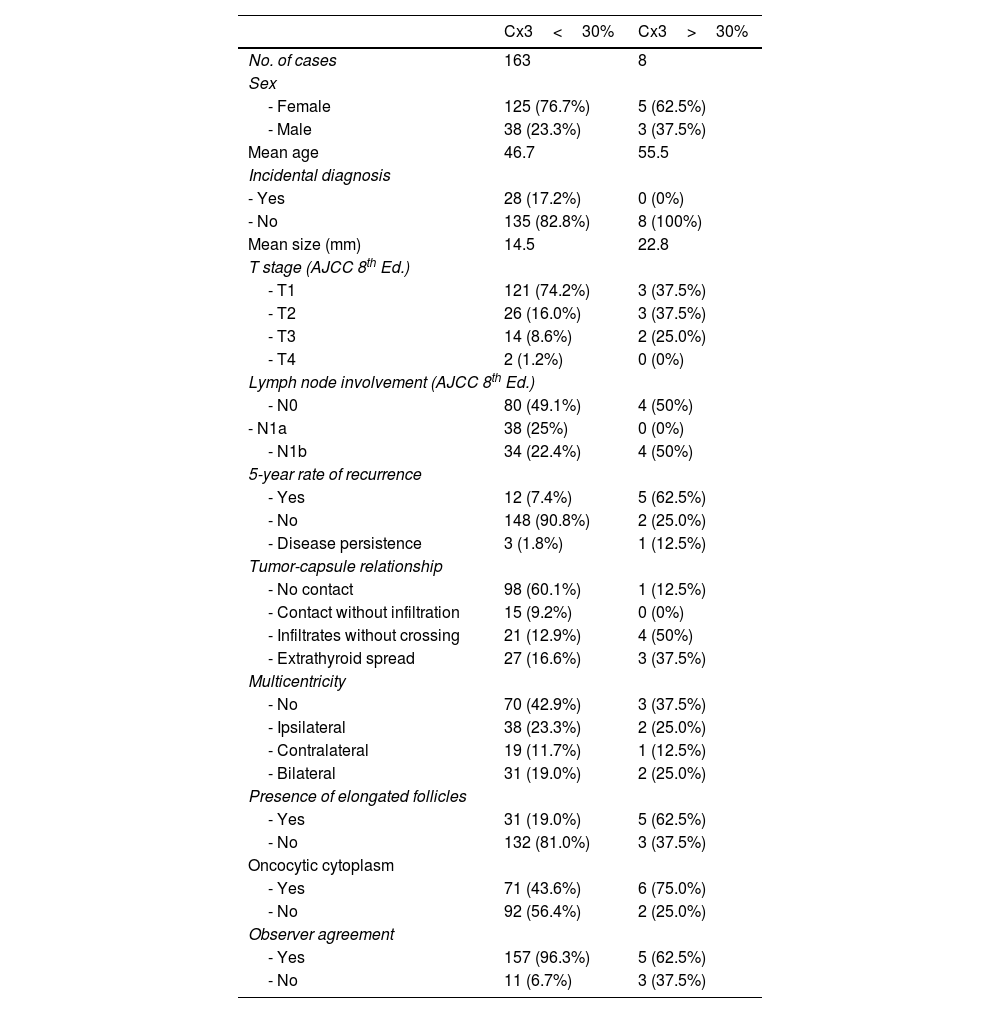
Comparative data for patients with classical papillary carcinoma and tall cell variant are shown in Table 1. In our series, patients with tall cell variant according to current criteria were older than those with classical papillary carcinoma and had a significantly higher 5-year recurrence risk (62.5% vs 7.4%). Morphologically, tall cell variant tumors more frequently showed elongated follicles (62.5% vs 19%) and oncocytic cytoplasm (75% vs 43.6%) vs classical papillary carcinoma. A more aggressive relationship with the thyroid capsule was also observed, with a higher frequency of extrathyroidal spread (37.5% vs 16.6%).
Comparison between classical papillary carcinoma cases and the high cell subtype (current WHO definition).
| Cx3<30% | Cx3>30% | |
|---|---|---|
| No. of cases | 163 | 8 |
| Sex | ||
| - Female | 125 (76.7%) | 5 (62.5%) |
| - Male | 38 (23.3%) | 3 (37.5%) |
| Mean age | 46.7 | 55.5 |
| Incidental diagnosis | ||
| - Yes | 28 (17.2%) | 0 (0%) |
| - No | 135 (82.8%) | 8 (100%) |
| Mean size (mm) | 14.5 | 22.8 |
| T stage (AJCC 8th Ed.) | ||
| - T1 | 121 (74.2%) | 3 (37.5%) |
| - T2 | 26 (16.0%) | 3 (37.5%) |
| - T3 | 14 (8.6%) | 2 (25.0%) |
| - T4 | 2 (1.2%) | 0 (0%) |
| Lymph node involvement (AJCC 8th Ed.) | ||
| - N0 | 80 (49.1%) | 4 (50%) |
| - N1a | 38 (25%) | 0 (0%) |
| - N1b | 34 (22.4%) | 4 (50%) |
| 5-year rate of recurrence | ||
| - Yes | 12 (7.4%) | 5 (62.5%) |
| - No | 148 (90.8%) | 2 (25.0%) |
| - Disease persistence | 3 (1.8%) | 1 (12.5%) |
| Tumor-capsule relationship | ||
| - No contact | 98 (60.1%) | 1 (12.5%) |
| - Contact without infiltration | 15 (9.2%) | 0 (0%) |
| - Infiltrates without crossing | 21 (12.9%) | 4 (50%) |
| - Extrathyroid spread | 27 (16.6%) | 3 (37.5%) |
| Multicentricity | ||
| - No | 70 (42.9%) | 3 (37.5%) |
| - Ipsilateral | 38 (23.3%) | 2 (25.0%) |
| - Contralateral | 19 (11.7%) | 1 (12.5%) |
| - Bilateral | 31 (19.0%) | 2 (25.0%) |
| Presence of elongated follicles | ||
| - Yes | 31 (19.0%) | 5 (62.5%) |
| - No | 132 (81.0%) | 3 (37.5%) |
| Oncocytic cytoplasm | ||
| - Yes | 71 (43.6%) | 6 (75.0%) |
| - No | 92 (56.4%) | 2 (25.0%) |
| Observer agreement | ||
| - Yes | 157 (96.3%) | 5 (62.5%) |
| - No | 11 (6.7%) | 3 (37.5%) |
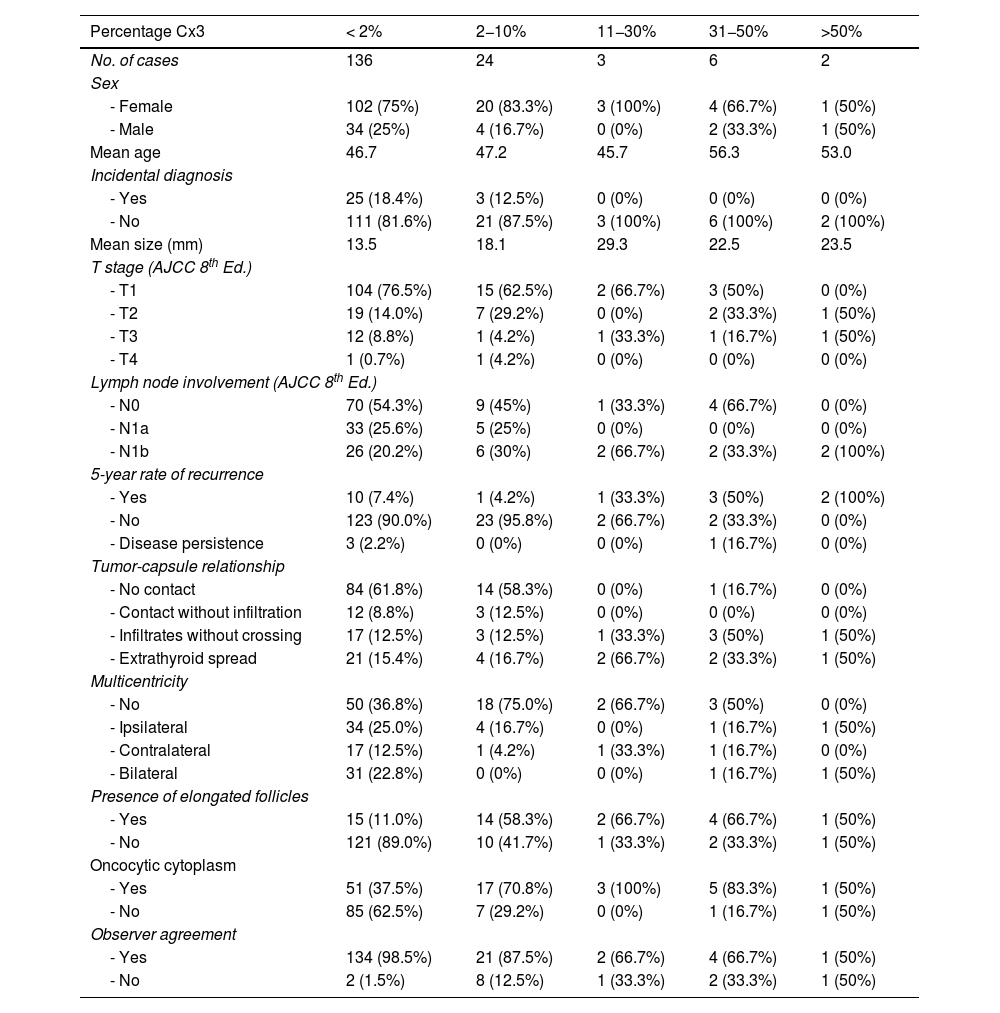
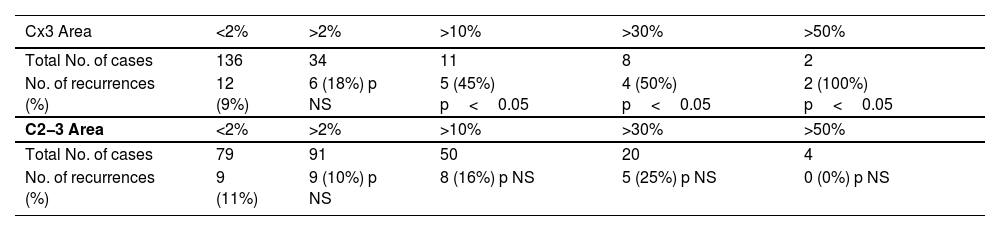
Table 2 shows data for groups stratified by the amount of Cx3. It shows how the 5-year recurrence risk and extrathyroidal extension frequency increased incrementally starting from the group with 11−30% tall cells. For recurrence risk, statistical significance was demonstrated starting from the group with 31−50%. Table 3 shows how stratifying the percentage of C2−3 and Cx3 by cutoff points modified recurrence risk: for Cx3, recurrences were significantly more frequent starting at 10% Cx3, while for C2−3, no cutoff reached statistical significance.
Case comparison according to the Cx3 component in percentage of area.
| Percentage Cx3 | < 2% | 2−10% | 11−30% | 31−50% | >50% |
|---|---|---|---|---|---|
| No. of cases | 136 | 24 | 3 | 6 | 2 |
| Sex | |||||
| - Female | 102 (75%) | 20 (83.3%) | 3 (100%) | 4 (66.7%) | 1 (50%) |
| - Male | 34 (25%) | 4 (16.7%) | 0 (0%) | 2 (33.3%) | 1 (50%) |
| Mean age | 46.7 | 47.2 | 45.7 | 56.3 | 53.0 |
| Incidental diagnosis | |||||
| - Yes | 25 (18.4%) | 3 (12.5%) | 0 (0%) | 0 (0%) | 0 (0%) |
| - No | 111 (81.6%) | 21 (87.5%) | 3 (100%) | 6 (100%) | 2 (100%) |
| Mean size (mm) | 13.5 | 18.1 | 29.3 | 22.5 | 23.5 |
| T stage (AJCC 8th Ed.) | |||||
| - T1 | 104 (76.5%) | 15 (62.5%) | 2 (66.7%) | 3 (50%) | 0 (0%) |
| - T2 | 19 (14.0%) | 7 (29.2%) | 0 (0%) | 2 (33.3%) | 1 (50%) |
| - T3 | 12 (8.8%) | 1 (4.2%) | 1 (33.3%) | 1 (16.7%) | 1 (50%) |
| - T4 | 1 (0.7%) | 1 (4.2%) | 0 (0%) | 0 (0%) | 0 (0%) |
| Lymph node involvement (AJCC 8th Ed.) | |||||
| - N0 | 70 (54.3%) | 9 (45%) | 1 (33.3%) | 4 (66.7%) | 0 (0%) |
| - N1a | 33 (25.6%) | 5 (25%) | 0 (0%) | 0 (0%) | 0 (0%) |
| - N1b | 26 (20.2%) | 6 (30%) | 2 (66.7%) | 2 (33.3%) | 2 (100%) |
| 5-year rate of recurrence | |||||
| - Yes | 10 (7.4%) | 1 (4.2%) | 1 (33.3%) | 3 (50%) | 2 (100%) |
| - No | 123 (90.0%) | 23 (95.8%) | 2 (66.7%) | 2 (33.3%) | 0 (0%) |
| - Disease persistence | 3 (2.2%) | 0 (0%) | 0 (0%) | 1 (16.7%) | 0 (0%) |
| Tumor-capsule relationship | |||||
| - No contact | 84 (61.8%) | 14 (58.3%) | 0 (0%) | 1 (16.7%) | 0 (0%) |
| - Contact without infiltration | 12 (8.8%) | 3 (12.5%) | 0 (0%) | 0 (0%) | 0 (0%) |
| - Infiltrates without crossing | 17 (12.5%) | 3 (12.5%) | 1 (33.3%) | 3 (50%) | 1 (50%) |
| - Extrathyroid spread | 21 (15.4%) | 4 (16.7%) | 2 (66.7%) | 2 (33.3%) | 1 (50%) |
| Multicentricity | |||||
| - No | 50 (36.8%) | 18 (75.0%) | 2 (66.7%) | 3 (50%) | 0 (0%) |
| - Ipsilateral | 34 (25.0%) | 4 (16.7%) | 0 (0%) | 1 (16.7%) | 1 (50%) |
| - Contralateral | 17 (12.5%) | 1 (4.2%) | 1 (33.3%) | 1 (16.7%) | 0 (0%) |
| - Bilateral | 31 (22.8%) | 0 (0%) | 0 (0%) | 1 (16.7%) | 1 (50%) |
| Presence of elongated follicles | |||||
| - Yes | 15 (11.0%) | 14 (58.3%) | 2 (66.7%) | 4 (66.7%) | 1 (50%) |
| - No | 121 (89.0%) | 10 (41.7%) | 1 (33.3%) | 2 (33.3%) | 1 (50%) |
| Oncocytic cytoplasm | |||||
| - Yes | 51 (37.5%) | 17 (70.8%) | 3 (100%) | 5 (83.3%) | 1 (50%) |
| - No | 85 (62.5%) | 7 (29.2%) | 0 (0%) | 1 (16.7%) | 1 (50%) |
| Observer agreement | |||||
| - Yes | 134 (98.5%) | 21 (87.5%) | 2 (66.7%) | 4 (66.7%) | 1 (50%) |
| - No | 2 (1.5%) | 8 (12.5%) | 1 (33.3%) | 2 (33.3%) | 1 (50%) |
Comparison of the effects of tumor area percentage of Cx3 and C2-3 morphology on recurrences.
| Cx3 Area | <2% | >2% | >10% | >30% | >50% |
|---|---|---|---|---|---|
| Total No. of cases | 136 | 34 | 11 | 8 | 2 |
| No. of recurrences (%) | 12 (9%) | 6 (18%) p NS | 5 (45%) p<0.05 | 4 (50%) p<0.05 | 2 (100%) p<0.05 |
| C2−3 Area | <2% | >2% | >10% | >30% | >50% |
| Total No. of cases | 79 | 91 | 50 | 20 | 4 |
| No. of recurrences (%) | 9 (11%) | 9 (10%) p NS | 8 (16%) p NS | 5 (25%) p NS | 0 (0%) p NS |
Comparison of the effects of Cx3 and C2−3 components on recurrences. p-Value calculated with Fisher's exact test. NS: not significant.
Only 1 out of the 171 patients included in the study died from the disease within the first 5 years after surgery—11 months after surgery—belonging to the 31−50% tall cell group and showing persistent disease after surgery. In addition to this patient, 3 others died from the disease, but after 5 years. Two of these 3 patients had no tall cells in the tumor, and the third belonged to the 31−50% group. All 3 had recurrence before 5 years.
A total of 4 patients had persistent disease, 1 of whom died before 5 years (with tall cell variant). Of the other 3, none had tall cells in the histological study and remain alive with controlled disease at the last follow-up 7, 14, and 16 years after total thyroidectomy and radioiodine treatment.
Regarding interobserver agreement, in 163 out of the 171 cases, both observers agreed on the Cx3 percentage, and only in 8 cases was joint review required to agree on the percentage. With these results, the kappa index for the diagnostic agreement of Cx3 was 0.83, indicating very good agreement. In the 2 discordant patients in the < 2% category of high cells, there was doubt with the 2−10% category. In the 2−10% category, 2 discordances were with the 11−30% category and 1 with < 2%. For the 31−50% group, 2 cases raised doubt with the 11−30% category. The discordant patient in the >50% category was discordant with the 31−50% category. When repeating the analysis for C2−3, the kappa index slightly dropped down to 0.8, still considered very good agreement.
DiscussionThe main conclusion of our study is that the presence of Cx3 in >10% of the tumor is relevant to the aggressiveness and prognosis of papillary thyroid carcinoma. This finding is consistent with other authors who recommend reporting the Cx3 component starting at 10% due to its adverse prognostic implications.6,21
Following the current WHO diagnostic criteria for tall cell variant (>30% Cx3), the percentage of cases in this category was very low in our series (5%), which is a major limitation of this study, but with a high recurrence rate (62.5%). Only 2 studies have reported higher recurrence rates: Moreno Egea et al.,3 with 5 tall cell cases and 80% recurrence, and Solomon et al.,22 with 30 cases and 70% recurrence. Interestingly, both studies used diagnostic criteria different from the current ones, as they were conducted before the current criteria were established. In any case, we believe that the current WHO classification cellularity criterion20 identifies cases with high aggressiveness and unfavorable outcomes but may be too restrictive, excluding cases where adverse behavior might be relevant.
Similarly, in the tall cell variant group following current WHO criteria,20 we observed morphological findings more frequently described in this subtype, such as elongated follicles and oncocytic cytoplasm. The latter has been attributed to abundant mitochondria in the cytoplasm, related to mitochondrial DNA mutations.23
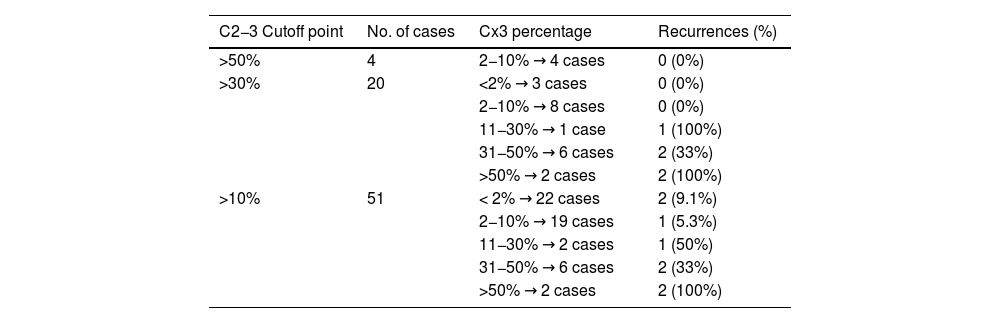
Another primary endpoint of our study was to evaluate differences in aggressiveness and prognosis based on the definition of tall cells (Cx3 or C2−3). Based on the results, C2−3 cells seem less relevant prognostically. Table 4 shows the characteristics of tumors with 10% or more tall cells stratified by C2−3 and Cx3 components. The data suggest that the recurrence rates observed in groups with C2−3 components can be explained by the Cx3 component present in these tumors. Additionally, no recurrences were observed in the two tumors with more C2−3 but minimal Cx3. Therefore, the Cx3 criterion seems better than C2−3 for defining a subgroup of more aggressive tumors. Our results, however, differ from those of Turchini et al.,24 who also evaluated the proportion of C2−3 and Cx3 in each tumor, finding that C2−3 is associated with poor prognosis, although their Cx3 group did not reach statistical significance. They also provided a subgroup analysis where the Cx3 component carried a worse prognosis only in low-risk papillary carcinomas. In that same subgroup, the C2−3 component did not reach statistical significance for poor prognosis. In conclusion, although our results cannot be directly compared with published data, they suggest that C2−3 cells act more as a confounding factor, without independently implying poor prognosis, which is determined by the Cx3 component that may exist in the same tumor. In our sample, 8 tumors had more than 30% Cx3, all of which also had more than 30% C2−3.
Effects of Cx3 component stratification according to the C2-3 component.
| C2−3 Cutoff point | No. of cases | Cx3 percentage | Recurrences (%) |
|---|---|---|---|
| >50% | 4 | 2−10% → 4 cases | 0 (0%) |
| >30% | 20 | <2% → 3 cases | 0 (0%) |
| 2−10% → 8 cases | 0 (0%) | ||
| 11−30% → 1 case | 1 (100%) | ||
| 31−50% → 6 cases | 2 (33%) | ||
| >50% → 2 cases | 2 (100%) | ||
| >10% | 51 | < 2% → 22 cases | 2 (9.1%) |
| 2−10% → 19 cases | 1 (5.3%) | ||
| 11−30% → 2 cases | 1 (50%) | ||
| 31−50% → 6 cases | 2 (33%) | ||
| >50% → 2 cases | 2 (100%) |
Simultaneous evaluation of the C2−3 and Cx3 components and their effects on recurrences. Cases are stratified according to the C2−3 component to show the effect of the Cx3 component.
Of note, the issues caused by changes in the diagnostic criteria for tall cell variant in recent WHO editions. In the 5th edition (2022), the height criterion for tall cell variant is Cx3.20 This height criterion is the same as before 2017. However, in the 4th edition (2017–2022), cells could be C2−3.25 According to Wong et al., this change tripled the prevalence from 8% with Cx3 up to 25% with C2−3.26 In our study, this trend was also observed, albeit with lower prevalences: 4.7% for tumors with more than 30% Cx3 and 12.7 % for more than 30% C2−3. Given that tumors with a relevant C2−3 component seem more frequent than those with Cx3 and may have a lower recurrence risk, it could be assumed that between 2017 and 2022, the diagnostic criteria for tall cell variant were suboptimal for selecting patients with poor prognosis, leading to overdiagnosis and overtreatment. These changes also complicate comparisons between studies, as different diagnostic criteria were applied depending on when they were conducted.
During data mining, 3 patients with persistent disease and available follow-up were identified. One had tall cell variant and died from the disease at 11 months, while the other 2—without tall cell component—remain stable with controlled disease >10 years after total thyroidectomy and radioiodine treatment with tolerable cumulative doses. This situation might indicate that certain non-aggressive thyroid tumors could have a tendency toward self-limitation, as proposed in some thyroid carcinogenesis models in the literature.27
In addition to defining the most appropriate diagnostic criteria for tall cell variant, another notable aspect is their reproducibility. For this reason, our study included an interobserver agreement analysis between an experienced pathologist and a senior resident, both for Cx3 and C2−3 percentages. The results, with a kappa index of 0.83 for Cx3 and 0.8 for C2−3, indicate very good diagnostic agreement. Therefore, we consider the morphological criterion of cell height to be reproducible for both Cx3 and C2−3. A strength of our study is the availability of reference images with cell measurements.
After literature review, only 2 interobserver agreement studies for tall cells were found, but they are difficult to compare with ours. The first, by Hernandez-Prera et al.,2 reported a kappa index of 0.34, but it was conducted in 2017 with different diagnostic criteria, involved 14 pathologists (vs 2 in our study), and lacked well-defined diagnostic criteria unification, unlike our study, where both observers had reference images with measurements. The second one, by Stenman et al.,28 also involved 2 observers, obtaining a kappa value of 0.566 with cutoffs of 10%, 30%, 50%, and 70%. Although their kappa value is lower than ours, comparison is difficult draw due to their use of 2017–2022 criteria (C2−3) and different cutoffs.
There is also another intraobserver agreement study where papillary carcinomas were classified based on their C2−3 and Cx3 components. In it, 20 cases were reviewed twice by the same observer with a 12-month interval, obtaining a kappa index of 0.79, similar to our study. However, it is not comparable either: first, because it studied intraobserver agreement; second, because the first review evaluated a single representative slide of the tumor, while the second reviewed the entire tumor; and finally, the diagnostic categories were not the same.24
Consequently, we consider our interobserver agreement study on tall cells to be the first of its kind, and more similar studies with precise reference images of C2−3 and Cx3 cells available to each observer would be interesting to draw more robust conclusions, especially given the small number of tall cell variant cases in our study, which we consider its main limitation.
ConclusionsBased on our results, the aggressiveness of classical papillary carcinoma or tall cell variant is related to the amount of cells > 3 times as tall as they are wide, with their presence becoming relevant starting at 10%. This suggests that reporting their presence in the pathological report starting at 10% is necessary, and the possibility of lowering the required percentage for diagnosing tall cell variant could be considered. The current criterion of > 30% results in few diagnoses, potentially ignoring patients with lower percentages who may still have a higher risk of recurrence or unfavorable outcomes.
Conversely, cells between 2 and 3 times as tall as they are wide do not seem to independently influence prognosis, acting more as a confounding factor.
Regarding the reproducibility of diagnostic criteria, our study achieved very good interobserver agreement (kappa index of 0.83), suggesting that the morphological criterion of cell height is valid and reproducible, likely facilitated by the availability of reference images with objective measurements.
FundingNone declared.
This work was conducted within the framework of the Doctoral Program in Surgery and Morphological Sciences at Universitat Autònoma de Barcelona (Barcelona, Catalonia, Spain).
We wish to thank the technical and administrative staff of the Pathology Department at Hospital Parc Taulí for their collaboration in obtaining the case list and histological material for review.
